. 2019 Jun 21:13:583.
doi: 10.3389/fnins.2019.00583. eCollection 2019.

Semiparametric Estimation of Task-Based Dynamic Functional Connectivity on the Population Level

Affiliations

Semiparametric Estimation of Task-Based Dynamic Functional Connectivity on the Population Level

Maria A Kudela et al. Front Neurosci. .

Abstract

Dynamic functional connectivity (dFC) estimates time-dependent associations between pairs of brain region time series as typically acquired during functional MRI. dFC changes are most commonly quantified by pairwise correlation coefficients between the time series within a sliding window. Here, we applied a recently developed bootstrap-based technique (Kudela et al., 2017) to robustly estimate subject-level dFC and its confidence intervals in a task-based fMRI study (24 subjects who tasted their most frequently consumed beer and Gatorade as an appetitive control). We then combined information across subjects and scans utilizing semiparametric mixed models to obtain a group-level dFC estimate for each pair of brain regions, flavor, and the difference between flavors. The proposed approach relies on the estimated group-level dFC accounting for complex correlation structures of the fMRI data, multiple repeated observations per subject, experimental design, and subject-specific variability. It also provides condition-specific dFC and confidence intervals for the whole brain at the group level. As a summary dFC metric, we used the proportion of time when the estimated associations were either significantly positive or negative. For both flavors, our fully-data driven approach yielded regional associations that reflected known, biologically meaningful brain organization as shown in prior work, as well as closely resembled resting state networks (RSNs). Specifically, beer flavor-potentiated associations were detected between several reward-related regions, including the right ventral striatum (VST), lateral orbitofrontal cortex, and ventral anterior insular cortex (vAIC). The enhancement of right VST-vAIC association by a taste of beer independently validated the main activation-based finding (Oberlin et al., 2016). Most notably, our novel dFC methodology uncovered numerous associations undetected by the traditional static FC analysis. The data-driven, novel dFC methodology presented here can be used for a wide range of task-based fMRI designs to estimate the dFC at multiple levels-group-, individual-, and task-specific, utilizing a combination of well-established statistical methods.

Keywords: addiction; dynamic functional connectivity; functional MRI; gustatory task; semiparametric mixed models; statistical methods.


Figures

Figure 1
Figure 1
fMRI session outline. Each scan was 4:48 min long, and functional imaging, including subjective ratings typically lasted 35–40 min. Gustatory stimuli (beer, Gatorade©) or water were presented every 11 s during each scan; individual trials are indicated by B (beer), G (Gatorade©), and W (water). The design of separate beer and Gatorade scans was the best match to our earlier PET studies (Oberlin et al., 2013, 2015). SR denotes subjective ratings (pleasantness, intensity, etc., see Oberlin et al., for details). The scan order is counterbalanced across subjects (beer or Gatorade scan first).
Figure 2
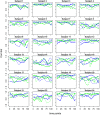
Figure 2
Estimated dynamic functional connectivity associations between the homologous precentral gyri ROIs 34 and 154 from Shen et al. (2013) for beer (blue) and Gatorade (green) scans for each of the study subjects. dFC estimates for each of three beer and Gatorade scans are illustrated by different line styles (solid, dashed, dotted).
Figure 3
Figure 3
Examples of time dependence for six pairwise associations in the dCFM model. Blue, green and red lines and shaded areas represent estimated dFC with pointwise 95% CIs for beer, Gatorade, and Gatorade-beer difference, respectively, with the vertical yellow shading representing flavor delivery periods. Three scenarios where associations during beer scans are positive and enhanced with respect to Gatorade scans (the difference curve is negative), are shown in the top panels. In all three cases, the difference significantly differs from zero at similar scan times (peaking between time points 40 and 50). The temporal characteristics of the dFC during Gatorade scans, however, differ in amplitude and phase (A,B) or have no time points when the associations differ from zero (C). The bottom panels illustrate expected behavior of associations of the right primary sensorimotor cortex (SMC; right precentral gyrus) and three somatomotor network (SMN) regions, indicating no differences between flavors. A homologous, left precentral gyrus area shows an expected, high, nearly constant, positive association for both flavors (D), while a slightly lower positive association is seen to the ipsilateral Rolandic Operculum (RO)/Insula, area “G” of the primary gustatory cortex (E). The ipsilateral Putamen (subcortical part of the SMN) associations are much lower for both flavors, but slowly increase and remain positive (F).
Figure 4
Figure 4
dFC model estimates of all, negative, and positive significant associations for beer (top; A–C) and flavor difference (bottom; D–F), assessed by testing the proportion of time that the confidence intervals around the dFC curve excluded zero. As the null hypothesis for beer associations, the proportion was set to 0.5 and tested against the alternative that proportion is >0.5. Less stringent proportion value of 0.14 was used for flavor difference testing. All results are corrected for multiple comparisons (pFDR < 0.05). Each significant association is depicted as a dot in the lower triangular elements while the diagonal and upper triangular elements illustrate a percentage of significant dFC associations between pairs of regions within each network and between networks, respectively.
Figure 5
Figure 5
sFCM estimates for β0 coefficient representing time-constant associations during beer scans (A). Significant pairwise correlations (pFDR < 0.05; FDR-corrected for multiple comparisons) are shown below the diagonal, while the percentage of significant pairwise ROI associations within- and between- each pair of networks is displayed on and above the diagonal, respectively. None of the sFCM estimates for γ0 coefficient representing beer-Gatorade (γ0 < 0; B) and Gatorade-beer (γ0 > 0; C) associations satisfy the pFDR < 0.05 criterion so these effects are presented at p < 0.05 (two-tailed, uncorrected for multiple comparisons). The color bars with black horizontal lines indicate t-statistic values and appropriate display threshold.
Figure 6
Figure 6
dFCM and sFCM estimates for significant associations between a priori regions of interest (for dFCM: A,B; for sFCM C). Lower triangular elements illustrate associations during the beer scans while upper triangular elements indicate beer-enhanced (i.e., beerGatorade) associations. In the dFC model, non-zero coverage metric for beer was tested for the proportion of 0.5, while the flavor difference was tested for the proportion of 0.14 and 0.1 (A,B, respectively). Similarly, (C) illustrates sFCM model estimates for β0 (beer scan associations; below the diagonal) and γ0 coefficient (beer-enhanced associations; above the diagonal). None of the γ0 estimates reached the significance criterion pFDR < 0.05; FDR-adjusted for multiple comparisons in 248 brain regions). The t-statistic values displayed in the color bar illustrate the magnitude and direction of observed associations. Matrix elements for which associations do not reach the significance criterion are grayed out. Brain region indices from Shen et al. (2013) are in parentheses. L, left; R, right; md, medial; VST, Ventral Striatum; ACC, Anterior Cingulate Cortex; H & B, Head and Body; vAIC, ventral Anterior Insular Cortex; FO, Frontal Operculum; IFG p.T., Inferior Frontal Gyrus (Pars Triangularis); OFC, Orbitofrontal Cortex; SFG, Superior Frontal Gyrus; MFG, Middle Frontal Gyrus; Hippo/Parahi, Hippocampus/Parahippocampal Gyrus.
Figure 7
Figure 7
dFCM curve estimates for six (out of seven) significant flavor-enhanced associations between a priori regions of interest from Figure 6B. The proportion of time points with non-zero coverage (NZC) is shown in the bottom left of each panel. These results illustrate a variety of scenarios that result in a significant non-zero coverage, with the estimated flavor difference curve either positive (B,C), negative (A,D,E), or both positive and negative (F). Brain region indices from Shen et al. (2013) are: 43 = R-vAIC/FO, 54 = R-ACC, 91 = R-dAIC/Insula, 114 = R-VST, 134 = R-rostrolateral OFC, 235 = L-Fusiform Gyrus. L, left; R, right; VST, Ventral Striatum; ACC, Anterior Cingulate Cortex; vAIC/dAIC, ventral/dorsal Anterior Insular Cortex; FO, Frontal Operculum; OFC, Orbitofrontal Cortex; Hippo/Parahi, Hippocampus/Parahippocampal Gyrus.

References

    1. Adali T., Anderson M., Fu G. S. (2014). Diversity in independent component and vector analyses: identifiability, algorithms, and applications in medical imaging. IEEE Signal Process. Mag. 31, 18–33. 10.1109/MSP.2014.2300511 - DOI
    1. Allen E. A., Damaraju E., Plis S. M., Erhardt E. B., Eichele T., Calhoun V. D. (2014). Tracking whole-brain connectivity dynamics in the resting state. Cereb. Cortex 24, 663–676. 10.1093/cercor/bhs352 - DOI - PMC - PubMed
    1. Amico E., Marinazzo D., Di Perri C., Heine L., Annen J., Martial C., et al. . (2017). Mapping the functional connectome traits of levels of consciousness. NeuroImage 148, 201–211. 10.1016/j.neuroimage.2017.01.020 - DOI - PubMed
    1. Bassett D. S., Wymbs N. F., Porter M. A., Mucha P. J., Carlson J. M., Grafton S. T. (2011). Dynamic reconfiguration of human brain networks during learning. Proc. Natl. Acad. Sci. U.S.A. 108, 7641–7646. 10.1073/pnas.1018985108 - DOI - PMC - PubMed
    1. Bassett D. S., Yang M., Wymbs N. F., Grafton S. T. (2015). Learning-induced autonomy of sensorimotor systems. Nat. Neurosci. 18, 744–751. 10.1038/nn.3993 - DOI - PMC - PubMed