

Induction of Neural Crest Stem Cells From Bardet-Biedl Syndrome Patient Derived hiPSCs
- PMID: 31293383
- PMCID: PMC6598745
- DOI: 10.3389/fnmol.2019.00139
Induction of Neural Crest Stem Cells From Bardet-Biedl Syndrome Patient Derived hiPSCs
Abstract
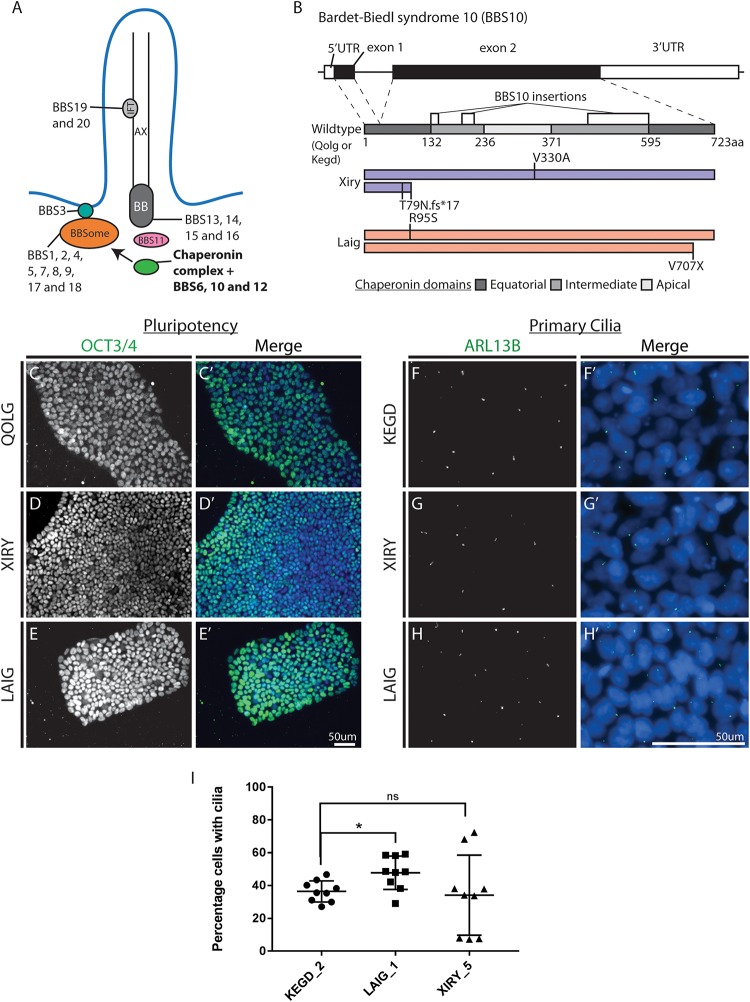
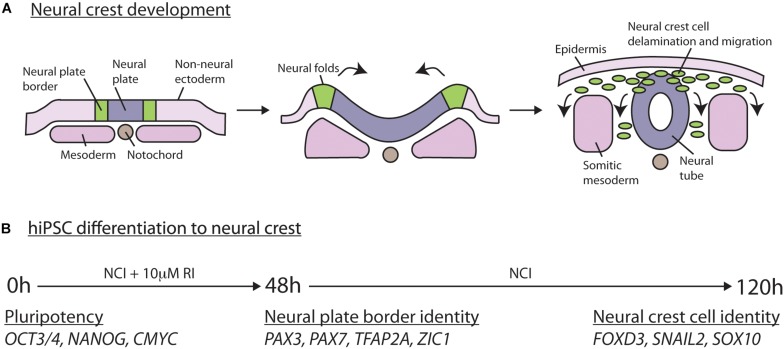
Neural crest cells arise in the embryo from the neural plate border and migrate throughout the body, giving rise to many different tissue types such as bones and cartilage of the face, smooth muscles, neurons, and melanocytes. While studied extensively in animal models, neural crest development and disease have been poorly described in humans due to the challenges in accessing embryonic tissues. In recent years, patient-derived human induced pluripotent stem cells (hiPSCs) have become easier to generate, and several streamlined protocols have enabled robust differentiation of hiPSCs to the neural crest lineage. Thus, a unique opportunity is offered for modeling neurocristopathies using patient specific stem cell lines. In this work, we make use of hiPSCs derived from patients affected by the Bardet-Biedl Syndrome (BBS) ciliopathy. BBS patients often exhibit subclinical craniofacial dysmorphisms that are likely to be associated with the neural crest-derived facial skeleton. We focus on hiPSCs carrying variants in the BBS10 gene, which encodes a protein forming part of a chaperonin-like complex associated with the cilium. Here, we establish a pipeline for profiling hiPSCs during differentiation toward the neural crest stem cell fate. This can be used to characterize the differentiation properties of the neural crest-like cells. Two different BBS10 mutant lines showed a reduction in expression of the characteristic neural crest gene expression profile. Further analysis of both BBS10 mutant lines highlighted the inability of these mutant lines to differentiate toward a neural crest fate, which was also characterized by a decreased WNT and BMP response. Altogether, our study suggests a requirement for wild-type BBS10 in human neural crest development. In the long term, approaches such as the one we describe will allow direct comparison of disease-specific cell lines. This will provide valuable insights into the relationships between genetic background and heterogeneity in cellular models. The possibility of integrating laboratory data with clinical phenotypes will move us toward precision medicine approaches.
Keywords: BBS; Bardet–Biedl Syndrome; hiPSCs; human induced pluripotent stem cells; neural crest.
Figures
Similar articles
-
[Phenotypic plasticity of neural crest-derived melanocytes and Schwann cells].Biol Aujourdhui. 2011;205(1):53-61. doi: 10.1051/jbio/2011008. Epub 2011 Apr 19. Biol Aujourdhui. 2011. PMID: 21501576 Review. French.
-
Modelling renal defects in Bardet-Biedl syndrome patients using human iPS cells.Front Cell Dev Biol. 2023 Jun 2;11:1163825. doi: 10.3389/fcell.2023.1163825. eCollection 2023. Front Cell Dev Biol. 2023. PMID: 37333983 Free PMC article.
-
Modeling Early Neural Crest Development via Induction from hiPSC-Derived Neural Plate Border-like Cells.Methods Mol Biol. 2022;2549:281-298. doi: 10.1007/7651_2021_454. Methods Mol Biol. 2022. PMID: 35355234
-
Generation of induced pluripotent stem cells, KCi002-A derived from a patient with Bardet-Biedl syndrome homozygous for the BBS10 variant c.271insT.Stem Cell Res. 2018 Dec;33:46-50. doi: 10.1016/j.scr.2018.09.013. Epub 2018 Sep 20. Stem Cell Res. 2018. PMID: 30312873
-
Bardet-Biedl syndrome: The pleiotropic role of the chaperonin-like BBS6, 10, and 12 proteins.Am J Med Genet C Semin Med Genet. 2022 Mar;190(1):9-19. doi: 10.1002/ajmg.c.31970. Epub 2022 Apr 4. Am J Med Genet C Semin Med Genet. 2022. PMID: 35373910 Free PMC article. Review.
Cited by
-
Retinal Degeneration Animal Models in Bardet-Biedl Syndrome and Related Ciliopathies.Cold Spring Harb Perspect Med. 2023 Jan 3;13(1):a041303. doi: 10.1101/cshperspect.a041303. Cold Spring Harb Perspect Med. 2023. PMID: 36596648 Free PMC article. Review.
-
Building on a Solid Foundation: Adding Relevance and Reproducibility to Neurological Modeling Using Human Pluripotent Stem Cells.Front Cell Neurosci. 2021 Nov 18;15:767457. doi: 10.3389/fncel.2021.767457. eCollection 2021. Front Cell Neurosci. 2021. PMID: 34867204 Free PMC article.
-
Human iPSC banking: barriers and opportunities.J Biomed Sci. 2019 Oct 28;26(1):87. doi: 10.1186/s12929-019-0578-x. J Biomed Sci. 2019. PMID: 31660969 Free PMC article. Review.
-
Joubert syndrome-derived induced pluripotent stem cells show altered neuronal differentiation in vitro.Cell Tissue Res. 2024 May;396(2):255-267. doi: 10.1007/s00441-024-03876-9. Epub 2024 Mar 19. Cell Tissue Res. 2024. PMID: 38502237 Free PMC article.
-
Genetic insights, disease mechanisms, and biological therapeutics for Waardenburg syndrome.Gene Ther. 2022 Sep;29(9):479-497. doi: 10.1038/s41434-021-00240-2. Epub 2021 Feb 25. Gene Ther. 2022. PMID: 33633356 Review.
References
Grants and funding
LinkOut - more resources
Full Text Sources