

Pin1 Is Regulated by CaMKII Activation in Glutamate-Induced Retinal Neuronal Regulated Necrosis
- PMID: 31293391
- PMCID: PMC6603237
- DOI: 10.3389/fncel.2019.00276
Pin1 Is Regulated by CaMKII Activation in Glutamate-Induced Retinal Neuronal Regulated Necrosis
Abstract
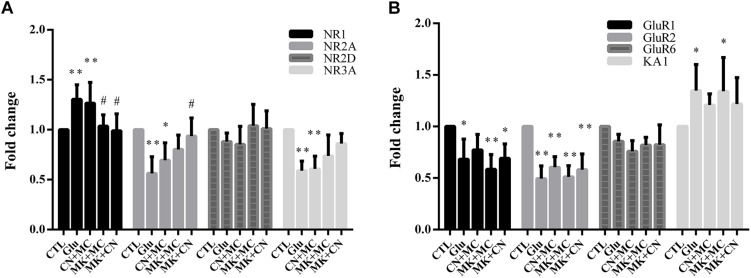
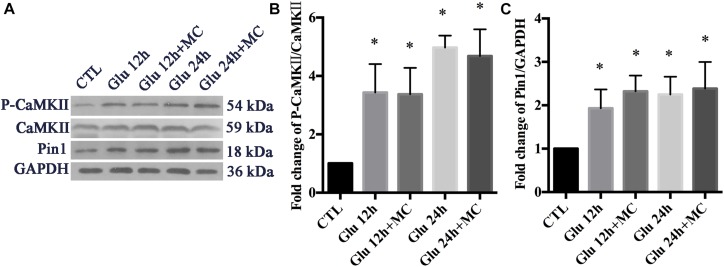
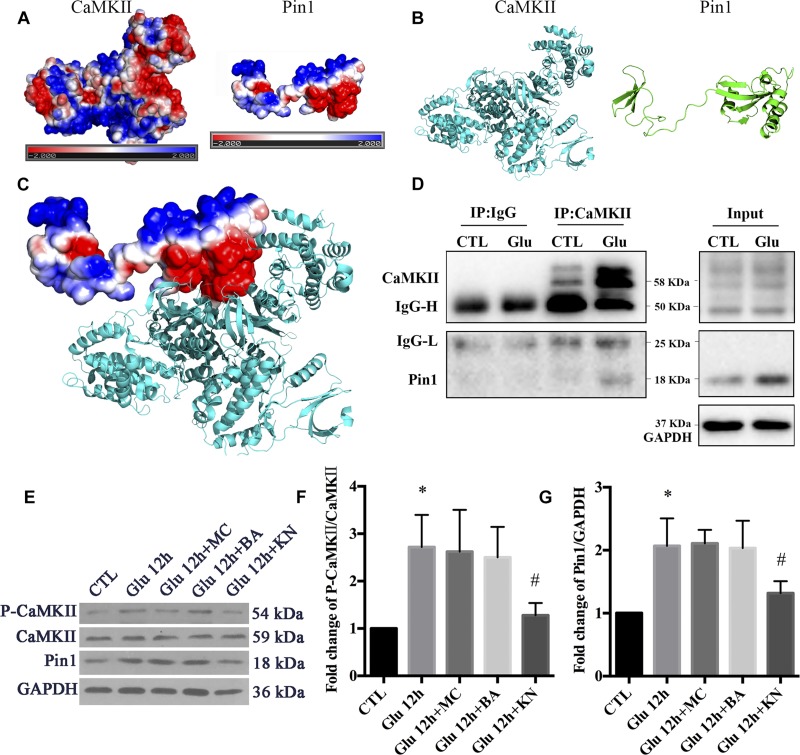
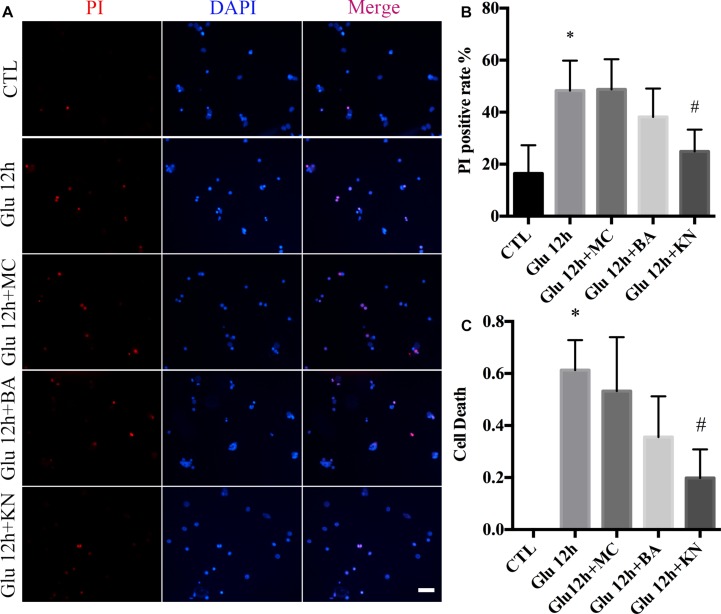
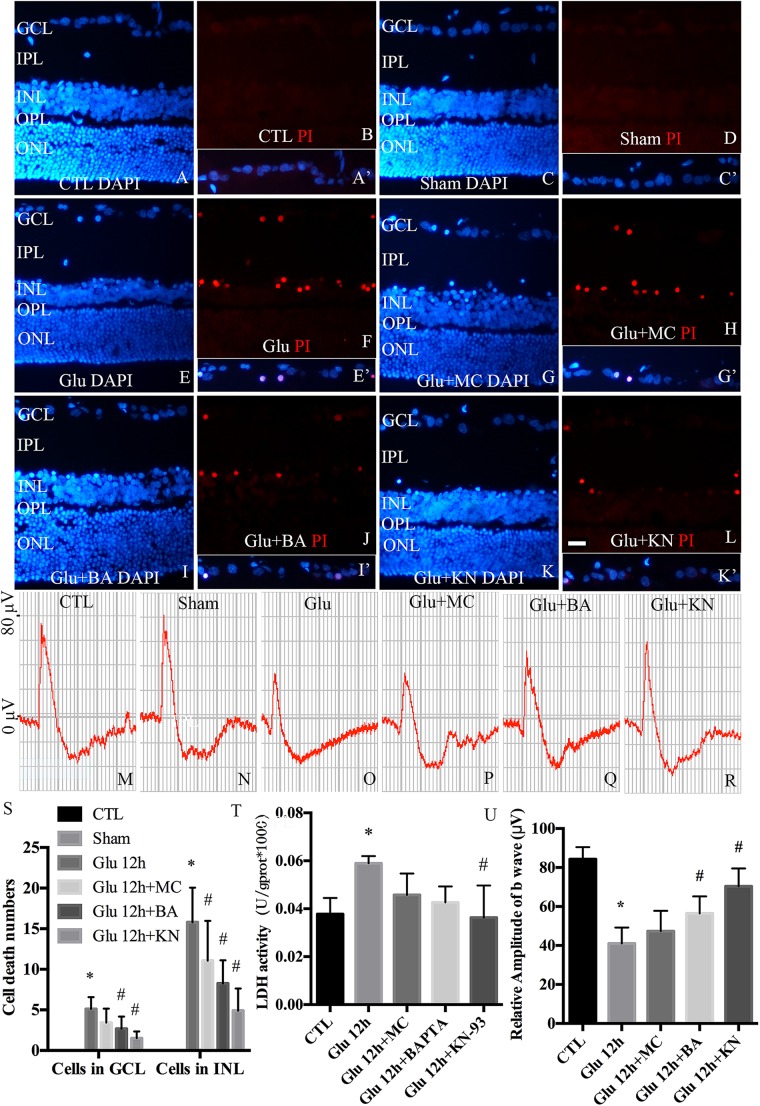
In our previous study, we reported that peptidyl-prolyl isomerase 1 (Pin1)-modulated regulated necrosis (RN) occurred in cultured retinal neurons after glutamate injury. In the current study, we investigated the role of calcium/calmodulin-dependent protein kinase II (CaMKII) in Pin1-modulated RN in cultured rat retinal neurons, and in an animal in vivo model. We first demonstrated that glutamate might lead to calcium overloading mainly through ionotropic glutamate receptors activation. Furthermore, CaMKII activation induced by overloaded calcium leads to Pin1 activation and subsequent RN. Inactivation of CaMKII by KN-93 (KN, i.e., a specific CaMKII inhibitor) application can decrease the glutamate-induced retinal neuronal RN. Finally, by using an animal in vivo model, we also demonstrated the important role of CaMKII in glutamate-induced RN in rat retina. In addition, flash electroretinogram results provided evidence that the impaired visual function induced by glutamate can recover after CaMKII inhibition. In conclusion, CaMKII is an up-regulator of Pin1 and responsible for the RN induced by glutamate. This study provides further understanding of the regulatory pathway of RN and is a complementary mechanism for Pin1 activation mediated necrosis. This finding will provide a potential target to protect neurons from necrosis in neurodegenerative diseases, such as glaucoma, diabetic retinopathy, and even central nervous system diseases.
Keywords: CaMKII; Pin1; calcium; glutamate; regulated necrosis.
Figures


Similar articles
-
Pin1 Promotes Regulated Necrosis Induced by Glutamate in Rat Retinal Neurons via CAST/Calpain2 Pathway.Front Cell Neurosci. 2018 Jan 22;11:425. doi: 10.3389/fncel.2017.00425. eCollection 2017. Front Cell Neurosci. 2018. PMID: 29403356 Free PMC article.
-
Calpain2 but not calpain1 mediated by calpastatin following glutamate-induced regulated necrosis in rat retinal neurons.Ann Anat. 2019 Jan;221:57-67. doi: 10.1016/j.aanat.2018.08.005. Epub 2018 Sep 18. Ann Anat. 2019. PMID: 30240910
-
Prolyl Isomerase Pin1 Directly Regulates Calcium/Calmodulin-Dependent Protein Kinase II Activity in Mouse Brains.Front Pharmacol. 2018 Nov 23;9:1351. doi: 10.3389/fphar.2018.01351. eCollection 2018. Front Pharmacol. 2018. PMID: 30532705 Free PMC article.
-
The role of peptidyl-prolyl isomerase Pin1 in neuronal signaling in epilepsy.Front Mol Neurosci. 2022 Oct 11;15:1006419. doi: 10.3389/fnmol.2022.1006419. eCollection 2022. Front Mol Neurosci. 2022. PMID: 36304997 Free PMC article. Review.
-
The regulatory role of Pin1 in neuronal death.Neural Regen Res. 2023 Jan;18(1):74-80. doi: 10.4103/1673-5374.341043. Neural Regen Res. 2023. PMID: 35799512 Free PMC article. Review.
Cited by
-
RIP3/MLKL-mediated neuronal necroptosis induced by methamphetamine at 39°C.Neural Regen Res. 2020 May;15(5):865-874. doi: 10.4103/1673-5374.268902. Neural Regen Res. 2020. PMID: 31719251 Free PMC article.
-
Role of Ca2+/Calmodulin-Dependent Protein Kinase Type II in Mediating Function and Dysfunction at Glutamatergic Synapses.Front Mol Neurosci. 2022 Jun 20;15:855752. doi: 10.3389/fnmol.2022.855752. eCollection 2022. Front Mol Neurosci. 2022. PMID: 35795689 Free PMC article. Review.
-
The Pin1-CaMKII-AMPA Receptor Axis Regulates Epileptic Susceptibility.Cereb Cortex. 2021 May 10;31(6):3082-3095. doi: 10.1093/cercor/bhab004. Cereb Cortex. 2021. PMID: 33569579 Free PMC article.
-
RSK3 mediates necroptosis by regulating phosphorylation of RIP3 in rat retinal ganglion cells.J Anat. 2020 Jul;237(1):29-47. doi: 10.1111/joa.13185. Epub 2020 Mar 12. J Anat. 2020. PMID: 32162697 Free PMC article.
-
Guidelines for Regulated Cell Death Assays: A Systematic Summary, A Categorical Comparison, A Prospective.Front Cell Dev Biol. 2021 Mar 4;9:634690. doi: 10.3389/fcell.2021.634690. eCollection 2021. Front Cell Dev Biol. 2021. PMID: 33748119 Free PMC article. Review.
References
LinkOut - more resources
Full Text Sources
Miscellaneous