

Neuromuscular Factors Contributing to Reductions in Muscle Force After Repeated, High-Intensity Muscular Efforts
- PMID: 31293449
- PMCID: PMC6601466
- DOI: 10.3389/fphys.2019.00783
Neuromuscular Factors Contributing to Reductions in Muscle Force After Repeated, High-Intensity Muscular Efforts
Abstract
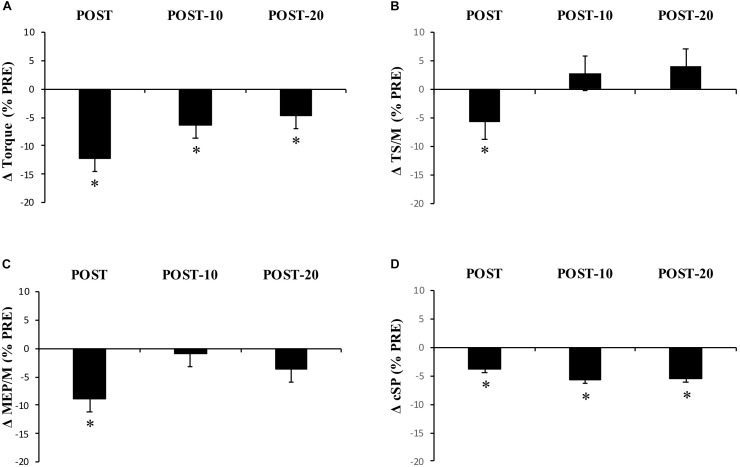
Multiple neuromuscular processes contribute to the loss of force production following repeated, high-intensity muscular efforts; however, the relative contribution of each process is unclear. In Experiment 1, 16 resistance trained men performed six sets of unilateral isometric plantar flexor contractions of the right leg (3 s contraction/2 s rest; 85% maximal voluntary contraction torque; 90-s inter-set rest) until failure with and without caffeine ingestion (3 mg kg-1) on two separate days. Corticospinal excitability and cortical silent period (cSP) were assessed before and immediately, 10 and 20 min after the exercise. In Experiment 2, electrically evoked tetanic force and persistent inward current (PIC)-mediated facilitation of the motor neuron pool (estimated using neuromuscular electrical stimulation with tendon vibration) were assessed before and after the same exercise intervention in 17 resistance trained men. Results showed decreases in peak plantar flexion torque (Experiment 1: -12.2%, Experiment 2: -16.9%), electrically evoked torque (20 Hz -15.3%, 80 Hz -15.3%, variable-frequency train -17.9%), and cSP (-3.8%; i.e., reduced inhibition) post-exercise which did not recover by 20 min. Electromyographic activity (EMG; -6%), corticospinal excitability (-9%), and PIC facilitation (-24.8%) were also reduced post-exercise but recovered by 10 min. Caffeine ingestion increased torque and EMG but did not notably affect corticospinal excitability, PIC amplification, or electrically evoked torque. The data indicate that a decrease in muscle function largely underpins the loss of force after repeated, high-intensity muscular efforts, but that the loss is exacerbated immediately after the exercise by simultaneous decreases in corticospinal excitability and PIC amplitudes at the motor neurons.
Keywords: caffeine; corticospinal excitability; excitation–contraction coupling; neuromuscular fatigue; persistent inward currents.
Figures


Similar articles
-
Reduction and recovery of self-sustained muscle activity after fatiguing plantar flexor contractions.Eur J Appl Physiol. 2024 Jun;124(6):1781-1794. doi: 10.1007/s00421-023-05403-0. Epub 2024 Feb 10. Eur J Appl Physiol. 2024. PMID: 38340155 Free PMC article.
-
The loss of muscle force production after muscle stretching is not accompanied by altered corticospinal excitability.Eur J Appl Physiol. 2019 Oct;119(10):2287-2299. doi: 10.1007/s00421-019-04212-8. Epub 2019 Aug 27. Eur J Appl Physiol. 2019. PMID: 31456049
-
Static stretch and dynamic muscle activity induce acute similar increase in corticospinal excitability.PLoS One. 2020 Mar 19;15(3):e0230388. doi: 10.1371/journal.pone.0230388. eCollection 2020. PLoS One. 2020. PMID: 32191755 Free PMC article. Clinical Trial.
-
Caffeine does not influence persistent inward current contribution to motoneuron firing.J Neurophysiol. 2023 Dec 1;130(6):1529-1540. doi: 10.1152/jn.00350.2023. Epub 2023 Oct 25. J Neurophysiol. 2023. PMID: 37877186
-
How is neuromuscular fatigability affected by perceived fatigue and disability in people with multiple sclerosis?Front Neurol. 2022 Oct 17;13:983643. doi: 10.3389/fneur.2022.983643. eCollection 2022. Front Neurol. 2022. PMID: 36324385 Free PMC article. Review.
Cited by
-
Corticospinal Adaptation to Short-Term Horizontal Balance Perturbation Training.Brain Sci. 2023 Aug 15;13(8):1209. doi: 10.3390/brainsci13081209. Brain Sci. 2023. PMID: 37626565 Free PMC article.
-
Reliability of transcranial magnetic stimulation and H-reflex measurement during balance perturbation tasks.Front Physiol. 2022 Oct 14;13:957650. doi: 10.3389/fphys.2022.957650. eCollection 2022. Front Physiol. 2022. PMID: 36311220 Free PMC article.
-
Impact of isometric and concentric resistance exercise on pain and fatigue in fibromyalgia.Eur J Appl Physiol. 2021 May;121(5):1389-1404. doi: 10.1007/s00421-021-04600-z. Epub 2021 Feb 22. Eur J Appl Physiol. 2021. PMID: 33616753 Free PMC article.
-
Using Field Based Data to Model Sprint Track Cycling Performance.Sports Med Open. 2021 Mar 16;7(1):20. doi: 10.1186/s40798-021-00310-0. Sports Med Open. 2021. PMID: 33725208 Free PMC article. Review.
-
Reduction and recovery of self-sustained muscle activity after fatiguing plantar flexor contractions.Eur J Appl Physiol. 2024 Jun;124(6):1781-1794. doi: 10.1007/s00421-023-05403-0. Epub 2024 Feb 10. Eur J Appl Physiol. 2024. PMID: 38340155 Free PMC article.
References
-
- Abbate F., Bruton J., De Haan A., Westerblad H. (2002). Prolonged force increase following a high-frequency burst is not due to a sustained elevation of [Ca2+] i. Am. J. Physiol. Cell Physiol. 283 C42–C47. - PubMed
LinkOut - more resources
Full Text Sources