. 2019 Jun 21:10:1409.
doi: 10.3389/fmicb.2019.01409. eCollection 2019.

Not Just a Pathogen? Description of a Plant-Beneficial Pseudomonas syringae Strain

Affiliations

Not Just a Pathogen? Description of a Plant-Beneficial Pseudomonas syringae Strain

Alessandro Passera et al. Front Microbiol. .

Abstract

Plants develop in a microbe-rich environment and must interact with a plethora of microorganisms, both pathogenic and beneficial. Indeed, such is the case of Pseudomonas, and its model organisms P. fluorescens and P. syringae, a bacterial genus that has received particular attention because of its beneficial effect on plants and its pathogenic strains. The present study aims to compare plant-beneficial and pathogenic strains belonging to the P. syringae species to get new insights into the distinction between the two types of plant-microbe interactions. In assays carried out under greenhouse conditions, P. syringae pv. syringae strain 260-02 was shown to promote plant-growth and to exert biocontrol of P. syringae pv. tomato strain DC3000, against the Botrytis cinerea fungus and the Cymbidium Ringspot Virus. This P. syringae strain also had a distinct volatile emission profile, as well as a different plant-colonization pattern, visualized by confocal microscopy and gfp labeled strains, compared to strain DC3000. Despite the different behavior, the P. syringae strain 260-02 showed great similarity to pathogenic strains at a genomic level. However, genome analyses highlighted a few differences that form the basis for the following hypotheses regarding strain 260-02. P. syringae strain 260-02: (i) possesses non-functional virulence genes, like the mangotoxin-producing operon Mbo; (ii) has different regulation pathways, suggested by the difference in the autoinducer system and the lack of a virulence activator gene; (iii) has genes encoding DNA methylases different from those found in other P. syringae strains, suggested by the presence of horizontal-gene-transfer-obtained methylases that could affect gene expression.

Keywords: Botrytis cinerea; Pseudomonas syringae; biocontrol; confocal microscopy; pangenome analysis.


Figures
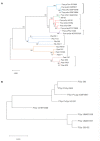
FIGURE 1
FIGURE 1
Phylogenetic positions of strain 260-02 in relation to other P. syringae strains. Organisms included in the analysis are reported as follows: Psyr for Pseudomonas syringae; Psav for Pseudomonas savastanoi; Pflu for Pseudomonas fluorescens; Paer for Pseudomonas aeruginosa; Pput for Pseudomonas putida. Furthermore, for P. syringae and P. savastanoi, pathovars are defined as follows: pvTom for pathovar tomato; pvSyr for pathovar syringae; pvAct for pathovar actinidiae; pvLap for pathovar lapsa; pvPha for pathovar phaseolicola; pvSav for pathovar savastanoi (A) Unrooted phylogenetic tree inferred from the gyrB/rpoD concatenated nucleotide sequence of strain 260-02 and the sequences obtained from GenBank (Supplementary Table S1); minimum evolution method was carried out using the Jukes-Cantor model and bootstrap replicated 1,000 times. Names of strains are reported on the panel (B) Unrooted phylogenetic tree inferred from the predicted protein sequences coded by the mboE gene of strain 260-02 and the sequences obtained from GenBank (Supplementary Table S1); The evolutionary history was inferred using the Minimum Evolution method. The tree is drawn to scale, with branch lengths in the same units as those of the evolutionary distances used to infer the phylogenetic tree. The evolutionary distances were computed using the Poisson correction method and are in the units of the number of amino acid substitutions per site. The tree was bootstrap replicated 1,000 times.
FIGURE 2
FIGURE 2
Results of the in vitro assays. Graph reporting on the Y axis the percentage of inhibition of Botrytis cinerea growth observed in panel (A) the dual-culture assay (GIP), (B) the dual-plate assay, measuring the effect of volatiles alone (GIPv), and (C) on plates containing cultural filtrate (GIPf) values registered in the competition assays against B. cinerea MG53 using the strains 260-02 and DC3000. The bars represent the mean value of 3 independent measures taken on 3 biological replicates of the experiment. Statistically different results according to Student’s T-test are reported with asterisks (*p < 0.05; ∗∗p < 0.01; ∗∗∗p ≤ 0.001) (D) Principal component analysis describing 78.8% of the difference between the volatile molecules found in the sterile medium (TGYA), those produced by BC, by strain DC3000, by strain 260-02 alone, and by strain 260-02 cultured together with BC (260-02+BC).
FIGURE 3
FIGURE 3
Results of the in vivo assays. (A) Graph reporting the percentage infection index (I%I) observed on tomatoes inoculated with BC alone (NT), or previously treated with either strain 260-02 or strain DC3000. The bars indicate the mean I%I value observed on three replicates of the experiment, each carried out on 10 fruits. Different letters (a,b) indicate significantly different results according to One-Way ANOVA test, followed by Tukey’s Exact post hoc (p < 0.05). On the right side, pictures of three representative tomatoes that were (B) non-treated, (C) treated with strain 260-02, and (D) treated with strain DC3000.
FIGURE 4
FIGURE 4
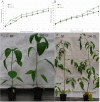
Results of the in planta PGP assay. Graphs reporting the average height of the plants, 7 replicates per treatment, either non-treated (NT), or treated by root dipping with strain 260-02, for panel (A) pepper plants and for panel (B) tomato plants. The vertical axis reports the height in centimeters of the plants, while the horizontal axis reports the weeks from the treatment with the strain. The asterisks (∗∗∗) indicate that for both experiments, the progression of height throughout the 8 weeks found to be statistically different (p < 0.001) according to a general linearized model test, optimized for repeated measures. On the lower side, pictures showing the non-treated and 260-02-treated plants of panel (C) pepper and panel (D) tomato one month after treatment.
FIGURE 5
FIGURE 5
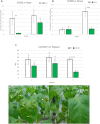
Results of the in planta biocontrol assays. Green bars indicate the plants that were treated with strain 260-02 by root dipping 2 weeks (for biocontrol against DC3000) or one month (for biocontrol against Cymbidium Ringspot Virus) before being challenged with the pathogen, while white bars indicate non-treated control plants. For each combination of treatment, pathogen, and host, 7 biological replicates were used. (A) graph reporting the number of lesions developed by P. syringae strain DC3000 on pepper plants; (B) graph reporting the number of lesions developed by P. syringae strain DC3000 on tomato plants. The vertical axis shows the average number of lesions per plant, on the horizontal axis are divided the observations 1 and 2 weeks after inoculation with the pathogen. Statistically different results according to the Student’s T-test are reported with asterisks (*p < 0.05; ∗∗p < 0.01; ∗∗∗p ≤ 0.001). (C) graph reporting the percentage infection index (I%I) registered on pepper plants inoculated with Cymbidium Ringspot Virus (CymRSV). Statistically different results according to Student’s T-test are reported with asterisks (*p < 0.05; ∗∗p < 0.01; ∗∗∗p ≤ 0.001). (D) Pictures of representative plants that were inoculated with CymRSV: typical symptoms of the disease can be seen on the leaves of the non-treated plant, with evident circular necrotic spots; the plants also inoculated with strain 260-02 show fewer or, as reported in the picture, no symptoms on newer leaves.
FIGURE 6
FIGURE 6
Confocal microscopy on pepper roots, 3 days after inoculation with bacterial strains. The panel shows representative pictures from the microscopy observations. In green is the fluorescence obtained by exciting with a wavelength of 488 nm, which produces fluorescence from the GFP used to tag the bacterial strains, in red that obtained by exciting with a wavelength of 594 nm, which produces autofluorescence from phenolic compounds and allows to visualize plant material, in particular cell walls. Yellow color is given by overlap of red and green fluorescence. White arrows indicate examples of GFP fluorescence on the root surface. Panels (A,C,E) are taken from plants inoculated with strain 260-02:gfp; panels (B,D,F–H) are taken from plants inoculated with strain DC3000::gfp. Panels (A,B) portray zones of emergence of secondary roots; panels (C,D,G) portray primary roots; panels (E,F,H) portray secondary roots. In each picture, the scale bar reported in the lower right corner corresponds to 20 μm.
FIGURE 7
FIGURE 7
Confocal microscopy on the abaxial surface of pepper leaves at 3 dpi. The panel shows representative pictures from the microscopy observations. In green is the fluorescence obtained by exciting with a wavelength of 488 nm, which produces fluorescence from the GFP used to tag the bacterial strains, in red that obtained by exciting with a wavelength of 594 nm, which produces autofluorescence from chlorophyll and visualizes the position of chloroplasts. Yellow color is given by overlap of red and green fluorescence. Panel (A) is from leaves experimentally inoculated with a suspension of strain 260-02:gfp cells; panel (B) is from leaves experimentally inoculated with a suspension of strain DC3000::gfp cells taken from plants without any root treatment; panel (C) is from leaves experimentally inoculated with a suspension of strain DC3000::gfp cells taken from plants treated at the root with strain 260-02; panel (D) is from leaves experimentally inoculated with a suspension of strain DC3000::gfp cells taken from plants treated at the root with strain DC3000. White arrows point to stomata being colonized by bacterial cells, visible as green outlines of the guard cells and the stoma aperture; yellow arrows point to non-colonized stomata, visible as oval patterns in chloroplast position with a dark area in the middle. In each picture, the scale bar reported in the lower right corner represents 20 μm.
FIGURE 8
FIGURE 8
Confocal microscopy on the adaxial surface of pepper leaves at 3 dpi. The panel shows representative pictures from the microscopy observations. In green is the fluorescence obtained by exciting with a wavelength of 488 nm, which produces fluorescence from the GFP used to tag the bacterial strains, in red that obtained by exciting with a wavelength of 594 nm, which produces autofluorescence from chlorophyll and visualizes the position of chloroplasts. Yellow color is given by overlap of red and green fluorescence. Panel (A) is from leaves experimentally inoculated with a suspension of strain 260-02:gfp cells; panel (B) is from leaves experimentally inoculated with a suspension of strain DC3000::gfp cells taken from plants without any root treatment; panel (C) is from leaves experimentally inoculated with a suspension of strain DC3000::gfp cells taken from plants treated at the root with strain 260-02; panel (D) is from leaves experimentally inoculated with a suspension of strain DC3000::gfp cells taken from plants treated at the root with strain DC3000. In each picture, the scale bar reported in the lower right corner represents 20 μm.
FIGURE 9
FIGURE 9
Charts reporting the results of the quantitative analyses of confocal microscopy pictures taken from the abaxial surface of leaves infected by DC3000::gfp (Figure 7) either with PBS root treatment (DC3000/Control, in white), with 260-02 root treatment (DC3000/260-02, in light gray), or with DC3000 root treatment (DC3000/DC3000, in dark gray). On the vertical axis is the amount of leaf surface, expressed as a base 10 logarithm of μm2, on which GFP fluorescence from the bacteria was visible. Error bars indicate standard deviation. Bars represent the average value obtained by analyzing 7 images per treatment. Letters (a,b) indicate significantly different results according to One-Way ANOVA test, followed by Tukey’s Exact post hoc (p < 0.05). Graphs (A,B) indicate results obtained in pepper plants at 3 and 6 dpi, respectively. Graphs (C,D) indicate results obtained in tomato plants at 3 and 6 dpi, respectively.

References

    1. Antunes L. C. M., Ferreira R. B. R. (2009). Intercellular communication in bacteria. Crit. Rev. Microbiol. 3 69–80. - PubMed
    1. Arrebola E., Cazorla F. M., Codina J. C., Gutierrez-Barranquero J. A., Perez-Garcia A., de Vicente A. (2009). Contribution of mangotoxin to the virulence and epiphytic fitness of Pseudomonas syringae pv. syringae. Int. Microbiol. 12 87–95. - PubMed
    1. Baltrus D. A., McCann H. C., Guttman D. S. (2017). Evolution, genomics and epidemiology of Pseudomonas syringae. Mol. Plant Pathol. 18 152–168. 10.1111/mpp.12506 - DOI - PMC - PubMed
    1. Bankevich A., Nurk S., Antipov D., Gurevich A. A., Dvorkin M., Kulikov A. S., et al. (2012). SPAdes: a new genome assembly algorithm and its applications to single-cell sequencing. J. Comp. Biol. 19 455–477. 10.1089/cmb.2012.0021 - DOI - PMC - PubMed
    1. Ba-Thein E., Lyristis M., Ohtani L., Nisbet I. T., Hayashi H., Rood I. J., et al. (1996). The virR/virS locus regulates the transcription of genes encoding extracellular toxin production in Clostridium perfringens. J. Bacteriol. 178 2514–2520. - PMC - PubMed