. 2019 Jun 13:6:1480-1488.
doi: 10.1016/j.mex.2019.06.008. eCollection 2019.

Easy calibration of the Light Plate Apparatus for optogenetic experiments

Affiliations

Easy calibration of the Light Plate Apparatus for optogenetic experiments

Kieran Sweeney et al. MethodsX. .

Abstract

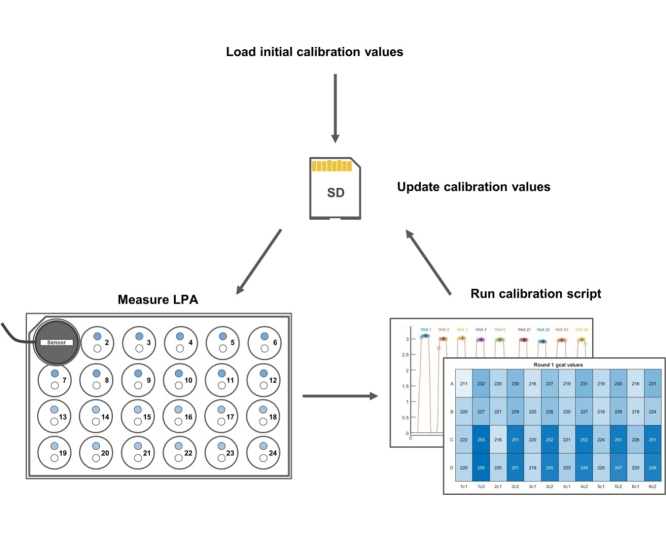
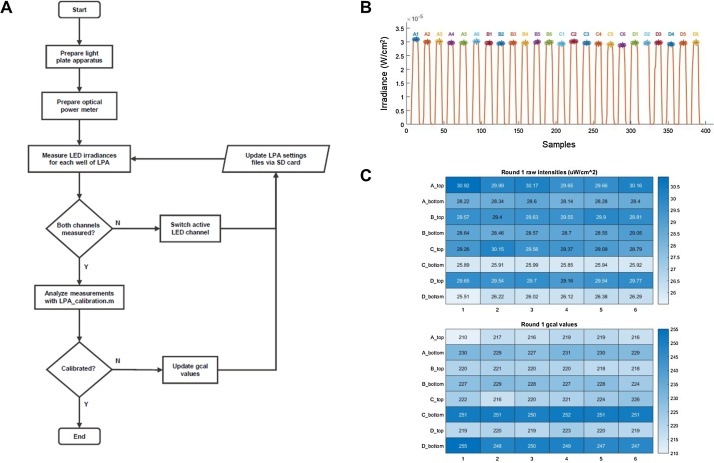
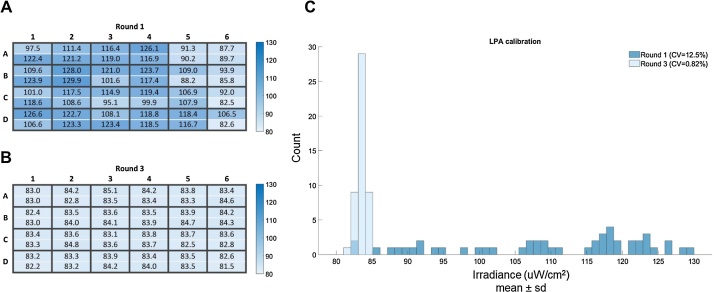
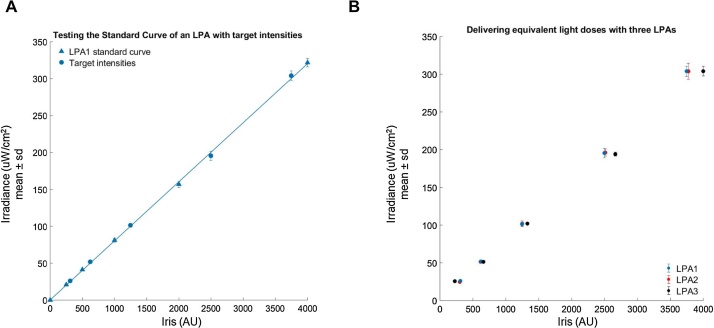
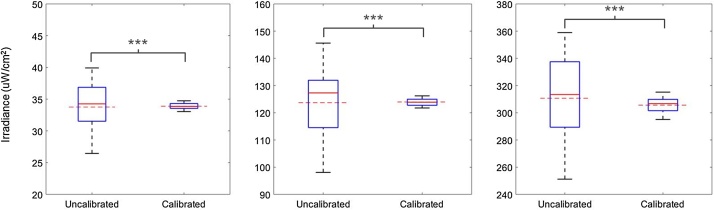
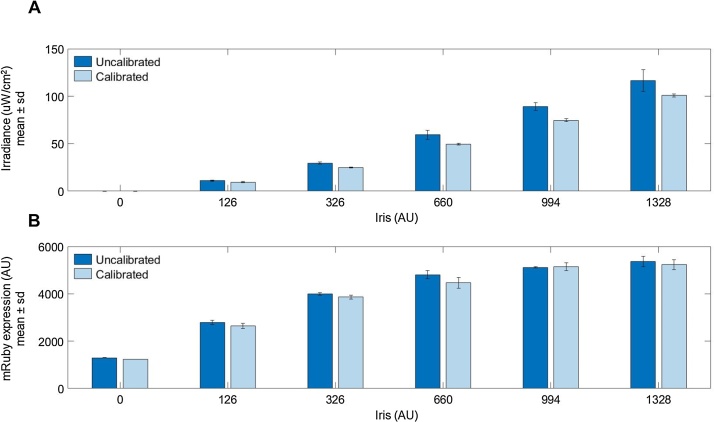
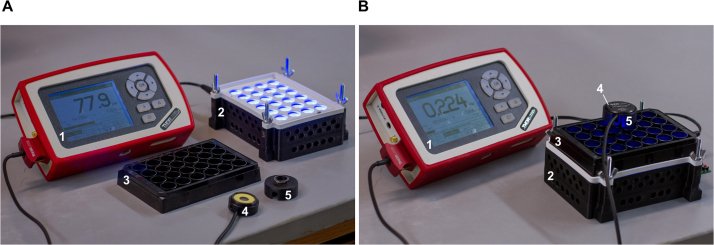
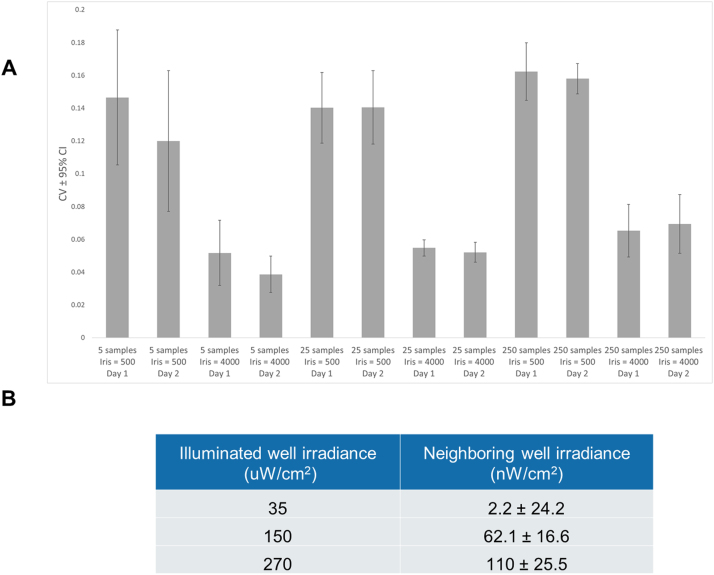
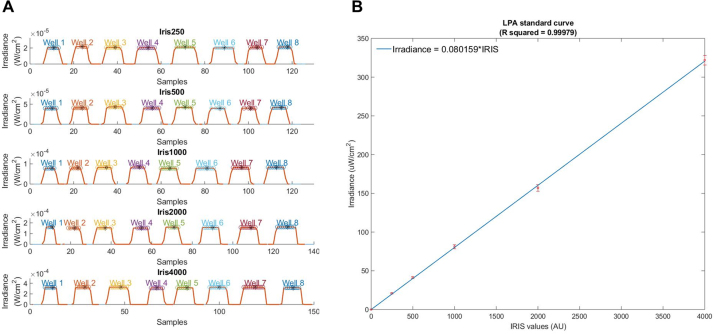
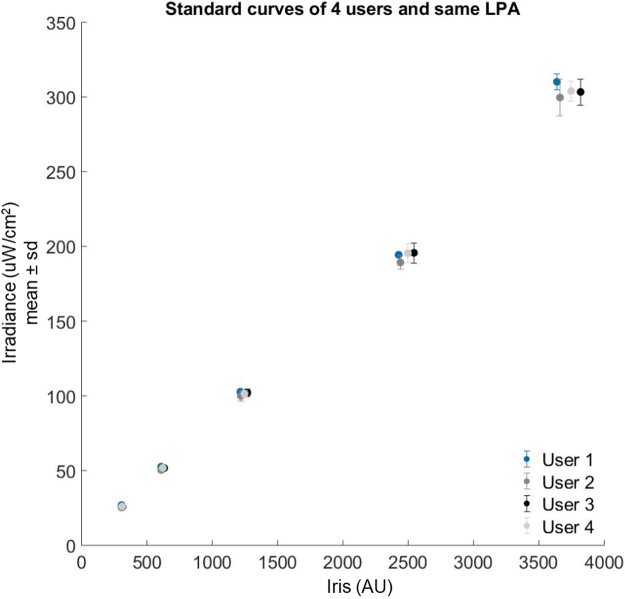
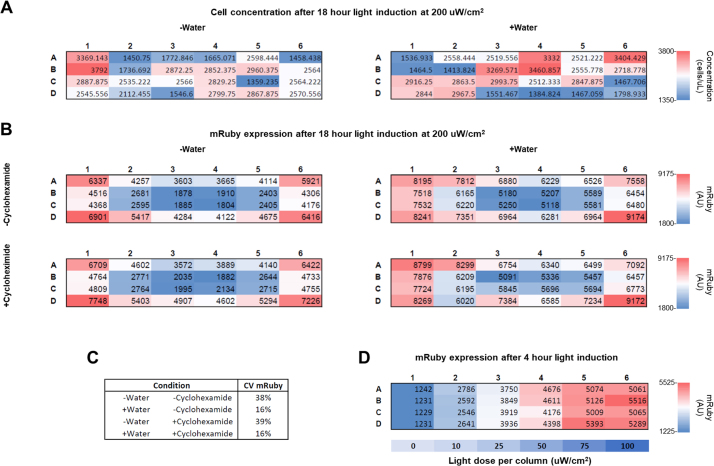
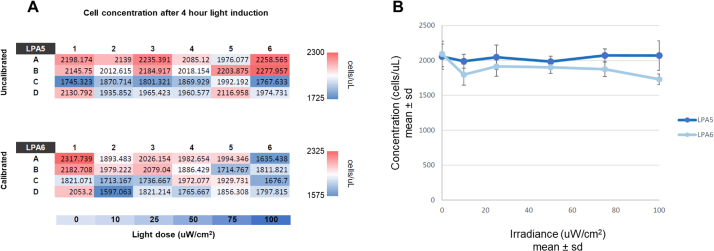
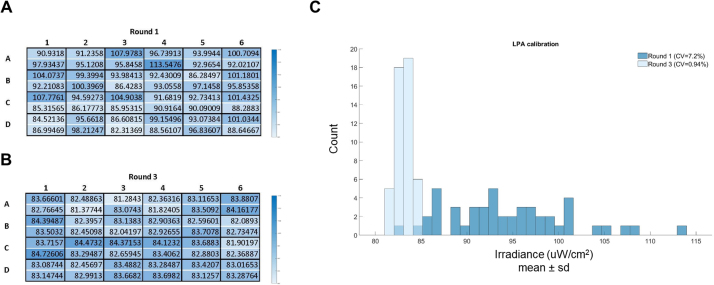
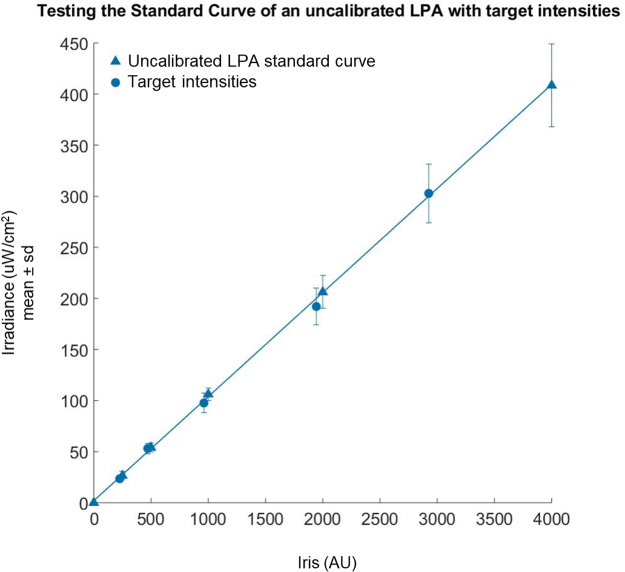
Optogenetic systems use genetically-encoded light-sensitive proteins to control and study cellular processes. As the number and quality of these systems grows, there is an increasing need for user-friendly and flexible hardware to provide programmed illumination to cultures of cells. One platform which satisfies this need for a variety of optogenetic systems and organisms is the Light Plate Apparatus (LPA), which delivers a controlled light dose to each well of a 24-well plate. Experimental reproducibility requires appropriate calibration to produce accurate light doses within individual wells of the LPA and between LPAs. In this study, we present an easy and accurate method for calibrating the LPA. In particular, we: •developed a 3D printed adaptor and MATLAB code to allow rapid measurement of irradiance produced by the LPA and subsequent calibration•provide appropriate code and methodology for generating a standard curve for each LPA•demonstrate the utility and accuracy of this method between users and LPAs.

Keywords: Calibration; Easy calibration of the Light Plate Apparatus for optogenetic experiments; Light Plate Apparatus; Microbes; Optical power meter; Optogenetics; Saccharomyces cerevisiae.


Figures

None
Graphical abstract
Fig. 1
Fig. 1
Calibration process for an LPA fitted with two blue LEDs per well. (A) A flow chart detailing the steps of the calibration process. (B) Representative image of well irradiance measurements acquired in series as identified by “LPA_calibration.m”. Well identifiers (e.g.A1”) are indicated. Each well was covered by on average 5 samples. We sampled at a rate of 1 Hz so there is 1 second between each sample. The entire plate was measured in less than 400 s. (C) Representative well irradiance measurements and tuned gcal values per LED as calculated by “LPA_calibration.m”.
Fig. 2
Fig. 2
Representative results of an LPA calibration. Each well has two blue LEDs. (A) Heatmap of the irradiance measurements for each LED prior to round one of calibration showing the uneven distributions of LED irradiances in an uncalibrated LPA. The CV of the LED irradiances is 12.5% before calibration. (B) Heatmap of the irradiance measurements for each LED on the same LPA after three rounds of calibration. The CV of the LED irradiances is 0.82% after calibration (C). Histogram depicting the data represented in the heatmaps of this figure. The values across the calibrated LPA have converged to the dimmest LED.
Fig. 3
Fig. 3
A standard curve and measurements relating Iris values to irradiance. All plot markers represent the mean and standard deviation of a set of eight measurements. (A) A standard curve generated from a set of measurements across the programmable range of Iris values (triangular markers). Predicted Iris values for specific target irradiances were then programmed and the actual irradiance measured (circular markers). (B) Target irradiances for three different LPAs are shown (circular markers). The measurements between LPAs at the target irradiances all cluster closely and are within 3% of their respective targets.
Fig. 4
Fig. 4
Irradiance measurements from an LPA before and after calibration. We set all the LEDs of an uncalibrated LPA to a constant Iris value and measured the irradiance of each well. We then calibrated the LPA and assigned all wells a constant Iris value such that the mean irradiance output by the calibrated LPA approximately matched that of the uncalibrated LPA (Fig. 4A) and measured the irradiance of each well. We did this at three light doses and each time observed significantly reduced irradiance variability (asterisks indicate p < 0.001 as calculated by Levene’s test for equality of variances). The dashed red lines depict the average irradiance across the whole LPA for each condition.
Fig. 5
Fig. 5
Light-induced mRuby expression in yeast grown on a calibrated and uncalibrated LPA set to deliver a range of light doses. Each bar represents the mean of four replicates. The Iris values listed denote the Iris value used for both the top and bottom LED of each well for each plate column. (A) Mean irradiance for each column of the uncalibrated and calibrated LPA plates. Irradiance is consistently higher and more variable for the uncalibrated LPA (B) Reporter gene expression is consistently higher on the uncalibrated LPA.
None
None
None
None
None
None
None
None

References

    1. Kolar K., Weber W. Synthetic biological approaches to optogenetically control cell signaling. Curr. Opin. Biotechnol. 2017;47:112–119. - PubMed
    1. Kolar K., Knobloch C., Stork H., Žnidarič M., Weber W. OptoBase: a web platform for molecular optogenetics. ACS Synth. Biol. 2018;7:1825–1828. - PubMed
    1. Bugaj L.J., O’Donoghue G.P., Lim W.A. Interrogating cellular perception and decision making with optogenetic tools. J. Cell Biol. 2017;216:25–28. - PMC - PubMed
    1. Gerhardt K.P., Olson E.J., Castillo-Hair S.M., Hartsough L.A., Landry B.P., Ekness F., Yokoo R., Gomez E.J., Ramakrishnan P., Suh J., Savage D.F., Tabor J.J. An open-hardware platform for optogenetics and photobiology. Sci. Rep. 2016;6:1–13. - PMC - PubMed
    1. 2016. Iris.taborlab.github.io/Iris/