. 2019 Jun 25:9:217.
doi: 10.3389/fcimb.2019.00217. eCollection 2019.

Sequential Changes in the Host Gut Microbiota During Infection With the Intestinal Parasitic Nematode Strongyloides venezuelensis

Affiliations

Sequential Changes in the Host Gut Microbiota During Infection With the Intestinal Parasitic Nematode Strongyloides venezuelensis

Tanzila Afrin et al. Front Cell Infect Microbiol. .

Abstract

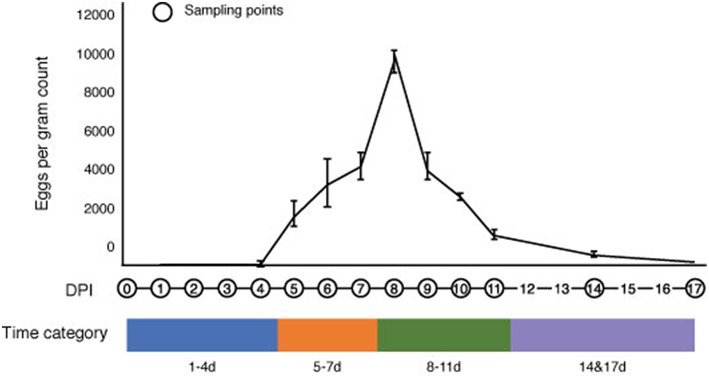
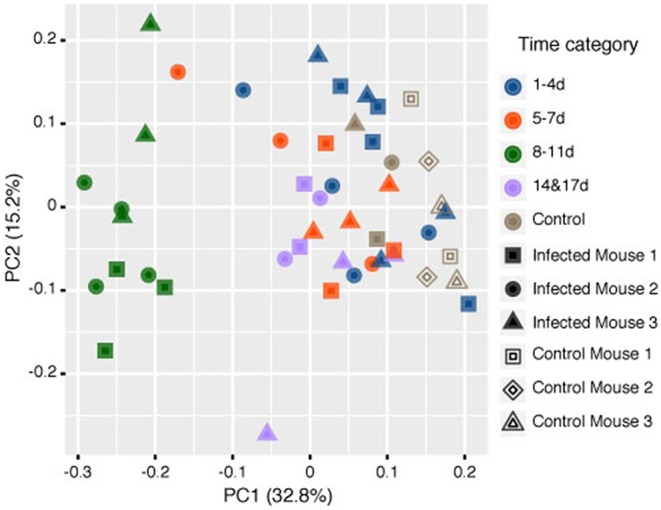
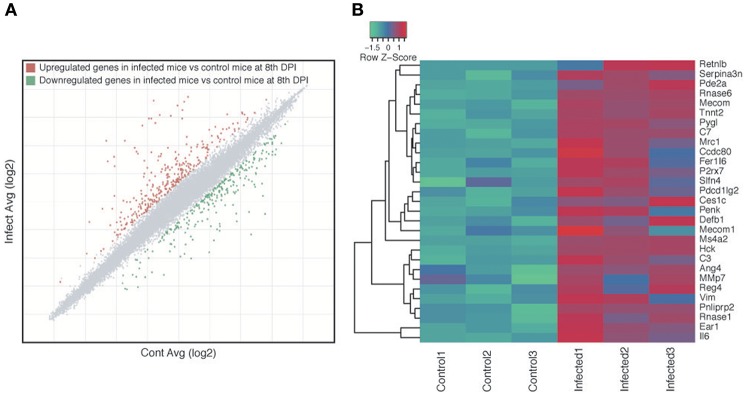
Soil-transmitted helminths (STHs) are medically important parasites that infect 1. 5 billion humans globally, causing a substantial disease burden. These parasites infect the gastrointestinal tract (GIT) of their host where they co-exist and interact with the host gut bacterial flora, leading to the coevolution of the parasites, microbiota, and host organisms. However, little is known about how these interactions change through time with the progression of infection. Strongyloidiasis is a human parasitic disease caused by the nematode Strongyloides stercoralis infecting 30-100 million people. In this study, we used a closely related rodent parasite Strongyloides venezuelensis and mice as a model of gastrointestinal parasite infection. We conducted a time-course experiment to examine changes in the fecal microbiota from the start of infection to parasite clearance. We found that bacterial taxa in the host intestinal microbiota changed significantly as the infection progressed, with an increase in the genera Bacteroides and Candidatus Arthromitus, and a decrease in Prevotella and Rikenellaceae. However, the microbiota recovered to the pre-infective state after parasite clearance from the host, suggesting that these perturbations are reversible. Microarray analysis revealed that this microbiota transition is likely to correspond with the host immune response. These findings give us an insight into the dynamics of parasite-microbiota interactions in the host gut during parasite infection.

Keywords: Candidatus Arthromitus; Strongyloides; host–parasite interaction; immune reaction; microbiome.


Figures

Figure 1
Figure 1
Changes in the number of Strongyloides venezuelensis eggs per gram of feces during the progression of infection. S. venezuelensis eggs were first detected at 5 days post-infection (DPI), with peak numbers being observed at 8 DPI. The infection period was divided into four categories: 1–4 DPI (blue), 5–7 DPI (orange), 8–11 DPI (green) and 14 and 17 DPI (purple).
Figure 2
Figure 2
Alpha diversity of reads retrieved from the mouse fecal samples. (A) Rarefaction curves based on the Chao1 richness estimator calculated using the observed operational taxonomic units (OTUs). The total OTUs were generated using a 97% similarity threshold. (B) Box plot showing Chao1 values of bacteria in different time categories at the OTU level. (C) Box plot showing Chao1 values of bacteria in different time categories at the species level. Chao1 values were calculated using rarefied reads (50,000 reads per sample) from 0 to 17 days post-infection (DPI), as well as for the naïve control mice.
Figure 3
Figure 3
Impact of Strongyloides venezuelensis infection on the gut bacterial community composition. (A) Relative abundance of the fecal microbiota at the genus level in infected mice. The taxonomic composition and relative abundance of bacterial genera in the fecal samples with the progression of S. venezuelensis infection are shown. Taxa with relative abundances of <1% are included in “Others.” (B) Heatmap of the operational taxonomic unit (OTU) abundance in individual mice demonstrating large-scale community shifts at 5–7 and 8–11 days post-infection (DPI). Each column represents an individual sample from the control or infected mice during infection, while each row represents a genus-level OTU Values were normalized by row.
Figure 4
Figure 4
Relative abundances of the operational taxonomic units (OTUs) that significantly changed during the infection period. Six genera were found to have significantly changed in abundance at 8–11 days post-infection (DPI) relative to the control: Bacteroides (Bacteroidetes), Prevotella (Bacteroidetes), S24-7 (Bacteroidetes), an unclassified genus derived from Rikenellaceae (Bacteroidetes), Prevotellaceae (Bacteroidetes), and Candidatus Arthromitus (Firmicutes). Solid and break lines represent the naïve control mice (n = 3) and the infected mice (n = 3), respectively.
Figure 5
Figure 5
Principle coordinate analysis (PCoA) of the rarefied operational taxonomic units (OTUs) comparing the microbiome contents of mice infected with Strongyloides venezuelensis from 0 to 17 days post-infection (DPI) and naïve control mice based on the Bray-Curtis dissimilarity distances Analysis of similarities (ANOSIM) tests showed that the samples at 8–11 DPI were significantly different from the samples in the other time categories and the control groups (p = 0.001).
Figure 6
Figure 6
Host gene expression changes as a result of Strongyloides venezuelensis infection. (A) Scatter plot highlighting the genes that were differentially expressed between infected and naïve control mice at 8 days post-infection (DPI). Each dot represents a gene, with gray, red, and green dots indicating non-differentially expressed, upregulated and downregulated genes, respectively, in the infected mice relative to the control mice. (B) Heat map of all 29 genes with the Gene Ontology (GO) term “responded to the bacteria” (GO:0009617).

References

    1. Afrin T., Kounosu A., Billah M.-M., Murase K., Kikuchi T. (2018). Evaluation of magnetic cellulose bead-based DNA extraction from faecal materials for high-throughput bacterial community analyses. Appl. Entomol. Zool. 53, 281–286. 10.1007/s13355-018-0551-2 - DOI
    1. Artis D., Grencis R. K. (2008). The intestinal epithelium: sensors to effectors in nematode infection. Mucosal Immunol. 1, 252–264. 10.1038/mi.2008.21 - DOI - PubMed
    1. Caporaso J. G., Kuczynski J., Stombaugh J., Bittinger K., Bushman F. D., Costello E. K., et al. (2010). QIIME allows analysis of high-throughput community sequencing data. Nat. Methods 7, 335–336. 10.1038/nmeth.f.303 - DOI - PMC - PubMed
    1. Caporaso J. G., Lauber C. L., Walters W. A., Berg-Lyons D., Huntley J., Fierer N., et al. (2012). Ultra-high-throughput microbial community analysis on the Illumina HiSeq and MiSeq platforms. ISME J. 6, 1621–1624. 10.1038/ismej.2012.8 - DOI - PMC - PubMed
    1. Cattadori I. M., Sebastian A., Hao H., Katani R., Albert I., Eilertson K. E., et al. (2016). Impact of helminth infections and nutritional constraints on the small intestine microbiota. PLoS ONE 11:e0159770. 10.1371/journal.pone.0159770 - DOI - PMC - PubMed

Publication types

MeSH terms

Substances

LinkOut - more resources