

Caseload and Case Fatality of Lassa Fever in Nigeria, 2001-2018: A Specialist Center's Experience and Its Implications
- PMID: 31294014
- PMCID: PMC6603170
- DOI: 10.3389/fpubh.2019.00170
Caseload and Case Fatality of Lassa Fever in Nigeria, 2001-2018: A Specialist Center's Experience and Its Implications
Erratum in
-
Corrigendum: Caseload and Case Fatality of Lassa Fever in Nigeria, 2001-2018: A Specialist Center's Experience and Its Implications.Front Public Health. 2019 Sep 13;7:251. doi: 10.3389/fpubh.2019.00251. eCollection 2019. Front Public Health. 2019. PMID: 31544101 Free PMC article.
Abstract
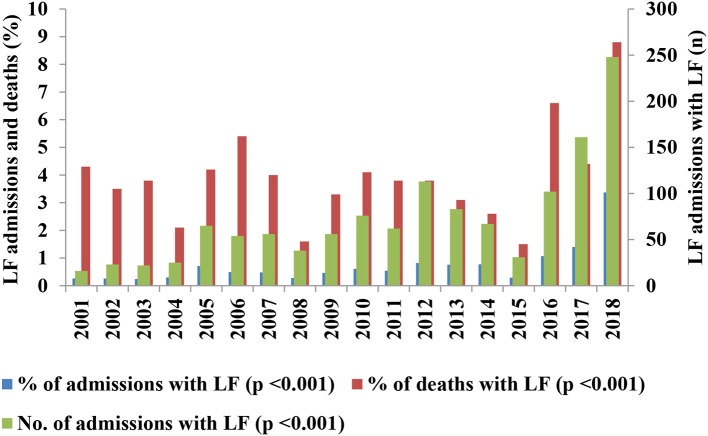
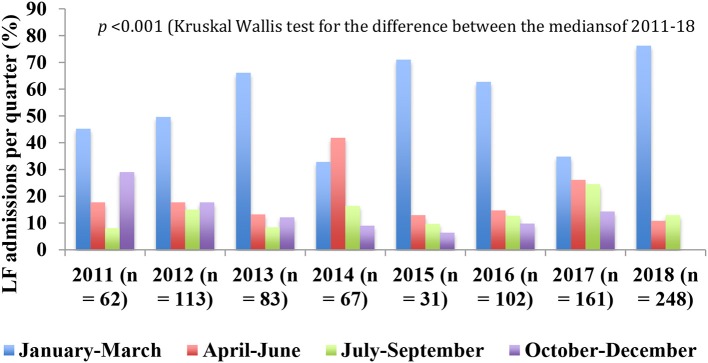
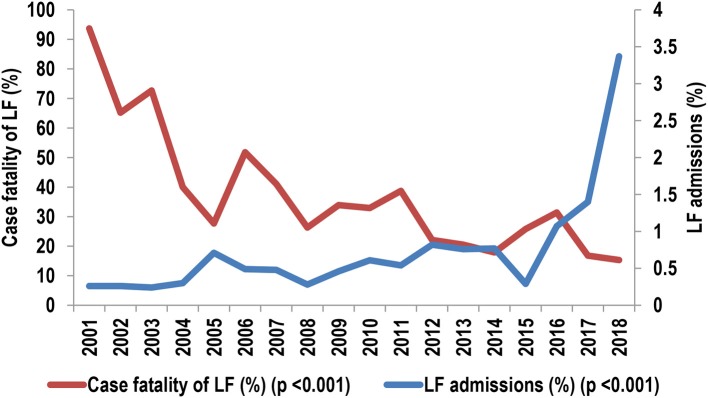
Background: The general lack of comprehensive data on the trends of Lassa fever (LF) outbreaks contrasts with its widespread occurrence in West Africa and is an important constraint in the design of effective control measures. We reviewed the contribution of LF to admissions and mortality among hospitalized patients from 2001 to 2018 in the bid to address this gap. Methods: Observational study of LF caseload and mortality from 2001 to 18 in terms of the contribution of confirmed LF to admissions and deaths, and case fatality (CF) among patients with confirmed LF at a specialist center in Nigeria. The diagnosis of LF was confirmed using reverse transcription polymerase chain reaction (RT-PCR) test, and medians and frequencies were compared using Kruskal-Wallis, Mann-Whitney and χ2 tests, with p-values <0.05 taken as significant. Results: The contribution of confirmed LF to deaths (362/9057, 4.0%) was significantly higher than to admissions (1,298/185,707, 0.7%; OR [95% CI] = 5.9 [5.3, 6.7], p < 0.001). The average CF among patients with confirmed LF declined from 154/355 (43%) in 2001-09 to 183/867 (21.1%) (OR [95% CI] = 2.9 [2.2, 3.7], p < 0.001) in 2011-18. The annual CF declined from 94% in 2001 to 15% in 2018 whereas the caseload increased from 0.3 to 3.4%. The outbreaks were characterized by irregular cycles of high caseload in 2005-2007, 2012-2014, and 2016-2018, and progressive blurring of the seasonality. Conclusion: LF outbreaks in Nigeria have upgraded spatially and temporally, with the potential for cycles of increasing severity. The strategic establishment of LF surveillance and clinical case management centers could be a pragmatic and cost-effective approach to mitigating the outbreaks, particularly in reducing the associated CF. Urgent efforts are needed in reinvigorating extant control measures while the search for sustainable solutions continues.
Keywords: Lassa fever; Nigeria; case fatality; caseload; center's experience; implications; outbreaks; trends.
Figures
References
-
- Ogbu O, Ajulijukwu E, Uneke CJ. Lassa fever in West African sub-region: an overview. J Vector Borne Dis. (2007) 44:1–11. - PubMed
-
- European Centre for Disease Prevention and Control Lassa fever in Nigeria, Benin, Togo, Germany and USA−23 March 2016 (2016).
Grants and funding
LinkOut - more resources
Full Text Sources
Miscellaneous