. 2019 Dec 1;40(6):1605-1625.
doi: 10.1210/er.2018-00262.

Steroid Metabolome Analysis in Disorders of Adrenal Steroid Biosynthesis and Metabolism

Affiliations

Steroid Metabolome Analysis in Disorders of Adrenal Steroid Biosynthesis and Metabolism

Karl-Heinz Storbeck et al. Endocr Rev. .

Abstract

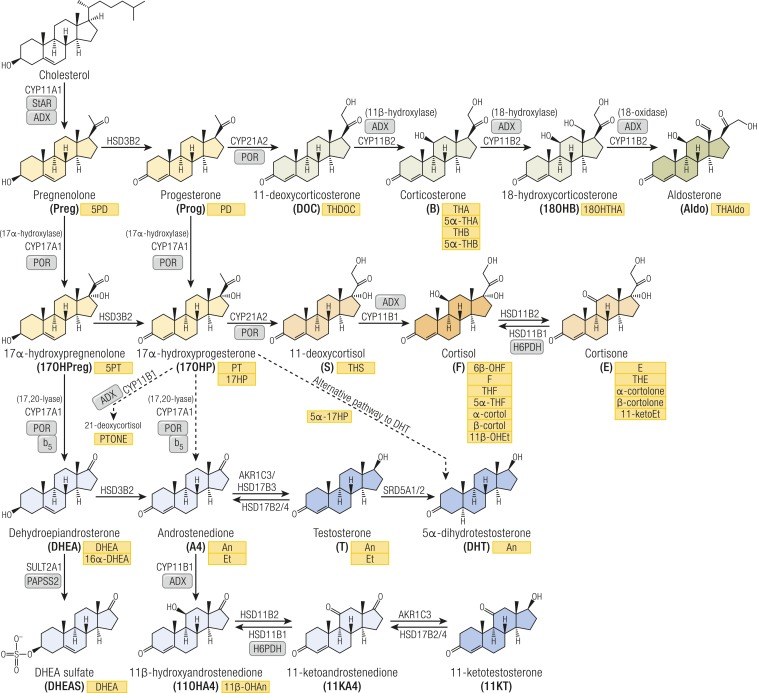
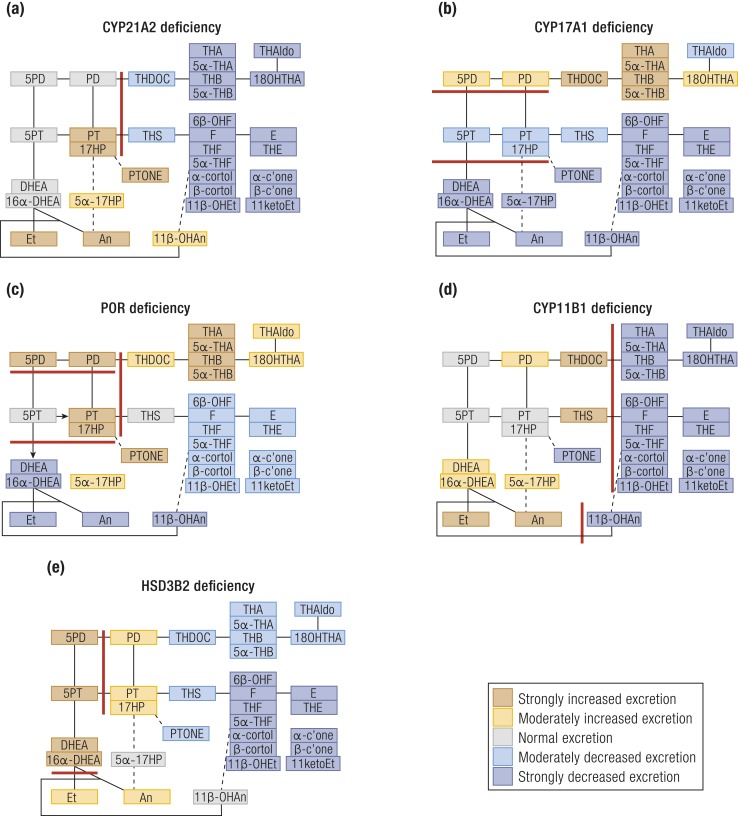
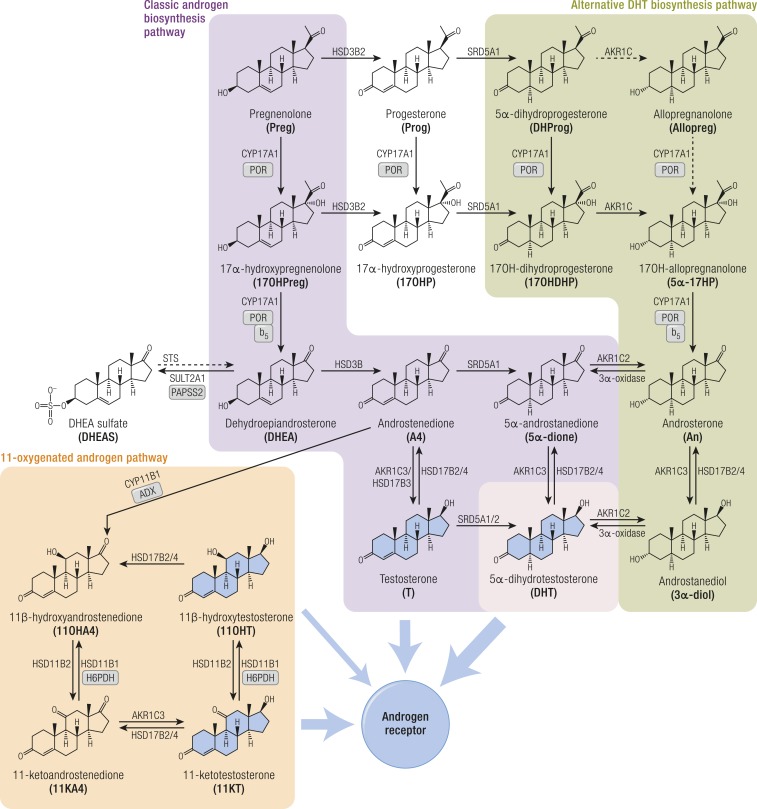
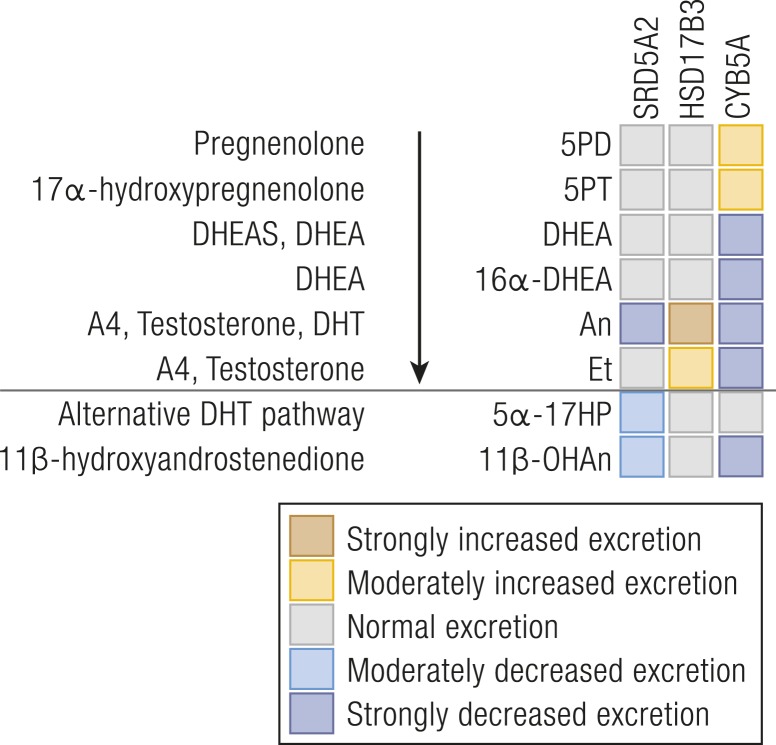
Steroid biosynthesis and metabolism are reflected by the serum steroid metabolome and, in even more detail, by the 24-hour urine steroid metabolome, which can provide unique insights into alterations of steroid flow and output indicative of underlying conditions. Mass spectrometry-based steroid metabolome profiling has allowed for the identification of unique multisteroid signatures associated with disorders of steroid biosynthesis and metabolism that can be used for personalized approaches to diagnosis, differential diagnosis, and prognostic prediction. Additionally, steroid metabolome analysis has been used successfully as a discovery tool, for the identification of novel steroidogenic disorders and pathways as well as revealing insights into the pathophysiology of adrenal disease. Increased availability and technological advances in mass spectrometry-based methodologies have refocused attention on steroid metabolome profiling and facilitated the development of high-throughput steroid profiling methods soon to reach clinical practice. Furthermore, steroid metabolomics, the combination of mass spectrometry-based steroid analysis with machine learning-based approaches, has facilitated the development of powerful customized diagnostic approaches. In this review, we provide a comprehensive up-to-date overview of the utility of steroid metabolome analysis for the diagnosis and management of inborn disorders of steroidogenesis and autonomous adrenal steroid excess in the context of adrenal tumors.


Figures

Figure 1.
Figure 1.
Schematic overview of steroidogenesis and corresponding urine steroid metabolites. Steroids are color-coded according to their bioactivity or commitment to a specific pathway: general precursors (yellow), mineralocorticoid precursors (light green), active mineralocorticoid (dark green), glucocorticoid precursors and inactive metabolite (light orange), active glucocorticoid (dark orange), androgen precursors (light blue), and active androgens (dark blue). Corresponding urinary metabolites are shown in yellow boxes. Arrows are labeled with the catalyzing enzyme and isoform. Essential cofactor proteins are also indicated: ADX, adrenodoxin; b5, cytochrome b5; PAPSS2, PAPS synthase 2; PRO, cytochrome P450 oxidoreductase; StAR, steroidogenic acute regulatory protein.
Figure 2.
Figure 2.
(a–e) Schematic visualization of urine steroid metabolome signatures in the five variants of CAH. (a) CYP21A2, (b) CYP17A1, (c) POR, (d) CYP11B1, and (e) HSD3B2 deficiencies. The figure depicts the changes in the major urine steroid metabolites relative to the reference range median of each metabolite and does not represent overall quantitative excretion. Steroid metabolites are mapped onto the steroidogenic pathways leading to mineralocorticoid, glucocorticoid, and androgen biosynthesis as shown in Fig. 1. Data derived from (–28).
Figure 3.
Figure 3.
Schematic overview of the three major pathways of human androgen biosynthesis. The classic, alternative, and 11-oxygenated androgen pathways are each shown in different colors. Androgens that activate the androgen receptor are shown with broad blue arrows leading from them. Other arrows are labeled with the catalyzing enzyme and isoform where appropriate. Essential cofactor proteins are also indicated: b5, cytochrome b5; PAPSS2, PAPS synthase 2; POR, cytochrome P450 oxidoreductase.
Figure 4.
Figure 4.
Heat map visualization of urine steroid metabolome signatures associated with inborn disorders of androgen biosynthesis. The figure depicts the changes in the major urine steroid metabolites associated with androgen biosynthesis relative to the reference range median of each steroid metabolite and does not represent overall quantitative excretion. For explanation of the link between precursors, active steroids, and their metabolites, please see Fig. 1. Data derived from (15, 61, 62).
Figure 5.
Figure 5.
Heat map visualization of urine steroid metabolome signatures associated with HSD11B and H6PDH deficiencies. (a) H6PDH deficiency, (b) HSD11B1 deficiency, and (c) HSD11B2 deficiency. The figure depicts the changes in the major urine steroid metabolites relative to the reference range median of each metabolite and does not represent overall quantitative excretion. Steroid metabolites are mapped onto the steroidogenic pathways leading to mineralocorticoid, glucocorticoid, and androgen biosynthesis as shown in Fig. 1. Data derived from (, , –100).
Figure 6.
Figure 6.
Heat map visualization of urine steroid metabolome signatures associated with inborn mineralocorticoid excess. The figure depicts the changes in the major urine steroid metabolites associated with mineralocorticoid biosynthesis relative to the reference range median of each metabolite and does not represent overall quantitative excretion. For explanation of the link between precursors, active steroids, and their metabolites, please see Fig. 1. Data derived from (, –124).
Figure 7.
Figure 7.
Schematic overview of the biosynthesis and downstream metabolism of the “hybrid steroids” 18-hydroxycortisol (18OHF) and 18-oxocortisol (18oxoF). Whereas 18OHF is excreted unmodified in urine, 18oxoF is primarily detected as its tetrahydro metabolite (18oxoTHF).
Figure 8.
Figure 8.
Schematic visualization of urinary steroid metabolome signatures associated with disorders causing autonomous adrenal steroid excess. (a) Adrenal Cushing syndrome, (b) ACTH-dependent Cushing syndrome, (c) MACE, (d) primary aldosteronism, and (e) ACC. The figure depicts the changes in the major urinary metabolites relative to the normal median of each steroid metabolite and does not represent overall quantitative excretion. Steroid metabolites are mapped onto the steroidogenic pathways leading to mineralocorticoid, glucocorticoid, and androgen biosynthesis as shown in Fig. 1. Data derived from (, –155).

References

    1. Arlt W, Biehl M, Taylor AE, Hahner S, Libé R, Hughes BA, Schneider P, Smith DJ, Stiekema H, Krone N, Porfiri E, Opocher G, Bertherat J, Mantero F, Allolio B, Terzolo M, Nightingale P, Shackleton CH, Bertagna X, Fassnacht M, Stewart PM. Urine steroid metabolomics as a biomarker tool for detecting malignancy in adrenal tumors. J Clin Endocrinol Metab. 2011;96(12):3775–3784. - PMC - PubMed
    1. Biehl M, Schneider P, Smith DJ, Stiekema H, Taylor AE, Hughes BA, Shackleton CHL, Stewart PM, Arlt W. Matrix relevance LVQ in steroid metabolomics based classification of adrenal tumors. Available at: www.i6doc.com/en/livre/?GCOI=28001100967420. Accessed 30 April 2019.
    1. Bunte K, Smith DJ, Chappell MJ, Hassan-Smith ZK, Tomlinson JW, Arlt W, Tiňo P. Learning pharmacokinetic models for in vivo glucocorticoid activation. J Theor Biol. 2018;455:222–231. - PubMed
    1. Thomson W, Jabbari S, Taylor AE, Arlt W, Smith DJ. Simultaneous parameter estimation and variable selection via the logit-normal continuous analogue of the spike-and-slab prior. J R Soc Interface. 2019;16(150):20180572. - PMC - PubMed
    1. Storbeck K-H, Gilligan L, Jenkinson C, Baranowski ES, Quanson JL, Arlt W, Taylor AE. The utility of ultra-high performance supercritical fluid chromatography–tandem mass spectrometry (UHPSFC-MS/MS) for clinically relevant steroid analysis. J Chromatogr B Analyt Technol Biomed Life Sci. 2018;1085:36–41. - PubMed

Publication types

MeSH terms