

Gait analysis with wearables predicts conversion to parkinson disease
- PMID: 31294853
- PMCID: PMC6899833
- DOI: 10.1002/ana.25548
Gait analysis with wearables predicts conversion to parkinson disease
Abstract
Objective: Quantification of gait with wearable technology is promising; recent cross-sectional studies showed that gait characteristics are potential prodromal markers for Parkinson disease (PD). The aim of this longitudinal prospective observational study was to establish gait impairments and trajectories in the prodromal phase of PD, identifying which gait characteristics are potentially early diagnostic markers of PD.
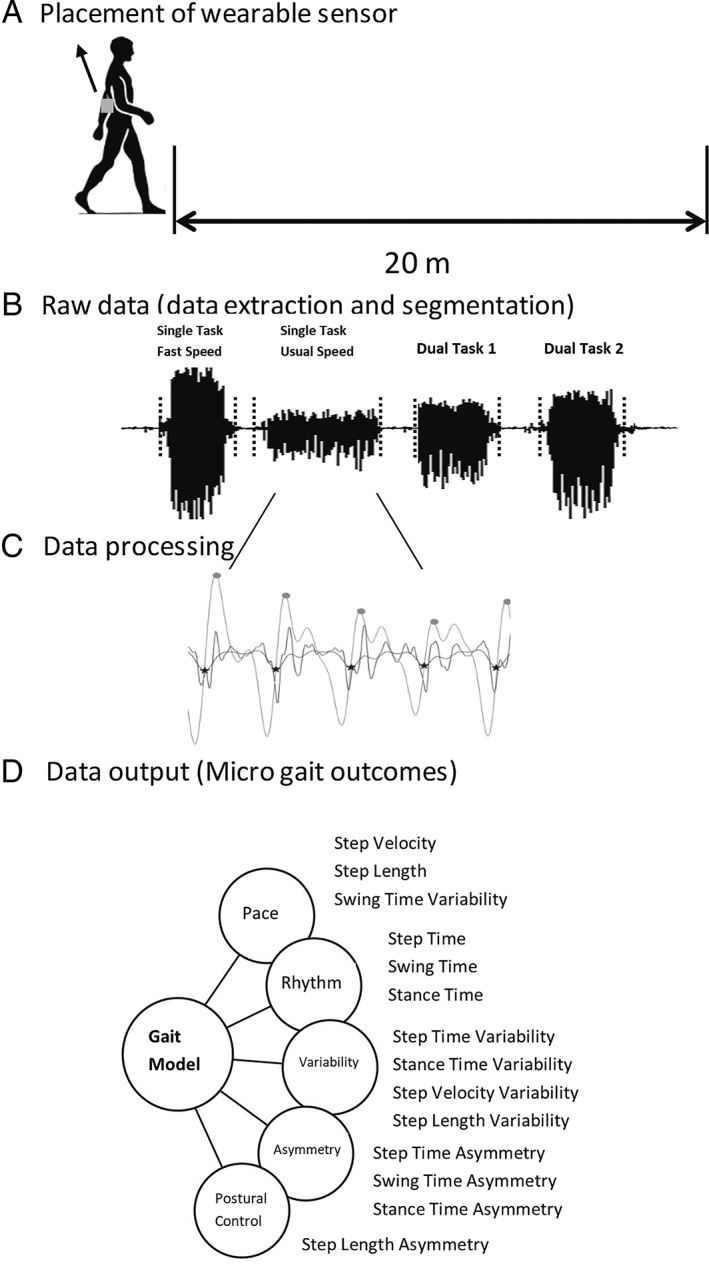
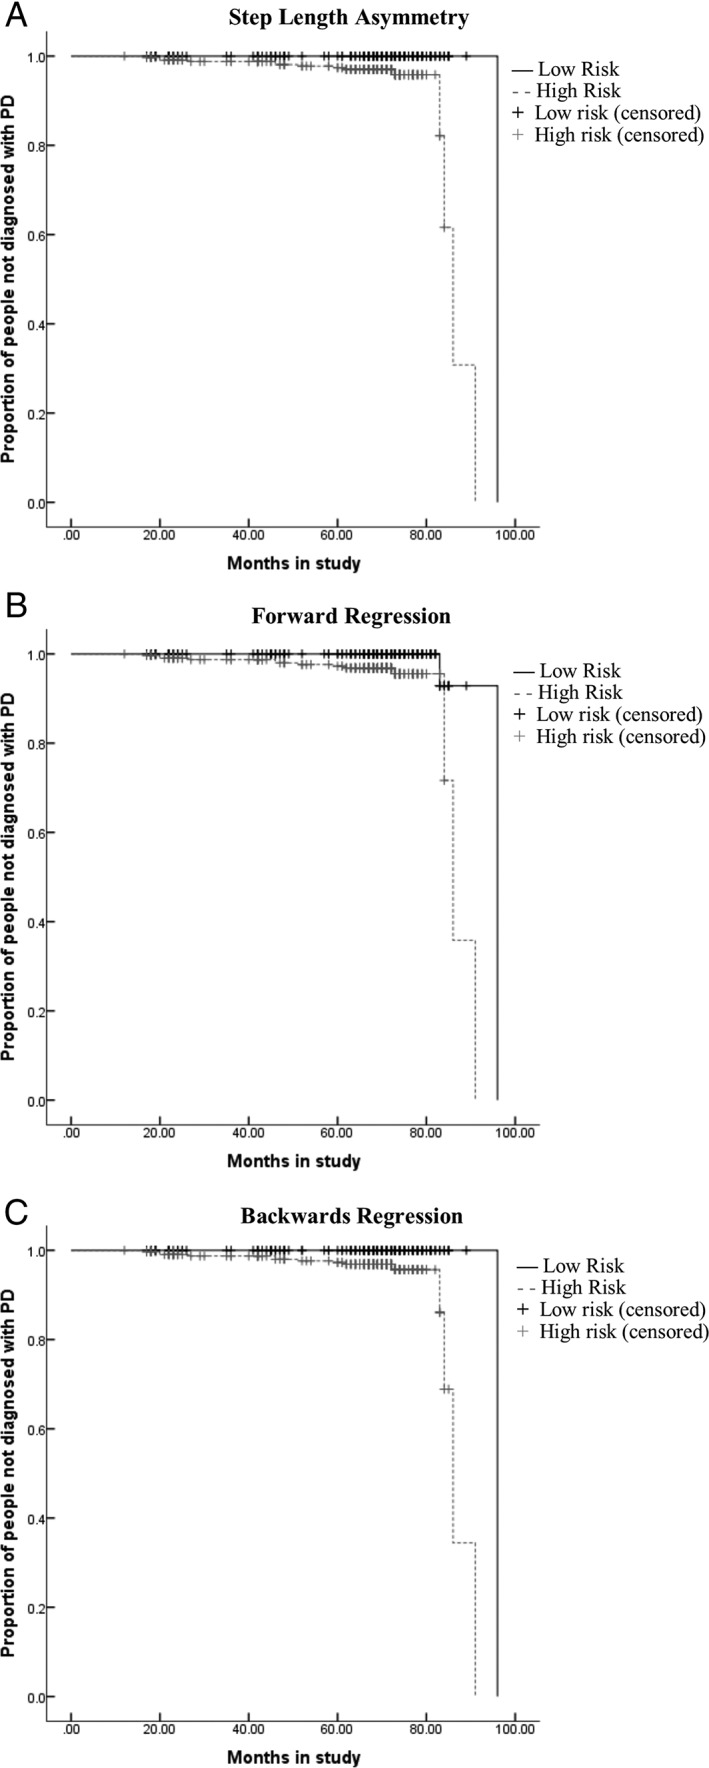
Methods: The 696 healthy controls (mean age = 63 ± 7 years) recruited in the Tubingen Evaluation of Risk Factors for Early Detection of Neurodegeneration study were included. Assessments were performed longitudinally 4 times at 2-year intervals, and people who converted to PD were identified. Participants were asked to walk at different speeds under single and dual tasking, with a wearable device placed on the lower back; 14 validated clinically relevant gait characteristics were quantified. Cox regression was used to examine whether gait at first visit could predict time to PD conversion after controlling for age and sex. Random effects linear mixed models (RELMs) were used to establish longitudinal trajectories of gait and model the latency between impaired gait and PD diagnosis.
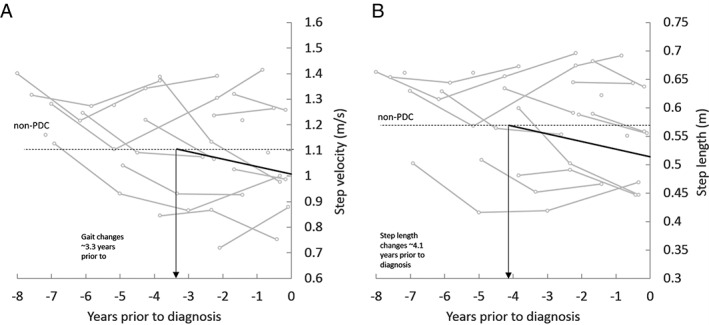
Results: Sixteen participants were diagnosed with PD on average 4.5 years after first visit (converters; PDC). Higher step time variability and asymmetry of all gait characteristics were associated with a shorter time to PD diagnosis. RELMs indicated that gait (lower pace) deviates from that of non-PDC approximately 4 years prior to diagnosis.
Interpretation: Together with other prodromal markers, quantitative gait characteristics can play an important role in identifying prodromal PD and progression within this phase. ANN NEUROL 2019;86:357-367.
© 2019 The Authors. Annals of Neurology published by Wiley Periodicals, Inc. on behalf of American Neurological Association.
Conflict of interest statement
Nothing to report.
Figures
Comment in
-
Quantitative Motor Functioning in Prodromal Parkinson Disease.Ann Neurol. 2019 Dec;86(6):981. doi: 10.1002/ana.25606. Epub 2019 Oct 4. Ann Neurol. 2019. PMID: 31566776 No abstract available.
-
Reply to "Quantitative Motor Functioning in Prodromal Parkinson Disease".Ann Neurol. 2019 Dec;86(6):981-982. doi: 10.1002/ana.25605. Epub 2019 Oct 4. Ann Neurol. 2019. PMID: 31566802 No abstract available.
References
-
- Berg D, Postuma RB, Adler CH, et al. MDS research criteria for prodromal Parkinson's disease. Mov Disord 2015;30:1600–1611. - PubMed
-
- de la Fuente‐Fernandez R, Schulzer M, Kuramoto L, et al. Age‐specific progression of nigrostriatal dysfunction in Parkinson's disease. Ann Neurol 2011;69:803–810. - PubMed
Publication types
MeSH terms
Grants and funding
- WT_/Wellcome Trust/United Kingdom
- 721577/Elke Warmerdam is supported by the Keep Control, European Union's Horizon 2020 research and innovation programme under the Marie Skłodowska-Curie grant agreement/International
- SDD is supported by the Newcastle Biomedical Research Centre (BRC) based at Newcastle upon Tyne and Newcastle University. The work was also supported by the NIHR/Wellcome Trust Clinical Research Facility (CRF) infrastructure at Newcastle upon Tyne Hospitals NHS Foundation Trust/International
LinkOut - more resources
Full Text Sources
Medical
