. 2019 Dec;87(12):1021-1036.
doi: 10.1002/prot.25775. Epub 2019 Jul 24.

CASP13 target classification into tertiary structure prediction categories

Affiliations

CASP13 target classification into tertiary structure prediction categories

Lisa N Kinch et al. Proteins. 2019 Dec.

Abstract

Protein target structures for the Critical Assessment of Structure Prediction round 13 (CASP13) were split into evaluation units (EUs) based on their structural domains, the domain organization of available templates, and the performance of servers on whole targets compared to split target domains. Eighty targets were split into 112 EUs. The EUs were classified into categories suitable for assessment of high accuracy modeling (or template-based modeling [TBM]) and topology (or free modeling [FM]) based on target difficulty. Assignment into assessment categories considered the following criteria: (a) the evolutionary relationship of target domains to existing fold space as defined by the Evolutionary Classification of Protein Domains (ECOD) database; (b) the clustering of target domains using eight objective sequence, structure, and performance measures; and (c) the placement of target domains in a scatter plot of target difficulty against server performance used in the previous CASP. Generally, target domains with good server predictions had close template homologs and were classified as TBM. Alternately, targets with poor server predictions represent a mixture of fast evolving homologs, structure analogs, and new folds, and were classified as FM or FM/TBM overlap.

Keywords: CASP13; classification; fold space; free modeling; protein structure; sequence homologs; structure analogs; structure prediction; template-based modeling.


Figures

Figure 1.
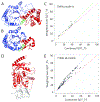
Figure 1.. Evaluation Unit (EU) domain-based definition.
A) T0978 includes a TIM barrel (blue cartoon) with an inserted zinc-binding domain (red cartoon) that separates the last helix (green cartoon) from the rest of the TIM barrel. B) The top structure template 1jtbB (LGA_S 48.09) has a similar domain organization (colored as in A). C) Grishin plot suggests similar server model 1 performance on individual domains (Y-axis) and whole targets (X-axis). D) T1000 includes an N-terminal domain with a previously solved structure (gray cartoon) that was excluded from regular assessment, but was included as a special case (T1000-sp) together with the C-terminal domain (red cartoon). E) Grishin plots for all server models exhibit non-linear performance distribution.
Figure 2.
Figure 2.. Complex Interaction Topologies and Conformation Changes.
A) T0960 can be split into 5 sequential domains (left). Globular domains (colored cyan, green, and red) are interspersed between extended segments (gray) whose structure are defined by obligate trimeric interactions (chains colored magenta, cyan and green, right). B) T0953s1 (left) forms an obligate trimer (chains colored magenta, cyan, and green) with a beta-meander and extended segments that are present in the top phage tail fiber protein trimerization domain template (2×3h, below left). T0953s2 (right) adopts 3 domains (blue, green and red). The central domain (green) is defined by similarity to the top single-stranded right-handed beta-helix template (4pmh, below right) and has an inserted compact fiber-like domain (red), with an additional swapped fibrous segment that leads to domain definitions with discontinuous sequence. C) T0950 adopts an extended helical conformation that inserts into membrane that can be split into two domains (blue and red) based on the top template (below), which adopts an alternate soluble conformation (blue and salmon). D) T0999-D2 can be split into two domains (dark and light colors) found in templates with alternate conformations, including an open apo structure (green shades, 5xwb), as well as a closed substrate bound template (yellow shades, 1g6s).
Figure 3.
Figure 3.. Target EU assignment to fold space hierarchy.
A) Pie chart depicts the proportion of EUs assigned to homologs as F-group (blue) and H-group (green), to potential homologs as X-group (yellow), to New Folds (orange), or to Analogs (red). B) Target T0957s2 immunity protein (left) colored in rainbow from N-terminus (blue) to C-terminus (red) adopts a helical repetitive alpha hairpins topology assigned at the X-group level. Residues within 4Å of the bound toxin (not shown) are colored gray. The best structural template (PDB 5mu7A, LGA_S 51.1) is to half of an ARM repeat (similar elements colored in rainbow), with N-terminal helical repeats that are not shown (center). A functional E. coli CdiI analog with less similarity (PDB 5j5vA, LGA_S 31.2) belongs to a different H-group in the repetitive alpha hairpin X-group (right), with binding residues colored gray. C) Counts of EUs (x axis) assigned to ECOD Architectures.
Figure 4.
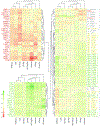
Figure 4.. Heatmap clusters target EUs based on objective measures.
Columns include three sequence-based similarity scores (HHprob, HHcovg, and HHscore), three server performance-based scores (GDTtop, GDTall, and GDTtop20), a structure-based score (LGA_S), and a score for alignment depth (Neff/Len), and rows represent target EUs. Rows and columns were clustered (depicted as trees) using Euclidean distance with complete linkage. Scores were colored from low to high using a diverging red yellow green color scheme (depicted on the bottom right). Rows were split into 3 clusters, with the two tightest clusters of clear TBM-easy (EUs labeled green) and clear FM (EUs labeled red) flipped to the left. Intermediate clusters on the right include TBM-hard (EUs labeled yellow) and TBM/FM EUs (labeled gray), with subclusters indicated by gray brackets to the right.
Figure 5.
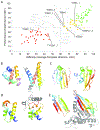
Figure 5.. Target EU difficulty correlates with server performance in CASP12-like plot.
A) Scatter of EU difficulty measured by the average of HHscore and LGA_S similarity to templates and server performance measured by average GDT of the top 20 server models. EUs are colored according to assigned categories: TBM-easy (green), TBM-hard (yellow), TBM/FM (gray), and FM (red). Difficult borderline EUs requiring manual assignment are labeled. B) FM target T0990-D1 (left) with relatively high LGA_S and performance scores does not cluster with other FM EUs. A unique loop includes conserved residues (magenta sphere) that typically bind metal. The metal binding residues are absent from the top unrelated structural template (2rt6, right), which adopts a three-helix bundle. C) TBM-hard target T0960-D3 (left) identified a template homolog (5nxf, right) with a similar overall fold (LGA_S 83.2) with relatively low sequence scores (82%, 0.54 coverage). D) TBM/FM target T0958 identified a template homolog (2kim, right) with relatively low sequence scores (81.4%, 0.59 coverage). The template exhibits SSE shifts (LGA_S 69.2) compared to the target. E) TBM/FM target T1008 represents a designed protein structure that by definition is analogous to its top template (5hnwK, right, LGA_S 73.9).
Figure 6.
Figure 6.. FM Targets are Mainly Fast-Evolving Homologs with Few New Folds.
A) Pie chart depicts evolutionary relationships of FM target domains to existing folds. B) Potential new β-sandwich fold in T0968s2 (left) is colored in rainbow from the N-terminus (blue) to the C-terminus (red). A structure template with much lower similarity (4ttgA, LGA_S 16.0) than the top β-meander template (not shown) has similar topology as a subcomponent of a larger supersandwich fold, with similar elements colored in rainbow (right). C) T0990-D2 (left) includes N-terminal helices (blue), followed by a β-meander (cyan), a central 3-helix bundle (green, yellow, and orange), and C-terminal helices (red). A top template (3eb7A, right) includes analogous helices (colored like the target) arranged like the three-helix bundle. D) T0990-D3 (left) has an N-terminal α+β subdomain (blue), followed by a connecting α-helix (cyan), and 4 broken helices in a bundle (green, yellow, orange, and red). The top template (4alyB, left) has four analogous helices (colored like the target) as a subcomponent of the overall fold.

References

    1. Moult J, Fidelis K, Kryshtafovych A, Schwede T, Tramontano A. Critical assessment of methods of protein structure prediction (CASP)-Round XII. Proteins. 2018;86 Suppl 1:7–15. doi: 10.1002/prot.25415. - DOI - PMC - PubMed
    1. Moult J A decade of CASP: progress, bottlenecks and prognosis in protein structure prediction. Curr Opin Struct Biol. 2005;15(3):285–9. doi: 10.1016/j.sbi.2005.05.011. - DOI - PubMed
    1. Abriata LA, Kinch LN, Tamo GE, Monastyrskyy B, Kryshtafovych A, Dal Peraro M. Definition and classification of evaluation units for tertiary structure prediction in CASP12 facilitated through semi-automated metrics. Proteins. 2018;86 Suppl 1:16–26. doi: 10.1002/prot.25403. - DOI - PubMed
    1. Kinch LN, Li W, Schaeffer RD, Dunbrack RL, Monastyrskyy B, Kryshtafovych A, Grishin NV. CASP 11 target classification. Proteins. 2016;84 Suppl 1:20–33. doi: 10.1002/prot.24982. - DOI - PMC - PubMed
    1. Kryshtafovych A, Fidelis K, Moult J. CASP10 results compared to those of previous CASP experiments. Proteins. 2014;82 Suppl 2:164–74. doi: 10.1002/prot.24448. - DOI - PMC - PubMed

Publication types