. 2019 Jul 11;129(10):4091-4109.
doi: 10.1172/JCI122258.

Neutrophils contribute to spontaneous resolution of liver inflammation and fibrosis via microRNA-223

Affiliations

Neutrophils contribute to spontaneous resolution of liver inflammation and fibrosis via microRNA-223

Carolina Jimenez Calvente et al. J Clin Invest. .

Abstract

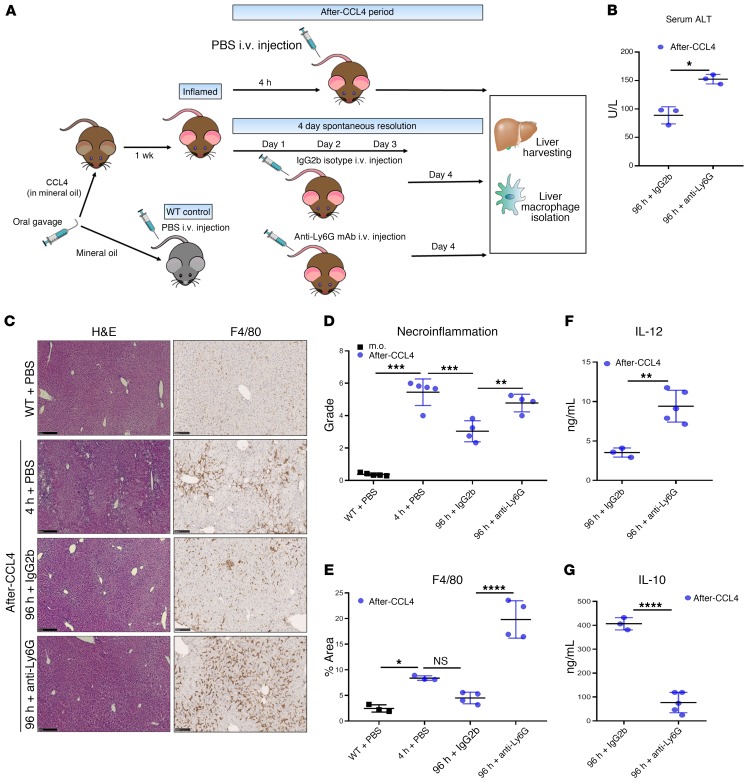
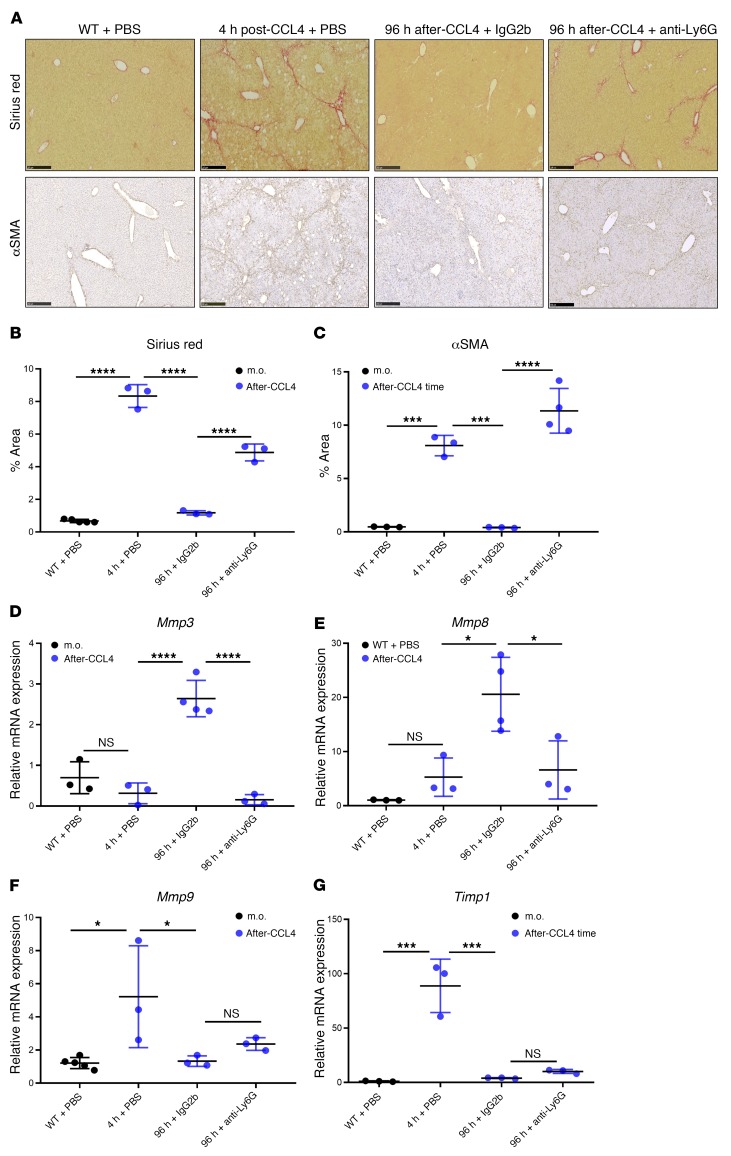
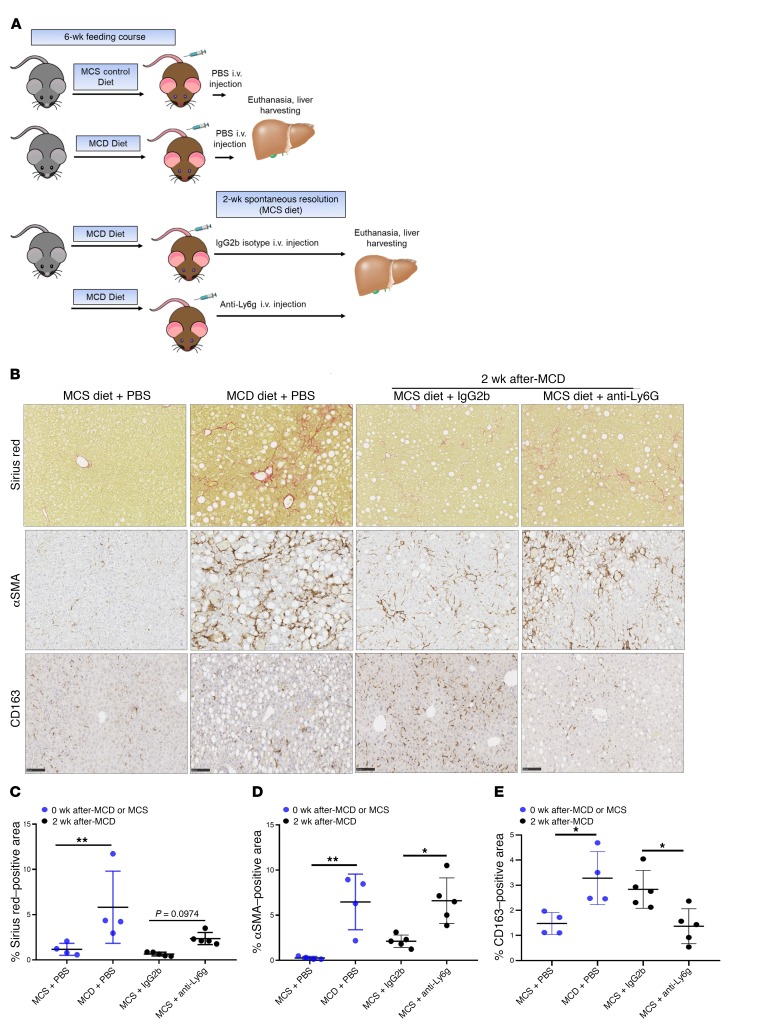
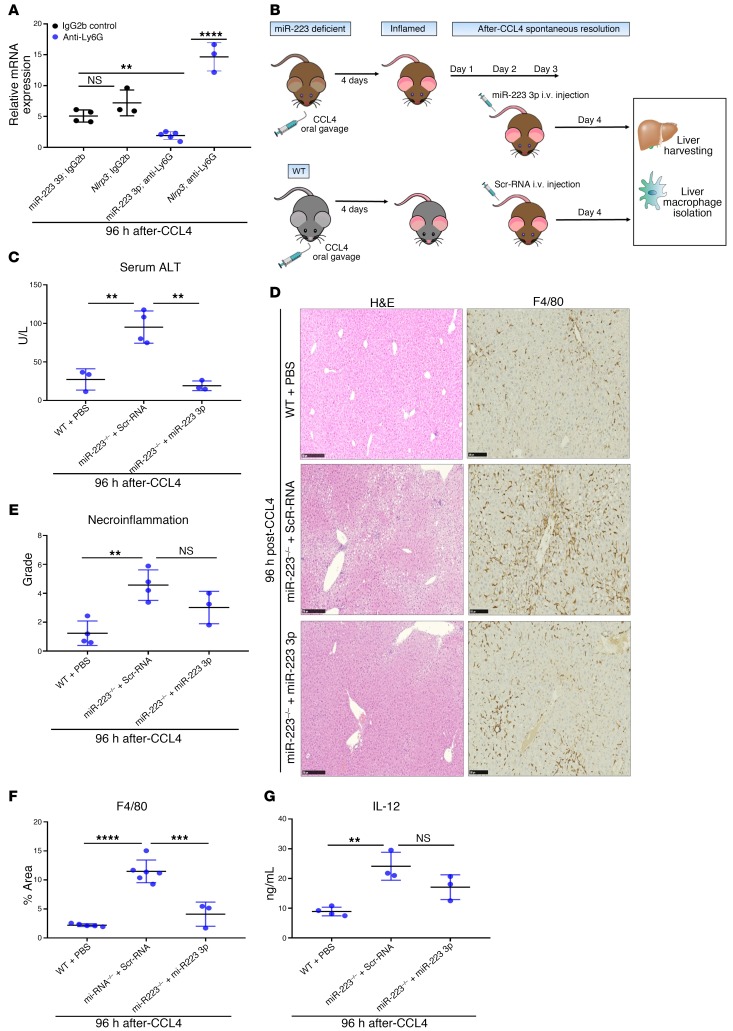
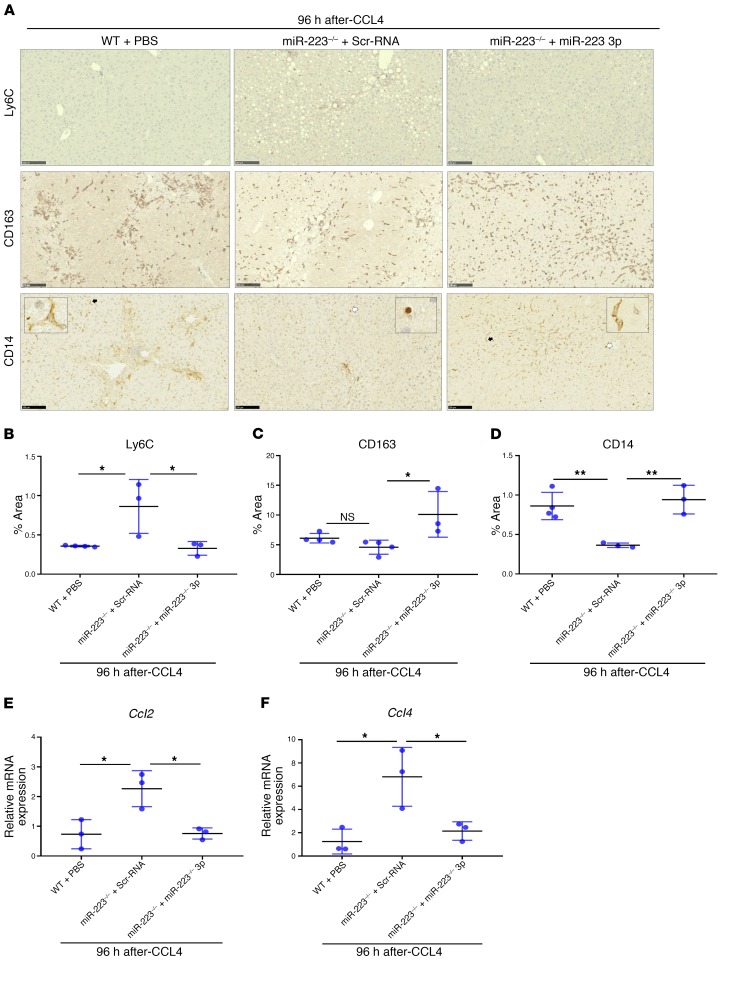
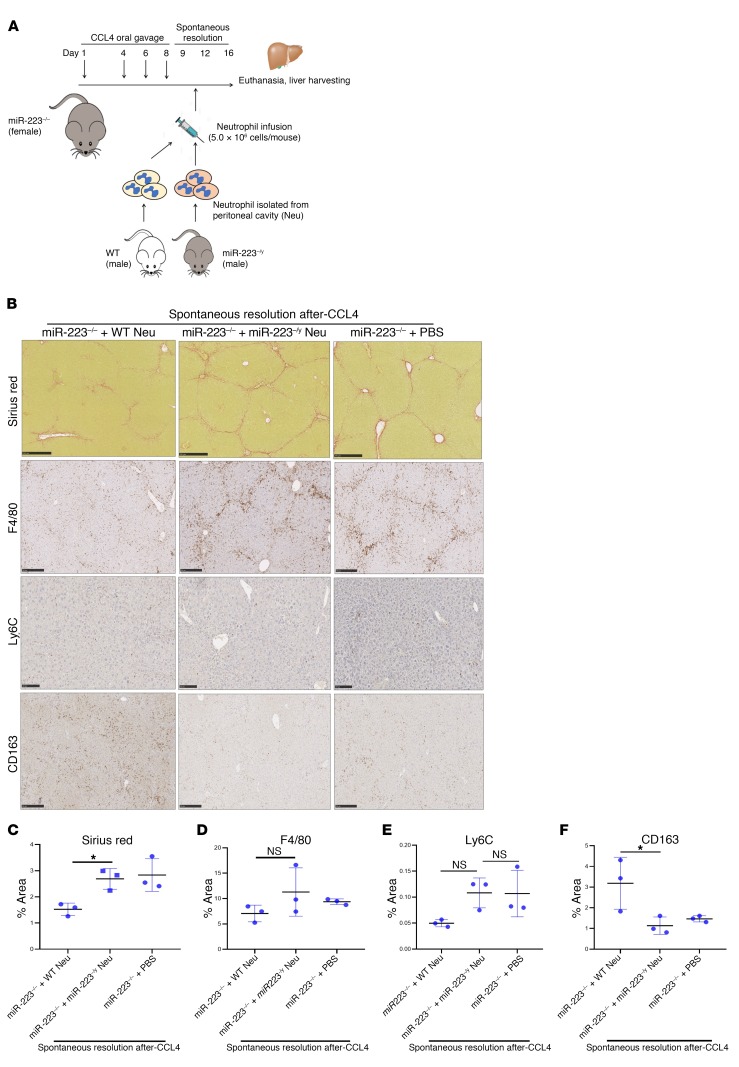
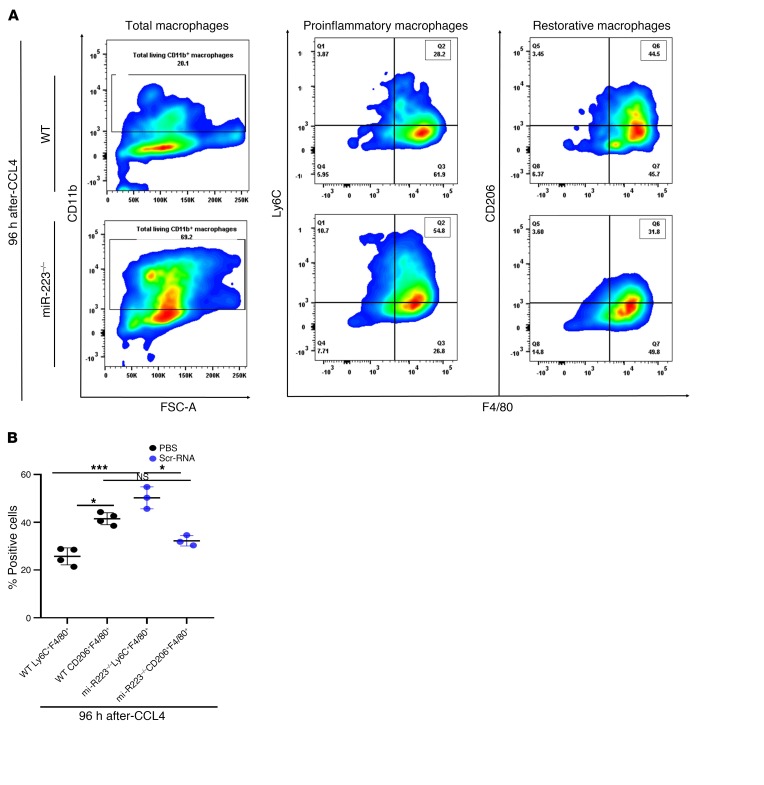
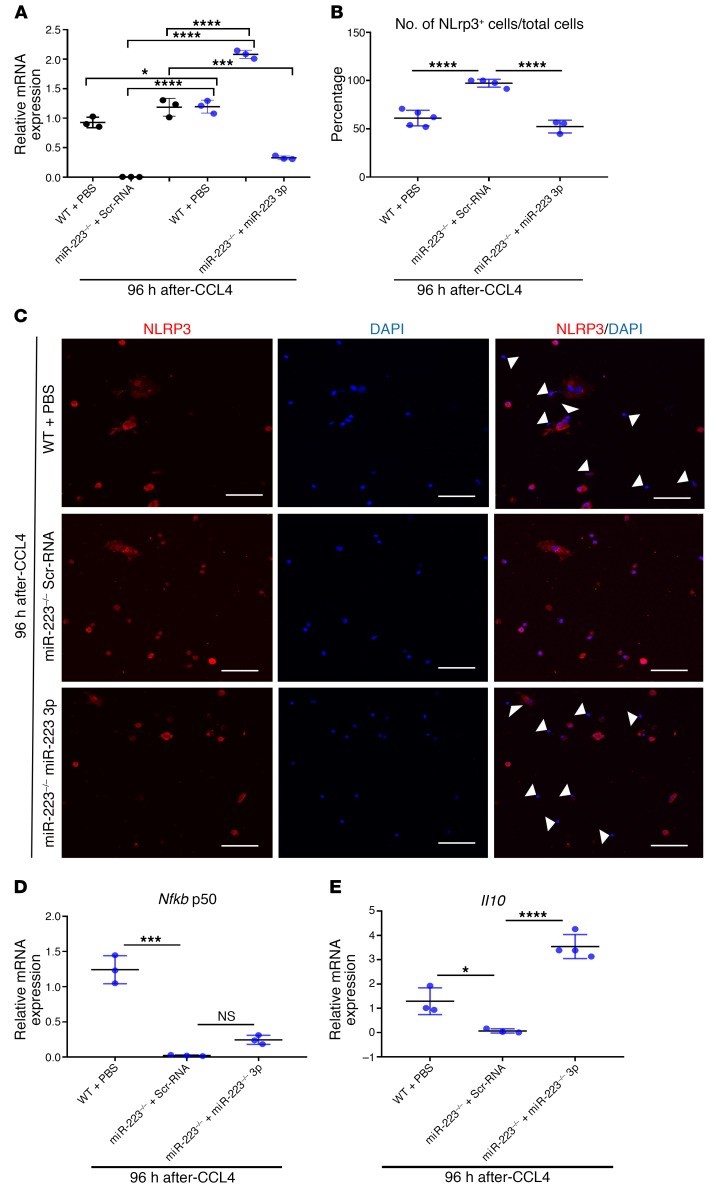
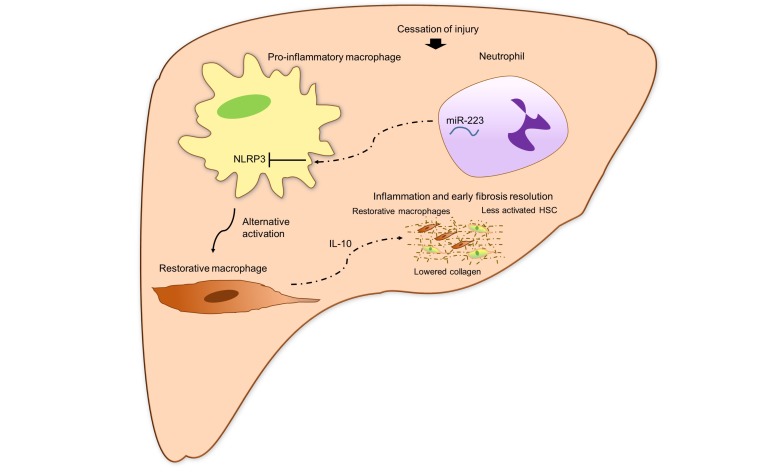
Persistent, unresolved inflammation in the liver represents a key trigger for hepatic injury and fibrosis in various liver diseases and is controlled by classically activated pro-inflammatory macrophages, while restorative macrophages of the liver are capable of reversing inflammation once the injury trigger ceases. Here we have identified a novel role for neutrophils as key contributors to resolving the inflammatory response in the liver. Using two models of liver inflammatory resolution, we found that mice undergoing neutrophil depletion during the resolution phase exhibited unresolved hepatic inflammation, activation of the fibrogenic machinery and early fibrosis. These findings were associated with an impairment of the phenotypic switch of pro-inflammatory macrophages into a restorative stage after removal of the cause of injury and an increased NLRP3 / miR-223 ratio. Mice with a deletion of the granulocyte specific miR-223 gene showed a similarly impaired resolution profile that could be reversed by restoring miR-223 levels using a miR-223 3p mimic or infusing neutrophils from wildtype animals. Collectively, our findings reveal a novel role for neutrophils in the liver as resolving effector cells that induce pro-inflammatory macrophages into a restorative phenotype, potentially via miR-223.

Keywords: Hepatology; Neutrophils.


Conflict of interest statement

Conflict of interest: The authors have declared that no conflict of interest exists.

Figures

Figure 1
Figure 1. Neutrophil depletion impairs spontaneous resolution of liver inflammation.
(A) Schematic representation of the experimental design of the systemic neutrophil depletion model during spontaneous resolution of liver inflammation (SRLI) after treatment with CCL4. (B) Serum ALT levels measured by colorimetry. *P < 0.05, 2-tailed unpaired t test, n = 3 per group. (C) Representative images of liver sections stained for parenchymal and nonparenchymal cells and total macrophages with H&E and antibody to F4/80, respectively. Scale bars: 250 or 100 μm for H & E or F4/80, respectively. n = 4–5 per group. (D) Grade of necroinflammation as assessed by the Ishak system. **P < 0.01, ***P < 0.001, 1-way ANOVA, n = 3–6 per group. (E) Percentage of F4/80–positive area in 10 randomly selected fields, by computerized image analysis. *P < 0.05, ****P < 0.0001, 1-way ANOVA, n = 3–4 per group. (F and G) Serum levels of IL-12 and IL-10 quantified by colorimetric and luminescent ELISA, respectively, using biotinylated mouse mAbs for IL-12 or IL-10. **P < 0.01, ****P < 0.0001, 2-tailed unpaired t test. Data are represented as means ± SD, n = 3–5 per group. Representative experiment of 2 independent repeats.
Figure 2
Figure 2. Neutrophil depletion results in persistence of classically activated hepatic macrophages during SRLI.
(A) Representative microphotographs of dissected livers stained for proinflammatory, restorative, and antiinflammatory macrophages using antibodies against Ly6C, CD163, or CD14, respectively. Scale bars: 100 μm. (BD) Area positive for Ly6C, CD163, or CD14 expressed as percentage and assessed with ImageJ software in 10 aleatory selected images. *P < 0.05, **P < 0.01, ***P < 0.001, ****P < 0.0001, 1-way ANOVA, n = 3–4 per group. (E and F) Hepatic expression of Ccl4 and Ccl2 transcripts as measured by quantitative RT-PCR, relative to B2m mRNA housekeeping gene. *P < 0.05, ****P < 0.0001, 1-way ANOVA. Data are represented as means ± SD, n = 3–6 per group. Representative experiment of 2 independent repeats.
Figure 3
Figure 3. Neutrophil deletion aggravates spontaneous resolution of early liver fibrosis.
(A) Sections from livers from the experiment in Figure 1A displaying representative staining for collagen and for a subset of activated HSCs with Sirius red or anti-αSMA mAb, respectively. Scale bars: 250 μm. (B and C) Area of Sirius red and αSMA expressed as percentages of 10 aleatory selected microscopic fields, quantified by ImageJ. ***P < 0.001, ****P < 0.0001, 1-way ANOVA, n = 3–6 per group. (DG) Relative mRNA expression of Mmp3, Mmp8, Mmp9, and Timp1 genes from liver homogenates of the experiment in Figure 1A, assessed by real-time RT-PCR and normalized to B2m mRNA housekeeping gene. *P < 0.05, ***P < 0.001, ****P < 0.0001, 1-way ANOVA, n = 3–6 per group. Data are shown as means ± SD. Representative experiment of 2 independent repeats.
Figure 4
Figure 4. Neutrophil abrogation impairs the spontaneous resolution of inflammation and advanced fibrosis in NASH.
(A) Experimental design showing neutrophil depletion with anti-Ly6G or control IgG2b mAb during 2 weeks (spontaneous resolution period) after a 6-week course of feeding with control MCS or MCD diet to induce fibrotic NASH. Mice treated with PBS were euthanized immediately after feeding with MCD or MCS diet to serve as the inflamed or WT controls, respectively. (B) Representative IHC images of accumulated collagen, activated HSCs, and antiinflammatory macrophages stained with Sirius red or antibodies against αSMA or CD163, respectively. Scale bars: 100 μm. (CE) Percentage of area positive for Sirius red, αSMA, or CD163 calculated in 10 aleatory selected images. *P < 0.05, **P < 0.01, 1-way ANOVA, n = 4–5. Data are shown as means ± SD. Representative experiment of 2 independent repeats.
Figure 5
Figure 5. Regulation of SRLI by miR-223.
(A) Expression of miR-223 3p and Nlrp3 transcripts in isolated macrophages from livers of the experiment in Figure 1A assessed by real-time RT-PCR and normalized to U6 or B2m housekeeping genes, respectively. **P < 0.01, ****P < 0.0001, 2-way ANOVA, n = 3–5 per group. (B) Experimental design of the miR-223 posttranscriptional replacement model during spontaneous recovery from liver inflammation after CCL4 treatment. (C) Levels of ALT in serum as measured by colorimetry. **P < 0.01, 1-way ANOVA, n = 3–4 per group. (D) Liver sections representing images of liver cells and total macrophages after staining with H&E and anti-F4/80 antibody, respectively. Scale bars: 250 or 100 μm for H & E or F4/80 images, respectively. (E) Necroinflammatory grade examined according to the Ishak system. **P < 0.01, 1-way ANOVA, n = 3–4 per group. (F) Percentage of area positive for F4/80 in 10 randomly chosen images quantified by ImageJ. ***P < 0.001, ****P < 0.0001, 1-way ANOVA, n = 3–6 per group. (G) Serum levels of IL-12 measured by colorimetric ELISA. **P < 0.01, 2-tailed unpaired t test, n = 3–4 per group. Data are shown as means ± SD.
Figure 6
Figure 6. miR-223 deficiency reduces the hepatic restorative macrophage compartment in SRLI.
(A) Representative pictures of liver sections exhibiting proinflammatory, restorative, and antiinflammatory macrophages as stained with anti-Ly6C, CD163, or CD14, respectively. Scale bars: 100 μm. (BD) Percentage of area positive for Ly6C, CD163, and CD14 in 10 randomly chosen images quantified by ImageJ. *P < 0.05, **P < 0.01, 1-way ANOVA, n = 3–4 per group. (E and F) Ccl2 and Ccl4 mRNA expression normalized to B2m mRNA and measured by real-time RT-PCR. *P < 0.05, 1-way ANOVA, n = 3 per group. Data are shown as means ± SD.
Figure 7
Figure 7. Neutrophils accelerate the spontaneous resolution of inflammation and fibrosis in miR-223–deficient mice.
(A) Experimental design of WT or miR-223–/– neutrophil infusion to miR-223–/– mice during SRLI after a 1-week course of CCL4 gavage. (B) Representative micrographs of collagen accumulation, total macrophages, and monocytes stained with Sirius red or F4/80, Ly6C, or CD163 antibody, respectively. Scale bars: 250 μm. (CF) Percentage of area positive for Sirius red, F4/80, Ly6C, or CD163 analyzed in 10 independent images. *P < 0.05, 2-way ANOVA, n = 3. Results are displayed as means ± SD. Representative experiment of 2 independent repeats.
Figure 8
Figure 8. Deletion of miR-223 impairs alternative activation of hepatic macrophages in SRLI.
(A) Representative FACS analysis of primary hepatic macrophages from mice from the experiment in Figure 4B showing single CD11b-positive (total macrophages) and double Ly6C- and F4/80-positive (proinflammatory macrophages) or CD206- and F4/80-positive (restorative macrophages) cells. Upper quadrants on the CD11b axis and upper right quadrant on the Ly6C and F4/80 or CD206 and F4/80 axis represent the percentage of single-positive or double-positive cells, respectively. (B) Percentage of double Ly6C- and F4/80-positive or CD206- and F4/80-positive cells. *P < 0.05, ***P < 0.001, 2-way ANOVA, n = 3–4. Results are displayed as means ± SD. Representative experiment of 2 repeats.
Figure 9
Figure 9. miR-223 abolition augments NLRP3 expression in hepatic macrophages during SRLI.
Macrophages were isolated from mouse livers from the experiment in Figure 5B. (A) Expression of miR-223 3p and Nlrp3 transcripts normalized by B2m mRNA and measured by real-time quantitative RT-PCR. *P < 0.05, ***P < 0.001, ****P < 0.0001, 2-way ANOVA, n = 3. (B) Number of cells positive for anti-NLRP3 mAb normalized by total cell number per field in 10 random pictures, quantified with ImageJ and expressed as percentage. ****P < 0.0001, 1-way ANOVA, n = 3–5 per group. (C) Representative confocal immunofluorescent images of NLRP3-expressing cells (red) and nuclei (blue) stained with anti-NLRP3 mAb or DAPI, respectively. Individual merges are shown where indicated. For clear distinction of area positive for anti-NLRP3 mAb, white arrowheads indicate cells and cellular areas negative for anti-NLRP3 mAb. Scale bars: 100 μm. (D and E) Expression of Nfkb p50 and Il10 mRNA normalized by B2m housekeeping gene and quantified by quantitative RT-PCR. *P < 0.05, ***P < 0.001, ****P < 0.0001, 1-way ANOVA, n = 3–4 per group. Data are shown as means ± SD.
Figure 10
Figure 10. Schematic representation of the potential resolutive mechanism of neutrophils during SRLI.
In the liver, neutrophils mediate the silencing of NLRP3 in proinflammatory macrophages via miR-223 and induce their alternative activation into a restorative phenotype after the cessation of injury. Then, restorative macrophages release IL-10 that indirectly resolves inflammation and early fibrosis by reducing the activation of HSCs and ameliorating de novo collagen formation and deposition.

Comment in

References

    1. Sun B, Karin M. Obesity, inflammation, and liver cancer. J Hepatol. 2012;56(3):704–713. doi: 10.1016/j.jhep.2011.09.020. - DOI - PMC - PubMed
    1. Robinson MW, Harmon C, O’Farrelly C. Liver immunology and its role in inflammation and homeostasis. Cell Mol Immunol. 2016;13(3):267–276. doi: 10.1038/cmi.2016.3. - DOI - PMC - PubMed
    1. Medzhitov R. Origin and physiological roles of inflammation. Nature. 2008;454(7203):428–435. doi: 10.1038/nature07201. - DOI - PubMed
    1. Liaskou E, Wilson DV, Oo YH. Innate immune cells in liver inflammation. Mediators Inflamm. 2012;2012:949157. - PMC - PubMed
    1. Koyama Y, Brenner DA. Liver inflammation and fibrosis. J Clin Invest. 2017;127(1):55–64. doi: 10.1172/JCI88881. - DOI - PMC - PubMed

Publication types

MeSH terms

Substances