. 2019 Jul 11;17(7):e3000085.
doi: 10.1371/journal.pbio.3000085. eCollection 2019 Jul.

A novel Ca2+-binding protein that can rapidly transduce auxin responses during root growth

Affiliations

A novel Ca2+-binding protein that can rapidly transduce auxin responses during root growth

Ora Hazak et al. PLoS Biol. .

Abstract

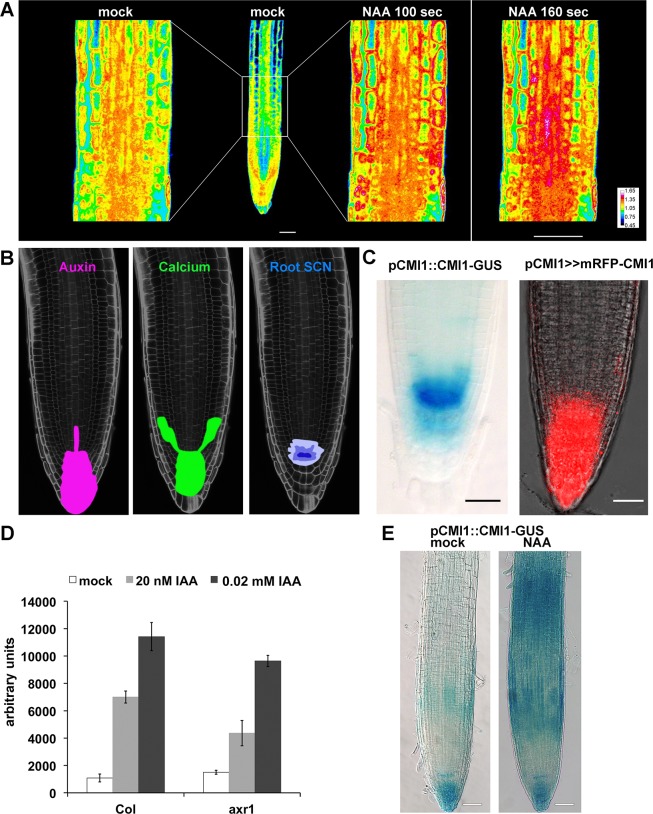
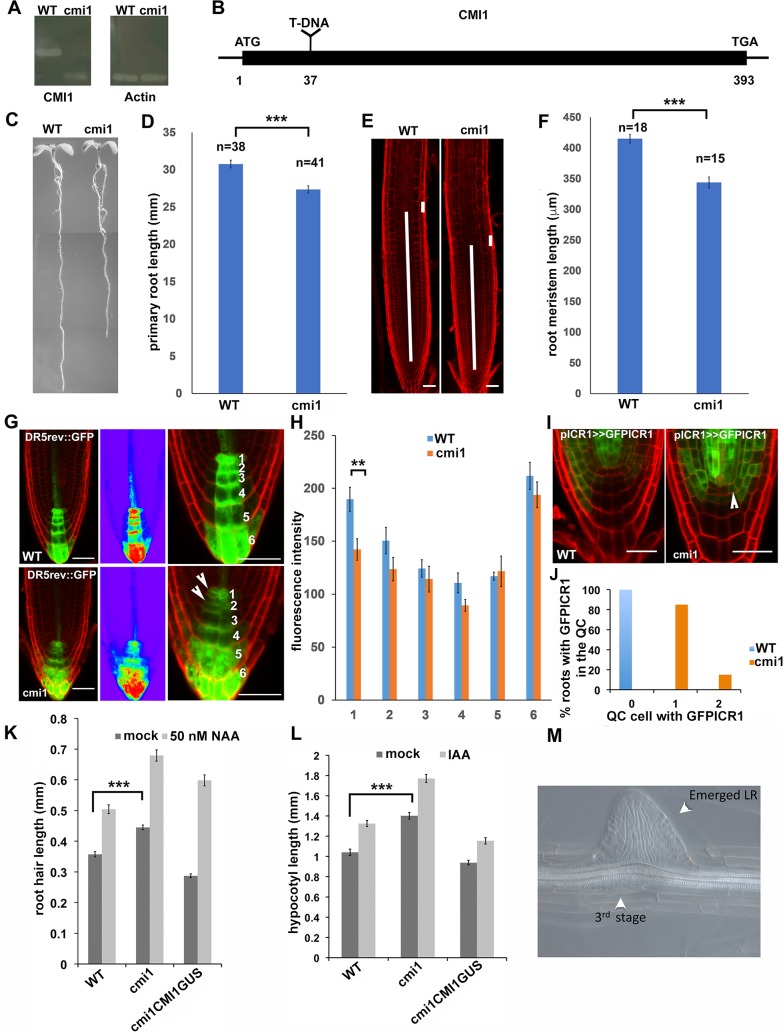
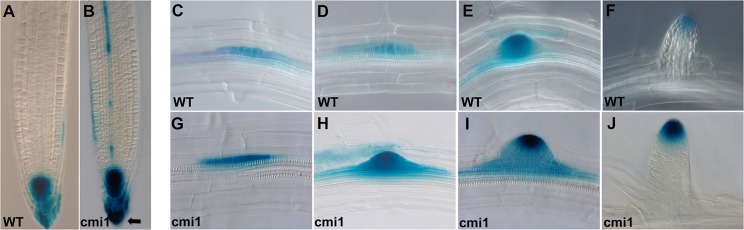
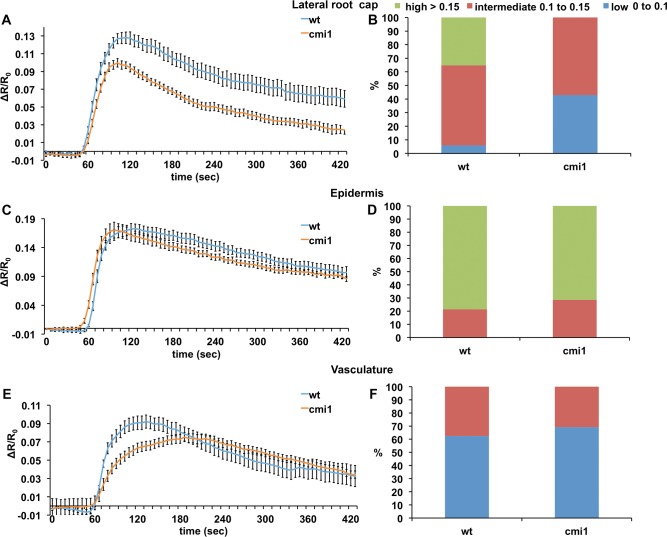
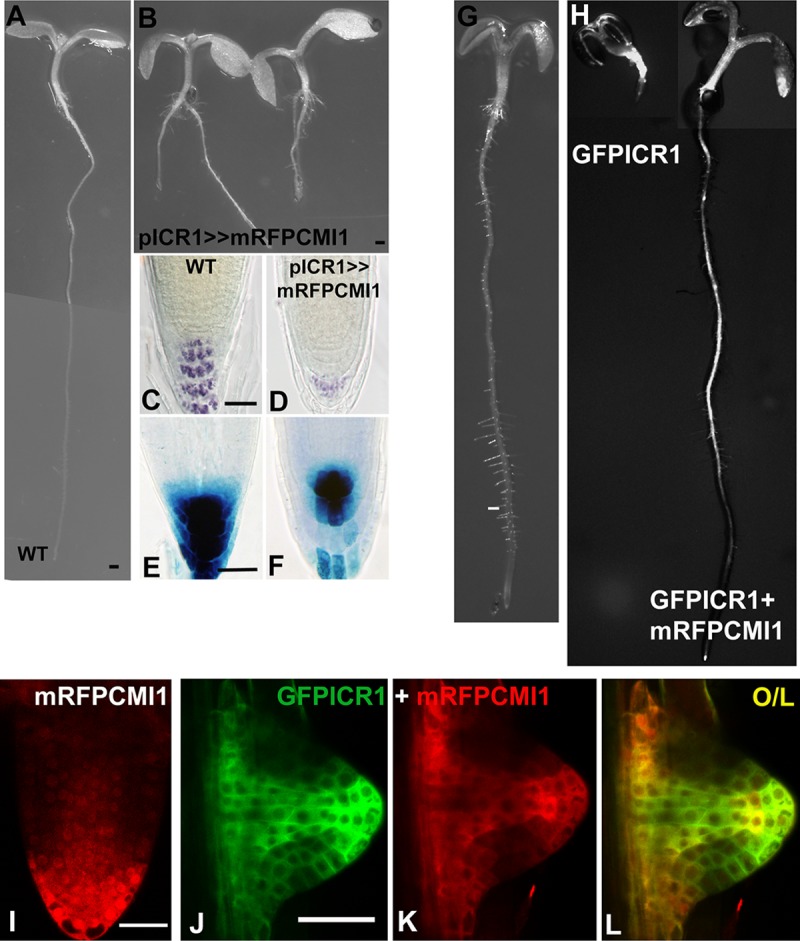
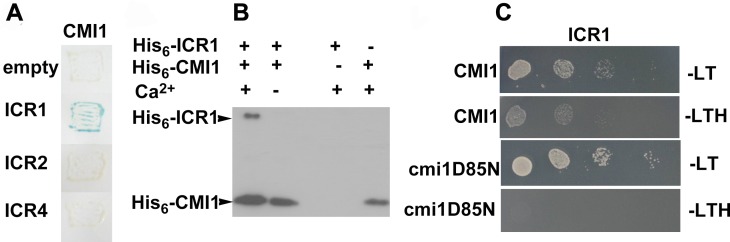
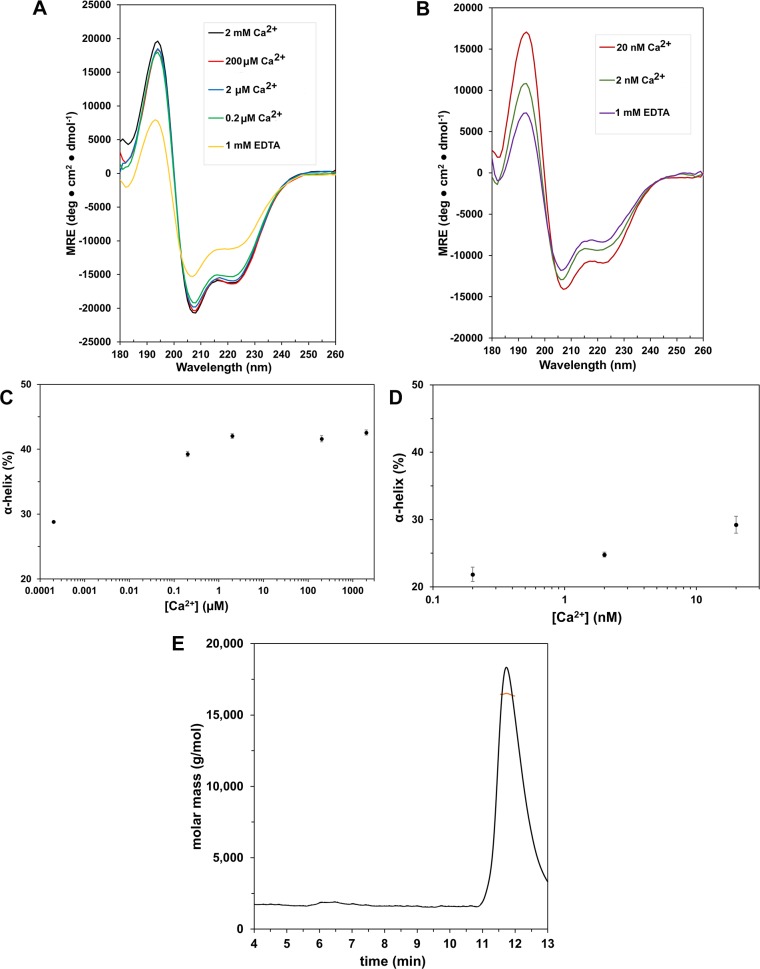
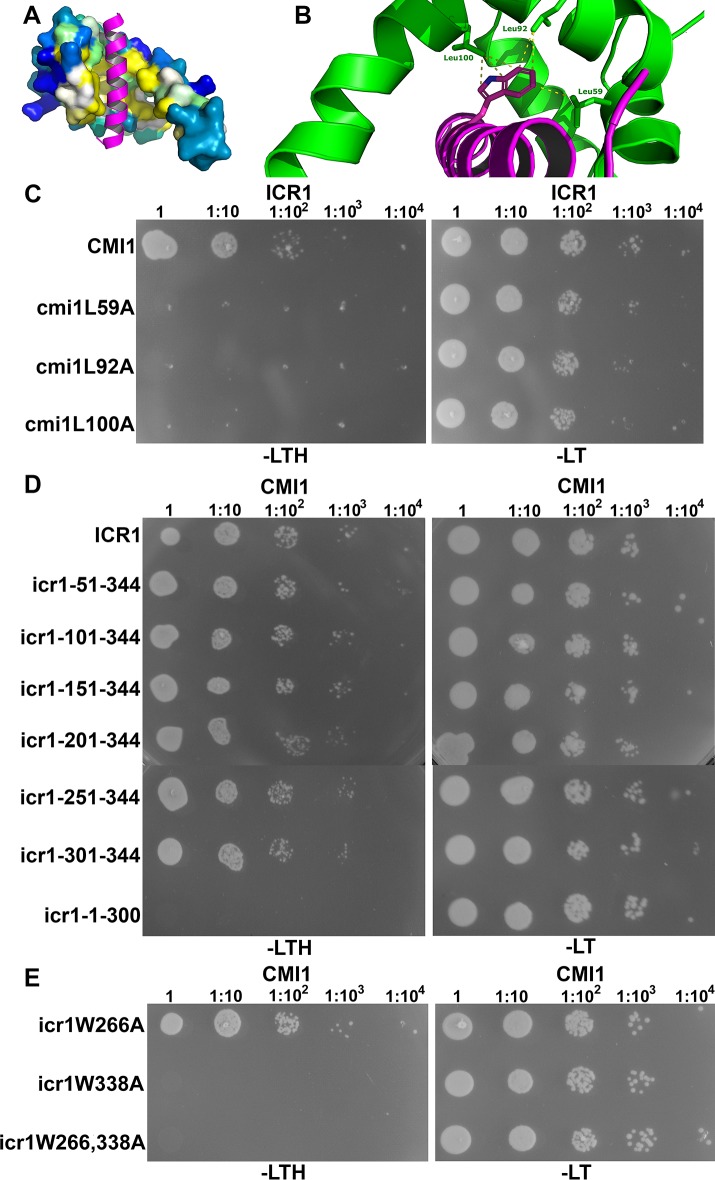
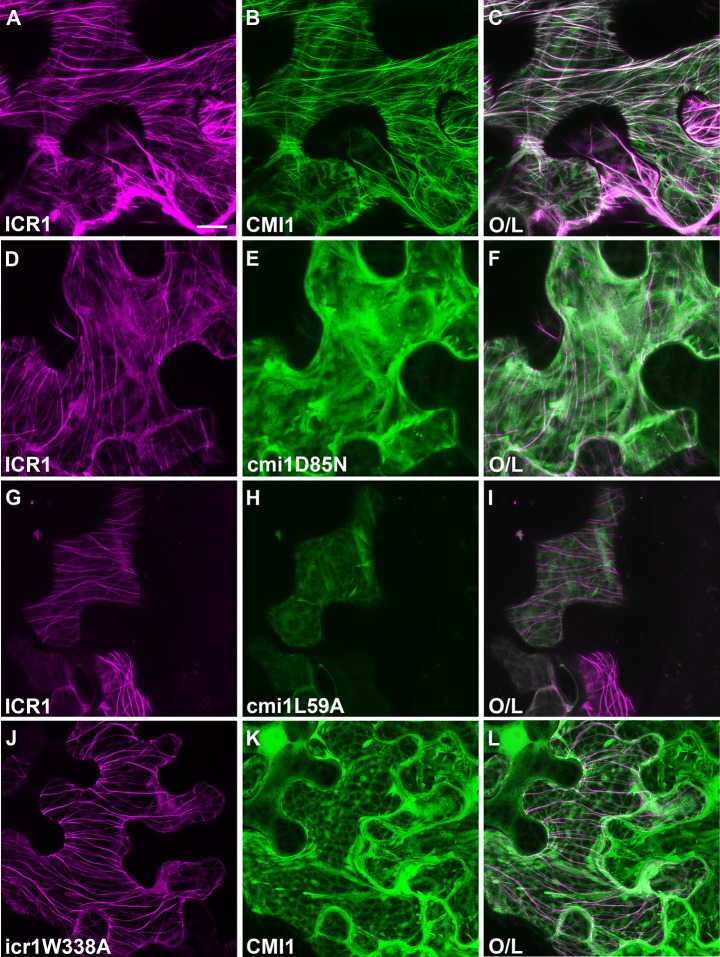
Signaling cross talks between auxin, a regulator of plant development, and Ca2+, a universal second messenger, have been proposed to modulate developmental plasticity in plants. However, the underlying molecular mechanisms are largely unknown. Here, we report that in Arabidopsis roots, auxin elicits specific Ca2+ signaling patterns that spatially coincide with the expression pattern of auxin-regulated genes. We have identified the single EF-hand Ca2+-binding protein Ca2+-dependent modulator of ICR1 (CMI1) as an interactor of the Rho of plants (ROP) effector interactor of constitutively active ROP (ICR1). CMI1 expression is directly up-regulated by auxin, whereas the loss of function of CMI1 associates with the repression of auxin-induced Ca2+ increases in the lateral root cap and vasculature, indicating that CMI1 represses early auxin responses. In agreement, cmi1 mutants display an increased auxin response including shorter primary roots, longer root hairs, longer hypocotyls, and altered lateral root formation. Binding to ICR1 affects subcellular localization of CMI1 and its function. The interaction between CMI1 and ICR1 is Ca2+-dependent and involves a conserved hydrophobic pocket in CMI1 and calmodulin binding-like domain in ICR1. Remarkably, CMI1 is monomeric in solution and in vitro changes its secondary structure at cellular resting Ca2+ concentrations ranging between 10-9 and 10-8 M. Hence, CMI1 is a Ca2+-dependent transducer of auxin-regulated gene expression, which can function in a cell-specific fashion at steady-state as well as at elevated cellular Ca2+ levels to regulate auxin responses.


Conflict of interest statement

The authors have declared that no competing interests exist.

Figures

Fig 1
Fig 1. Auxin induces specific Ca2+ pattern and the expression of CMI1.
(A) Confocal images of root expressing the YC3.6-free Ca2+ sensor prior to auxin treatment (mock) and after treatment with 10 μM NAA (“NAA”). The same is imaged after 100 and 160 sec of NAA treatment. (B) Images of a root with schematic representations of auxin and Ca2+ signal distribution at the root tip and the SCN. (C) Expression of pCMI1::CMI1-GUS in and transcription-transactivation driven pCMI1>>mRFP-CMI1 primary root meristem. (D) Microarray expression data showing the induction of CMI1 by auxin is reduced in axr1 auxin response mutant background. (E) Expression level and pattern of pCMI1-driven CMI1-GUS in cmi1 mutant background without (mock) and 2 hours following treatment with 10 μM NAA (“NAA”). Scale bars, (A) 20 μm and (C and E) 50 μm. Underlying data for this figure can be found in S1 Data. axr1, auxin-resistant 1; CMI1, Ca2+-dependent modulator of ICR1; GUS, β-glucuronidase; IAA, indole-3-acetic acid; NAA, 1-Naphthaleneacetic acid; SCN, stem cell niche; YC3.6, Yellow Cameleon 3.6.
Fig 2
Fig 2. cmi1 mutant plants have higher ICR1 levels in the QC, shorter primary root, and longer root hairs.
(A) The CMI1 RNA cannot be amplified in cmi1, indicating that the mutant is a null. (B) A diagram of the CMI1 gene highlighting the T-DNA insertion at position 37. (C) cmi1 seedlings (7 days old) have shorter primary roots. (D) Quantification of the root length in WT (Ler) and cmi1 plants. Error bars are SE, p ≤ 0.001 (t test). (E) Root cell division zones of WT (Ler) and cmi1 7-day-old seedlings. The long bars highlight the measured root zone length. The short bars show the cell length used to determine the end of the cell division zone. (F) Quantification of the root cell division zone length calculated with root samples as shown in (E). Error bars are SE, p ≤ 0.001 (t test). (G and H) DR5rev::GFP auxin response maximum is reduced in cmi1 QC. (G) Cell walls were stained with PI. The middle panels show heat diagram of the roots shown in the left panels. Right panels show higher magnifications used for quantifications. The numbers correspond to cell layers. Arrowheads highlight the signal reduction in cmi1 compared to WT. (H) Quantification of DR5rev::GFP fluorescence intensity in cell layers 1–6 as defined in panel G. Layer 1 is the QC. Error bars are SE, p ≤ 0.01 (t test). (I) GFP-ICR1 expression is up-regulated in the QC (arrowhead) in cmi1 roots. (J) Percentage of WT and cmi1 roots with GFP-ICR1 expression in 1 or 2 QC cells. (K) Root hair length in Ler (WT), cmi1, and cmi1 complemented with CMI1-GUS (cmi1CMI1GUS) in control (mock) or following treatments with 50 nM NAA. The root hairs in cmi1 mutants are significantly longer than in the WT and roots complemented with CMI1-GUS. Bars are SE, p ≤ 0.001 (t test). (L) Hypocotyl length is increased in cmi1 mutants and in response to 5 μM IAA treatments. Hypocotyls of cmi1 mutants are significantly longer than those of the WT and seedlings complemented with CMI1-GUS. Bars are SE, p ≤ 0.001 (t test). (M) A stage 3 LRI developing opposite to an emerging LRI in a cmi1 root. Scale bars, (E) 50 μm and (G and I) 20 μm. Underlying data for this figure can be found in S1 Data. CMI1, Ca2+-dependent modulator of ICR1; GFP, green fluorescent protein; GUS, GUS, β-glucuronidase; ICR1, interactor of constitutively active ROP; Ler, Landsburg erecta; LR, lateral root; LRI, LR initial; PI, propidium iodide; QC, quiescent center; WT, wild type.
Fig 3
Fig 3. CMI1 loss of function results in enhanced auxin-induced DR5::GUS expression.
Expression level of DR5::GUS auxin response marker in roots of Ler (WT) and cmi1 (B). Note the signal shift toward the columella in cmi1/DR5::GUS (arrow). (C-J) Expression levels of DR5::GUS in LRI of Ler (WT) (C-F) and cmi1 (G-J). CMI1, Ca2+-dependent modulator of ICR1; Ler, Landsburg erecta; LRI, lateral root initial; WT, wild type.
Fig 4
Fig 4. Auxin-induced Ca2+ responses are reduced in cmi1 in a tissue-specific fashion.
Auxin-induced Ca2+ responses in lateral root cap (A and B), epidermis (C and D), and vascular tissues (E and F). Note the reduced Ca2+ levels and different kinetics in Ca2+ decrease and increase in the lateral root cap and the vascular tissues, respectively. Error bars are SE. Underlying data for this figure can be found in S1 Data. cmi1, Ca2+-dependent modulator of ICR1; wt, wild type.
Fig 5
Fig 5. Ectopic expression of CMI1 suppresses root development and auxin response.
(A) Control Col-0 (WT) seedling. (B) Root growth is arrested in pICR1>>mRFP-CMI1 seedlings. (C and D) Reduced iodine (IKI) columella staining in a pICR1>>mRFP-CMI1 root. (E and F) Reduced auxin response in a pICR1>>mRFP-CMI1 DR5::GUS root. (G) A control pCMI2>>LhG4 plant. (H) Root development is inhibited in a pCMI2>>GFP-ICR1 plant (left) and restored by coexpression of GFP-ICR1 and mRFP-CMI1 in pCMI2>>GFP-ICR1/mRFP-CMI1 plants (right). (I) mRFP-CMI1 is expressed in the lateral root meristem QC and initial cells and accumulates in the cytoplasm and nuclei in pCMI1>>mRFP-CMI1 plants. (J-L) GFP-ICR1 and mRFP-CMI1 are colocalized in the cytoplasm in a pCMI2>>GFP-ICR1/mRFP-CMI1 lateral root initial. Note the absence of mRFP-CMI1 from nuclei. Scale bars 0.5 mm (A, B, G and H), 50 μm (C-F), and 50 μm (I-L). CMI1, Ca2+-dependent modulator of ICR1; Col-0, Arabidopsis Columbia-0; GFP, green fluorescent protein; ICR1, interactor of constitutively active ROP; mRFP, monomeric red fluorescent protein; QC, quiescent center; WT, wild type.
Fig 6
Fig 6. CMI1 specifically interacts with ICR1 in a Ca2+-dependent fashion.
(A) CMI1 interacts with ICR1 but not with ICR2 or ICR4 in yeast two-hybrid assays. (B) Protein immunoblot decorated with anti polyHis-tag monoclonal antibodies showing that coimmunoprecipitation of His-CMI1 and His-ICR1 is Ca2+-dependent. (C) ICR1 interacts with CMI1 but not with the cmi1D85N Ca2+ nonbinding mutant in yeast two-hybrid assays. CMI1, Ca2+-dependent modulator of ICR1; ICR, interactor of constitutively active ROP; -LT, Leu-, Trp-deficient medium; -LTH, Leu-, Trp-, His-deficient medium.
Fig 7
Fig 7. CMI1 changes secondary structure in free Ca2+ concentration ranging between 10−9 and 10−8 M and is a monomer in solution.
(A and B) CD spectra of 60 μM CMI1 at indicated free Ca2+ concentrations. Each curve is labeled as per legends. Measurements presented in (A and B) were carried out on different days. (C and D) Percentage of α-helix of CMI1 at different free Ca2+ concentrations calculated from the CD spectra in (A and B), respectively. (E) An SEC-MALS elution profile of 4 μg CMI1 in 2 mM Ca2+ solution. CMI1 eluted as a single peak with a molecular mass (red line) corresponding to a monomeric form. Underlying data for this figure can be found in S1 Data. CD, circular dichroism; CMI1, Ca2+-dependent modulator of ICR1; ICR, interactor of constitutively active ROP; M, million; MRE, mean residue ellipticity; SEC-MALS, size-exclusion chromatography multiangle light scattering.
Fig 8
Fig 8. Interaction between CMI1 and ICR1 requires a hydrophobic pocket in CMI1 and a C-terminal W338 residue in ICR1.
(A and B) A homology model of CMI1 with the CBD of KCBP shown in magenta. (A) A surface representation of CMI1 with residues of the hydrophobic pocket highlighted in yellow. (B) A close-up displaying CMI1 Leu residues L59, 92, and 100 (green) interacting with a Trp residue in KCBP CBD (magenta). (C-E) Yeast two-hybrid assays. (C) ICR1 did not interact with CMI1 hydrophobic pocket L59, L92, and L100 mutants. (D) ICR1 44 C-terminal residues are required and sufficient for interaction with CMI1, but interactions are detected also at 1:104 dilution with icr1-151-344 C-terminal or longer fragments. (E) ICR1 Trp residue W338 but not W266 is required for the interaction between CMI1 and ICR1. (C-E) Numbers above panels denote dilutions of the yeast cells. CBD, calmodulin-binding domain; CMI1, Ca2+-dependent modulator of ICR1; ICR, interactor of constitutively active ROP; KCBP, kinesin-like CaM-binding protein; -LT, Leu-, Trp-deficient medium; -LTH, Leu-, Trp-, His-deficient medium.
Fig 9
Fig 9. Recruitment of CMI1 by ICR1 to MTs depends on Ca2+ binding and intact hydrophobic pocket of CMI1 and ICR1 W338.
(A-I) CMI1, but not Ca2+ nonbinding cmi1D85N and hydrophobic pocket cmi1L59A, mutants is recruited to MTs by ICR1. (J-L) icr1W338A is associated with MTs but does not recruit CMI1. Each panel is as per legends. Bar, 20 μm for all panels. CMI1, Ca2+-dependent modulator of ICR1; ICR, interactor of constitutively active ROP; MT, microtubule; O/L-overlay of mCherry and GFP signals.

References

    1. Leyser O. Auxin Signaling. Plant Physiol. 2018;176(1):465–79. 10.1104/pp.17.00765 - DOI - PMC - PubMed
    1. Efroni I, Mello A, Nawy T, Ip PL, Rahni R, DelRose N, et al. Root Regeneration Triggers an Embryo-like Sequence Guided by Hormonal Interactions. Cell. 2016;165(7):1721–33. 10.1016/j.cell.2016.04.046 - DOI - PMC - PubMed
    1. Friml J, Vieten A, Sauer M, Weijers D, Schwarz H, Hamann T, et al. Efflux-dependent auxin gradients establish the apical-basal axis of Arabidopsis. Nature. 2003;426(6963):147–53. 10.1038/nature02085 . - DOI - PubMed
    1. Sabatini S, Beis D, Wolkenfelt H, Murfett J, Guilfoyle T, Malamy J, et al. An auxin-dependent distal organizer of pattern and polarity in the Arabidopsis root. Cell. 1999;99(5):463–72. 10.1016/s0092-8674(00)81535-4 . - DOI - PubMed
    1. Weijers D, Wagner D. Transcriptional Responses to the Auxin Hormone. Annu Rev Plant Biol. 2016;67:539–74. 10.1146/annurev-arplant-043015-112122 . - DOI - PubMed

Publication types

MeSH terms