. 2019 Jul 10;26(1):73-85.e4.
doi: 10.1016/j.chom.2019.06.005.

The Landscape of Persistent Viral Genomes in ART-Treated SIV, SHIV, and HIV-2 Infections

Affiliations

The Landscape of Persistent Viral Genomes in ART-Treated SIV, SHIV, and HIV-2 Infections

Alexandra M Bender et al. Cell Host Microbe. .

Abstract

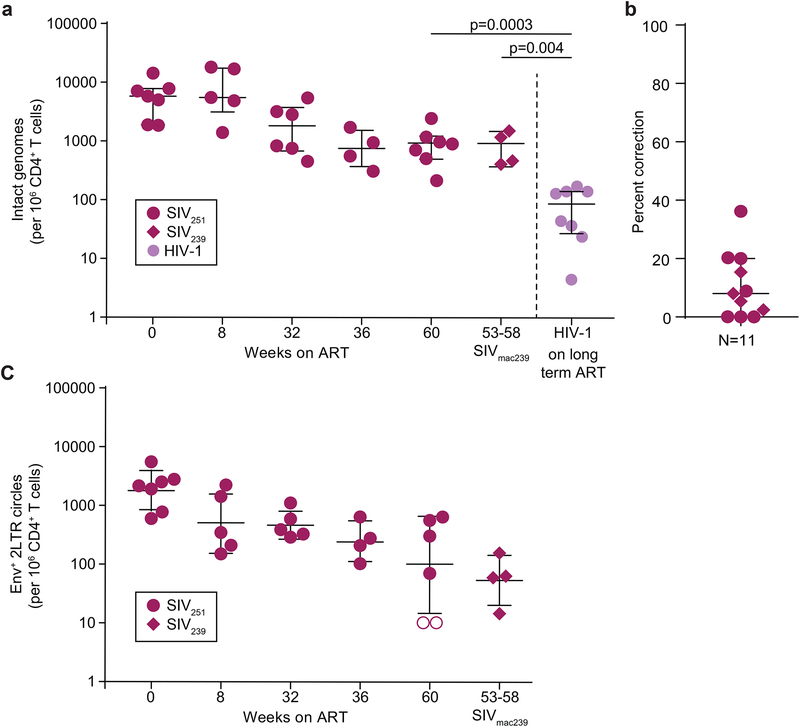
Evaluation of HIV cure strategies is complicated by defective proviruses that persist in ART-treated patients but are irrelevant to cure. Non-human primates (NHP) are essential for testing cure strategies. However, the persisting proviral landscape in ART-treated NHPs is uncharacterized. Here, we describe viral genomes persisting in ART-treated, simian immunodeficiency virus (SIV)-infected NHPs, simian-human immunodeficiency virus (SHIV)-infected NHPs, and humans infected with HIV-2, an SIV-related virus. The landscapes of persisting SIV, SHIV, and HIV-2 genomes are also dominated by defective sequences. However, there was a significantly higher fraction of intact SIV proviral genomes compared to ART-treated HIV-1 or HIV-2 infected humans. Compared to humans with HIV-1, SIV-infected NHPs had more hypermutated genomes, a relative paucity of clonal SIV sequences, and a lower frequency of deleted genomes. Finally, we report an assay for measuring intact SIV genomes which may have value in cure research.

Keywords: HIV-2; SHIV; SIV; clonal expansion; defective provirus; latent reservoir.


Conflict of interest statement

Declaration of interests

Aspects of HIV-1 IPDA are subject of a patent application PCT/US16/28822 filed by Johns Hopkins University. K.M.B. and R.F.S. are inventors on this application. Accelevir Diagnostics holds an exclusive license for this patent application. G.M.L. is an employee of and shareholder in Accelevir Diagnostics. R.F.S. holds no equity interest in Accelevir Diagnostics. R.F.S is a consultant on cure-related HIV research for Merck and Abbvie.

Figures

Fig. 1.
Fig. 1.. Landscape of SIV genomes persisting in treated macaques is dominated by defective sequences.
(a) Time line of infection, treatment and sampling. Animals were infected with SIVmac251 for 95 weeks (red) before ART (blue box). All animals achieved and maintained suppression of viremia to <50 copies/ml of SIV RNA by week 20 of ART (dark blue box). Small arrows indicate sampling times. Samples for near full genome sequencing were obtained 36 weeks after ART initiation (red arrow). (b) Method for near full length, single genome analysis. Positions of PCR amplicons are shown in relation to a map of the SIV genome (top). See Methods for details, (c) Individual genomes from treated animals. Each horizontal bar represents a single genome. 221 genomes for which >1 inner PCR reaction was positive are shown. An additional 46 genomes were detected by near full genome length outer and nested gag inner PCR, but could not be fully sequenced due to large unmapped deletions (n=32) and/or extensive hypermutation (n=14). (d) Number of genomes with the indicated types of defects in each animal, (e) Comparison of 267 SIV sequences from 7 animals and 152 previously published (Bruner et al., 2016) HIV-1 proviral sequences from 10 individuals initiating ART during chronic infection. Significant differences between SIV and HIV-1 in the fraction of different categories of genomes are indicated (**, P < 0.01; ****, P < 0.0001). (f) Comparison of the average time periods of infection and ART between the SIV-infected macaques studied here and HIV-1-infected patients analyzed by Bruner et al., 2016.
Fig. 2.
Fig. 2.. Deletions in the SIV genome.
(a) SIV genome and outer PCR amplicon used for near full genome sequencing, (b) Position of deletions. Each horizon line represents a mapped deletion. The 5’ and 3’ ends of the deletion are indicated by blue and red boxes respectively. Also shown are the maximum and minimum possible sizes of deletions in 32 genomes for which only the inner gag PCR was positive (gag only), (c) Histograms indicating the relative frequency of sequences with deletions with 5’ and 3 ’ boundaries at the indicated positions in the genome. It is not clear if any deletions extend into the 5’ LTR, although this is not expected based on the mechanism of reverse transcription, (d) Examples of regions of homology at the deletion junctions for genomes with a very large internal deletion (E11.11H12), a 3’ deletion (E14B11), and a 5’ deletion (E16HF10).
Fig. 3.
Fig. 3.. Hypermutation in SIV infection.
(a) Maps of hypermutated SIV genomes. Vertical slashes indicate positions of G→A mutations that are not present in non-hypermutated genomes from the same animals. Hypermutated genomes with unmapped deletions are not shown. Boxed area is expanded to show individual sites of mutation, (b) Extent of hypermutation at individual positions in hypermutated genomes. Vertical bars indicate the fraction of hypermutated genomes with a G→A mutation at the indicated genomic positions. Values are normalized for deletions and missing sequence. cPPT, central polypurine track, (c) Fraction of sequenced positions in individual hypermutated genomes at which a G in the reference sequence is mutated to A. (d) Histograms showing the fraction of hypermutated SIV (top) and HIV-1 (bottom) genomes with the indicated level of hypermutation expressed as the fraction of G’s mutated to A. Mutation was assessed relative to non-hypermutated sequences from the same infected animal or patient. Fractions are normalized for deletions and missing sequence. For SIV, 86 genomes from 7 treated animals were analyzed. For HIV-1, 47 sequences from 9 patients treated during chronic infection (Bruner et al., 2016) were included, (e) Context of SIV hypermutation. Fraction of genomes with statistically confirmed hypermutation in the sense strand context GG→AG or GA→AA. (f) Sequence context of individual G→A mutations in hypermutated SIV genomes.
Fig. 4.
Fig. 4.. Identical sequences in SIVmac infection.
(a) Phylogenetic tree of SIV env sequences obtained by near full-genome sequencing from 7 treated animals infected with SIVmac251 and sampled 36 weeks after ART initiation and the SIVmac251 reference sequence (black square). Sequence analysis includes 2044 nt. Hypermutated sequences from each animal clustered together due to commonly mutated positions, (b) Composite phylogenetic tree of env sequences obtained by full-genome sequencing and env SGA along with SIVmac251 stock sequences (yellow diamonds) and the SIVmac251 reference sequence (black square). Hypermutated sequences were omitted. Two pairs of identical sequences potentially representing expanded cellular clones were identified (arrows). Three identical sequences from animal DEKW are intermingled with the stock sequences and may represent infection of multiple cells with the same variant present in the stock, (c) Tree of env sequences from full-genome sequencing on CD4+T cells from a rhesus macaque treated with ART 2 weeks after infection with SIVmac251 and sampled after 19 weeks of treatment. (d) Tree of env sequences from SGA on CD4+ T cells from 2 rhesus macaques treated with ART 6 weeks after infection with SIVmac239 and sampled after 120 weeks of treatment, (e) Representative phylogenetic tree of env sequences obtained by SGA from animal KIC at multiple time points. Arrows indicated identical sequences, (f) Root-to-tip distances for the phylogenetic trees shown in (e), calculated using the stock consensus sequence (top) or the week 8 consensus (bottom) at the root. Data for animal KIC are shown here. Similar plots for animals DEAB, PZB, and DEKW are shown in Fig. S3e–g. (g) Relationship between fraction of clonal sequences and time on ART. Data are from studies using env SGA to analyze viral genomes in SIV-infected macaques (colored symbols) or HIV-1-infected patients on ART for the indicated times. HIV-1 data are from published studies (Bailey et al., 2006; Bar et al., 2016; Bruner et al., 2016; Wang et al., 2018).
Fig. 5.
Fig. 5.. HIV-2 and SHIV genomes that persist in the setting of ART are largely defective.
(a) Maps of genomes amplified from PBMC of three individuals with treated HIV-2 infection. Arrows indicate positions of outer primers used in near full genome amplification. Mapping strategy and primer sequences are in described in Fig. S6a and Table S1, respectively. Of 41 genomes, 8 had deletions that could not be precisely mapped due to large deletions affecting multiple inner PCRs and are not shown, (b) Maps of SHIV genomes from treated macaques. Arrows indicate positions of outer primers used in near full genome amplification. Mapping strategy and primer sequences are in described in Fig. S6b and Table S1, respectively. Of 131 genomes analyzed, 49 gave bands only with the gag inner PCR. These were considered to have unmapped deletions and are not shown, (c) Summary of the frequency of intact and defective genomes persisting in the setting of ART for HIV-1, HIV-2, SIV, and SHIV. Data for HIV-1 are from Bruner et al. 2016. (d) Fraction of intact proviruses for HIV-1, HIV-2, SIV, and SHIV. Significance of differences was determined by multiple unpaired T tests corrected for multiple comparisons using the Holm-Sidak method (**, p ≤ 0.01; ****, p ≤ 0.0001).
Fig. 6.
Fig. 6.. ddPCR assay for intact SIV genomes.
(a) Sliding window analysis of optimal amplicon positioning to detect deletions. Optimal discrimination between intact and deleted sequences is obtained with a 5’ pol amplicon (blue arrow) and a 3’ env amplicon in (green arrow). Colors in grid indicate fraction of deleted genomes correctly identified as defective based on overlap of the indicated 5’ and/or 3’ amplicons and mapped deletions. Based on 267 independent near full genome sequences including 64 that contain mapped deletions, (b) Schematic of ddPCR assay output. Types of genomes detected in each quadrant are indicated. Many defective SIV genomes fail to amplification with either primer set and are present in quadrant 3 (Q3) along with droplets containing no SIV DNA. (c) Representative dot plot from analysis of CD4+ T cells from a treated macaque, (d) Bioinformatic comparison of standard SIV gag PCR (Gama et al., 2017) and the ddPCR assay for intact SIV genomes with respect to % of genomes amplified, % of defective genomes excluded, and % of amplified genomes that are intact. Based on 267 near full genome sequences from treated macaques (Fig. 1). (e) DNA shearing index (DSI) for representative study samples. Samples with high DSI (>25%) were excluded from further analysis. Bars show mean ± SD. (f) Position of amplicons used in ddPCR assay for 2LTR circles. Droplets are analyzed for the 2LTR junction and either pol or env. The pol and env amplicons are the same as those in a. (g) Representative 2LTR assay using on DNA from a treated macaque. A minority of the viral genomes detected are circles (Q1 and Q2), and some of the circles have 3’ deletions (Q1). Similar assays using the pol as the second amplicon give similar results as expected based on the distribution of mapped deletions, (h) 2LTR circles in treated SIV and HIV-1 infection. Total 2LTR circles (Q1+Q2) were measured in the infected macaques describe above after ~1 year of ART. Previous measurements (Bruner et al., 2016) of 2LTR circles in HIV-1 infected patients on long term ART are shown for comparison, (i) The fraction of double positive SIV 2LTR circles for the animals shown in g.
Fig. 7.
Fig. 7.. Frequency of cells with intact SIV genomes.
(a) Frequency of intact SIV genomes in longitudinal samples before and after initiation of ART. Intact SIV DNA levels from the latest available time point (~1 year of ART) are compared to intact HIV-1 DNA in patients on long term ART (Bruner et al., 2019). The frequencies have been corrected for double positive 2-LTR circles. Bars on graphs represent median and interquartile range, (b) Percentage of 2-LTR correction. The frequency of 2 LTR circles retaining internal env or pol regions was used to correct intact DNA copies measured by ddPCR. Bars on graphs represent median and interquartile range, (c) Decay of double positive 2-LTR circles in animais on ART. Bars represent geometric mean and standard deviation.

Comment in

Similar articles

Cited by

References

    1. Ambrose Z, Palmer S, Boltz VF, Kearney M, Larsen K, Polacino P, Flanary L, Oswald K, Piatak M Jr, Smedley J, et al. (2007). Suppression of viremia and evolution of human immunodeficiency virus type 1 drug resistance in a macaque model for antiretroviral therapy. J. Virol 81, 12145–12155. - PMC - PubMed
    1. Archin NM, Liberty AL, Kashuba AD, Choudhary SK, Kuruc JD, Crooks AM, Parker DC, Anderson EM, Kearney MF, Strain MC, et al. (2012). Administration of vorinostat disrupts HIV-1 latency in patients on antiretroviral therapy. Nature 487, 482–485. - PMC - PubMed
    1. Bailey JR, Sedaghat AR, Kieffer T, Brennan T, Lee PK, Wind-Rotolo M, Haggerty CM, Kamireddi AR, Liu Y, Lee J, et al. (2006). Residual human immunodeficiency virus type 1 viremia in some patients on antiretroviral therapy is dominated by a small number of invariant clones rarely found in circulating CD4+ T cells. J. Virol 80, 6441–6457. - PMC - PubMed
    1. Balzarini J, Weeger M, Camarasa MJ, De Clercq E, and Liberia K (1995). Sensitivity/resistance profile of a simian immunodeficiency virus containing the reverse transcriptase gene of human immunodeficiency virus type 1 (HIV-1) toward the HIV-1-specific non-nucleoside reverse transcriptase inhibitors. Biochem. Biophys. Res. Commun 211, 850–856. - PubMed
    1. Bar KJ, Sneller MC, Harrison LJ, Justement JS, Overton ET, Petrone ME, Salantes DB, Seamon CA, Scheinfeld B, Kwan RW, et al. (2016). Effect of HIV Antibody VRC01 on Viral Rebound after Treatment Interruption. N. Engl. J. Med 375, 2037–2050. - PMC - PubMed

Publication types

MeSH terms

Substances

LinkOut - more resources