. 2019 Jul 10;11(7):635.
doi: 10.3390/v11070635.

Immune Responses in the Eye-Associated Lymphoid Tissues of Chickens after Ocular Inoculation with Vaccine and Virulent Strains of the Respiratory Infectious Laryngotracheitis Virus (ILTV)

Affiliations

Immune Responses in the Eye-Associated Lymphoid Tissues of Chickens after Ocular Inoculation with Vaccine and Virulent Strains of the Respiratory Infectious Laryngotracheitis Virus (ILTV)

Gabriela Beltrán et al. Viruses. .

Abstract

Infectious laryngotracheitis (ILT) is an acute respiratory disease of poultry caused by infectious laryngotracheitis virus (ILTV). Control of the disease with live attenuated vaccines administered via eye drop build upon immune responses generated by the eye-associated lymphoid tissues. The aim of this study was to assess cytokine and lymphocyte changes in the conjunctiva-associated lymphoid tissues (CALT) and Harderian gland (HG) stimulated by the ocular inoculation of the ILTV chicken embryo origin (CEO) vaccine strain and virulent strain 63140. This study offers strong evidence to support the roles that the CALT and HG play in the development of protective ILTV immune responses. It supports the premise that ILTV-mediated immunomodulation favors the B cell response over those of T cells. Further, it provides evidence that expansions of CD8α+ cells, with the concomitant expression of the Granzyme A gene, are key to reducing viral genomes in the CALT and halting ILTV cytolytic replication in the conjunctiva. Ultimately, this study revealed that the early upregulation of interleukin (IL)-12p40 and Interferon (IFN)-γ cytokine genes, which shape the antigen-specific cell-mediated immune responses, retarded the decline of virus replication, and enhanced the development of lesions in the conjunctiva epithelium.

Keywords: Granzyme A; Harderian gland (HG); Interferon-γ gene; conjunctiva-associated lymphoid tissue (CALT); infectious laryngotracheitis virus (ILTV); interferon gamma; interleukin-12p40 gene; viral genome load.


Conflict of interest statement

The authors declare no conflict of interest.

Figures

Figure 1
Figure 1
Gating strategy of the lymphocyte population. Primary gating was based on size consistency and single cell using forward scatter height versus forward scatter area (FSC-H vs. FSC-A) (a) and subjected to CD45 assessment (b). Representative flow cytometric forward-angle and right-angle scatter (FSC-A vs. SSC-A) gated on only CD45+ cells were used to identify the lymphocyte population (c). The CD45+ lymphocytes population was subjected to CD4+ and CD8α+ (d), IgM+ and IgA+ (e), MHCI+ and MHCIIHi+ (f) assessment.
Figure 2
Figure 2
Mean clinical sign scores (CSSs) and mean genome load (Log10 2−ΔΔCt) of the chicken embryo origin (CEO) vaccine strain and 63140 virulent strain in the conjunctiva-associated lymphoid tissue (CALT), Harderian gland (HG) and trachea. (a) Mean clinical sign scores recorded from 2 to 7 dpi (n = 6 to 7). Mean clinical sign scores are indicated by geometrical symbols. Mean viral genome load in CALT (b), HG (c), and trachea (d) measured at 1, 3, 5, 7 and 9 dpi. The bars represent the mean viral genome load and the vertical lines indicate the standard deviation for each tissue. Significant differences in viral genome load were measured between strains on the basis of the tissue assessed at each time point as are indicated (* p ≤ 0.0332, ** p ≤ 0.0021).
Figure 3
Figure 3
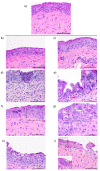
Photomicrographs of conjunctiva epithelium collected from the CEO vaccine strain- and virulent 63140 strain-inoculated chickens. Conjunctiva sections from the mock-inoculated group (a), from CEO vaccine strain-inoculated chickens collected at 1 (b), 3 (d), 5 (f), and 7 (h) dpi and from 63140-inoculated chickens collected at 1 (c), 3 (e), 5 (g), and 7 (i) days post-inoculation. Evidence of infectious laryngotracheitis virus (ILTV) lytic replication; syncytia cell formation with eosinophilic intranuclear inclusion bodies are indicated in insets within the photomicrograph.
Figure 4
Figure 4
Percentages of IgM+, MHCI+/MHCIIHi+ and IgA+ cells in the conjunctiva-associated lymphoid tissue (CALT) and Harderian gland (HG) of chickens inoculated with the CEO vaccine strain and virulent 63140 strain. Percentage of IgM+ (a,d), MHCI+/MHCIIHi+ (b,e), and IgA+ (c,f) cells in CALT 1 to 9 days post-CEO (ac) and 63140 (df) inoculation. The one-way analysis of variance Kruskal–Wallis test and the Dunn´s multiple comparison post-test (p ≤ 0.05) were performed to individually compare IgM+, IgA+ and MHCI+/MHCIIHi+ percentages in CALT and HG for mock-, CEO-, and 63140-inoculated groups. The mean percentage is indicated by bars and vertical lines represent the standard deviation (SD). Significant increase in IgM+, MHCI+/MHCIIHi+, and IgA+ cells is indicated by (**), and significant decrease by (*) (p ≤ 0.05).
Figure 5
Figure 5
Percentages of CD4+ and CD8α+ cells in the conjunctiva-associated lymphoid tissue (CALT) and Harderian gland (HG) of chickens inoculated with the CEO vaccine strain and 63140 virulent strain. Percentage of CD4+ in CALT (a) and in HG (b); percentage of CD8+ in CALT (c) and HG (d) from 1 to 9 days post-CEO and 63140 inoculation. The one-way analysis of variance, Kruskal–Wallis test and the Dunn´s multiple comparison post-test (p ≤ 0.05) were performed to individually compare CD4+ and CD8α+ cell percentages in CALT and HG for the mock-, CEO,- and 63140-inoculated groups. The mean percentage is indicated by bars and vertical lines represent the standard deviation (SD). Significant increase in CD4+ and CD8α+ cells is indicated by (**), and significant decrease by (*) (p ≤ 0.05).
Figure 6
Figure 6
Transcription of the Granzyme A gene in relation to genome viral load in the conjunctiva-associated lymphoid tissue (CALT). Individual median fold change (log10 2−ΔΔCt) transcription of the Granzyme A gene in the CALT of 63140 (a) and CEO (b) groups are presented in the y right axis (open square), with the median represented as the horizontal line and the 95% confident interval as the vertical line. Individual mean genome load (log10 2−ΔΔCt) in the CALT of 63140 (a) and CEO (b) groups are presented in the y left axis (open circle), with the mean represented by the horizontal line and the standard deviation as the vertical line. Pearson correlation between Granzyme A expression and genome load from 3 to 9 dpi were determined for CALT/63140 (c) and CALT/CEO (d). Pearson correlation and linear regression analysis for x = Granzyme A gene expression and y = viral genome load was performed for 63140 (c) and CEO (d) groups. Correlation coefficient (r) and p values are presented.
Figure 7
Figure 7
Transcription of the Granzyme A gene in relation to genome viral load in the Harderian gland (HG). Individual median fold change (log10 2−ΔΔCt) transcription of the Granzyme A gene in the HG of 63140 (a) and CEO (b) groups are presented in the y right axis (open square), with the median represented as the horizontal line and the 95% confident interval as the vertical line. Individual mean genome load (log10 2−ΔΔCt) in the CALT of 63140 (a) and CEO (b) groups are presented in the y left axis (open circle), with the mean represented by the horizontal line and the standard deviation as the vertical line.
Figure 8
Figure 8
The transcription of IL-12p40 and IFN-γ genes in conjunctiva-associated lymphoid tissue (CALT) and Harderian gland of chickens inoculated via the ocular route with CEO vaccine strain and virulent 63140 strain. The median fold change (log10 2−ΔΔCt) for IL-12p40 transcription in the CALT (a) and in the HG (c), and transcription of the IFN-γ gene in the CALT (b) and HG (d) are presented as the median (bars) with 95% confident interval (lines). Differences in median fold changes for IL-12p40 and IFN-γ between CEO and 63140 groups were determined by non-parametric Mann–Whitney U test (p ≤ 0.05). Significant increase (p ≤ 0.05) is indicated by (**).

Similar articles

Cited by

References

    1. García M., Spatz S., Guy J. Infectious laryngotracheitis. In: Swayne D.E., Glisson J.R., McDougland L.R., Nolan L.K., Suarez D.L., Nair V.L., editors. Diseases of Poultry. 13th ed. Wiley-Blackwell; Ames, IA, USA: 2013. pp. 161–179.
    1. Gelenczei E.F., Marty E.W. Strain stability and immunologic characteristics of a tissue-culture-modified infectious laryngotracheitis virus. Avian Dis. 1965;9:44–56. doi: 10.2307/1587792. - DOI - PubMed
    1. Samberg Y., Cuperstein E., Bendheim U., Aronovici I. The development of a vaccine against avian infectious laryngotracheitis. IV. Immunization of chickens with a modified laryngotracheitis vaccine in the drinking water. Avian Dis. 1971;15:413–417. doi: 10.2307/1588714. - DOI - PubMed
    1. Gelenczei E.F., Marty E.W. Studies on a tissue-culture-modified infectious laryngotracheitis virus. Avian Dis. 1964;8:105–122. doi: 10.2307/1587827. - DOI - PubMed
    1. Fulton R.M., Schrader D.L., Will M. Effect of route of vaccination on the prevention of infectious laryngotracheitis in commercial egg-laying chickens. Avian Dis. 2000;44:8–16. doi: 10.2307/1592502. - DOI - PubMed

Publication types

MeSH terms