. 2019 Jul;12(7):e009063.
doi: 10.1161/CIRCIMAGING.119.009063. Epub 2019 Jul 12.

Noninvasive In Vivo Quantification of Adeno-Associated Virus Serotype 9-Mediated Expression of the Sodium/Iodide Symporter Under Hindlimb Ischemia and Neuraminidase Desialylation in Skeletal Muscle Using Single-Photon Emission Computed Tomography/Computed Tomography

Affiliations

Noninvasive In Vivo Quantification of Adeno-Associated Virus Serotype 9-Mediated Expression of the Sodium/Iodide Symporter Under Hindlimb Ischemia and Neuraminidase Desialylation in Skeletal Muscle Using Single-Photon Emission Computed Tomography/Computed Tomography

Nabil E Boutagy et al. Circ Cardiovasc Imaging. 2019 Jul.

Abstract

Background: We propose micro single-photon emission computed tomography/computed tomography imaging of the hNIS (human sodium/iodide symporter) to noninvasively quantify adeno-associated virus 9 (AAV9)-mediated gene expression in a murine model of peripheral artery disease.

Methods: AAV9-hNIS (2×10¹¹ viral genome particles) was injected into nonischemic or ischemic gastrocnemius muscles of C57Bl/6J mice following unilateral hindlimb ischemia ± the α-sialidase NA (neuraminidase). Control nonischemic limbs were injected with phosphate buffered saline or remained noninjected. Twelve mice underwent micro single-photon emission computed tomography/computed tomography imaging after serial injection of pertechnetate (99mTcO4-), a NIS substrate, up to 28 days after AAV9-hNIS injection. Twenty four animals were euthanized at selected times over 1 month for ex vivo validation. Forty-two animals were imaged with 99mTcO4- ± the selective NIS inhibitor perchlorate on day 10, to ascertain specificity of radiotracer uptake. Tissue was harvested for ex vivo validation. A modified version of the U-Net deep learning algorithm was used for image quantification.

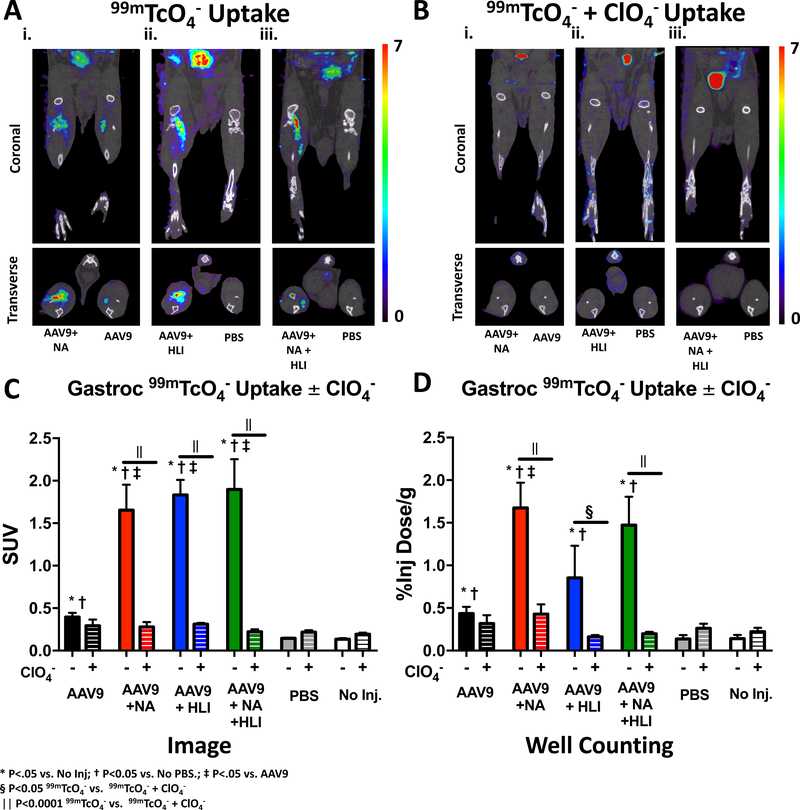
Results: As quantitated by standardized uptake value, there was a gradual temporal increase in 99mTcO4- uptake in muscles treated with AAV9-hNIS. Hindlimb ischemia, NA, and hindlimb ischemia plus NA increased the magnitude of 99mTcO4- uptake by 4- to 5-fold compared with nonischemic muscle treated with only AAV9-hNIS. Perchlorate treatment significantly reduced 99mTcO4- uptake in AAV9-hNIS-treated muscles, demonstrating uptake specificity. The imaging results correlated well with ex vivo well counting (r2=0.9375; P<0.0001) and immunoblot analysis of NIS protein (r2=0.65; P<0.0001).

Conclusions: Micro single-photon emission computed tomography/computed tomography imaging of hNIS-mediated 99mTcO4- uptake allows for accurate in vivo quantification of AAV9-driven gene expression, which increases under ischemic conditions or neuraminidase desialylation in skeletal muscle.

Keywords: animals; genetic therapy; neuraminidase; peripheral artery disease; tomography, emission computed, single-photon.


Figures

Figure 1:
Figure 1:. Schematic representation of study design and procedures.
Red numbers indicate animals with serial imaging. Red arrows indicate microSPECT/CT imaging. The blue X denotes tissue collection following euthanasia. AAV9= adeno-associated virus 9; hNIS=human sodium/ iodide symporter; HLI= Hind-limb ischemia; inj.= injection; PBS= Phosphate Buffered Saline; NA=Neuraminidase; γ=gamma; 99mTcO4= pertechnetate; ClO4=perchlorate.
Figure 2:
Figure 2:
Representative image of the volumes of interest (VOIs) of the right (red) and left (yellow) gastrocnemius muscles automatically generated on 3-dimensional micro-CT images (80 μm resolution) using a deep learning algorithm interfaced with BioImage Suite Software.
Figure 3:
Figure 3:. Validation of automated deep-learning image analysis approach.
A) Correlation between 99mTcO4 uptake values using volumes of interest (VOIs) generated by deep learning compared to manual segmented VOIs. B) Bland-Altman Plot of the agreement between these two methods. %ID/g = % injected dose per gram of tissue; SUV= standardized uptake value.
Figure 4:
Figure 4:. NIS-mediated 99mTcO4 uptake in the gastrocnemius is inhibited by perchlorate (ClO4).
A) Representative coronal and transverse microSPECT/CT images of 99mTcO4 uptake on day 10 following NA and AAV9-hNIS co-injection into the right hind-limb and injection of AAV9-hNIS alone into the left leg (i); a mouse injected with AAV9-hNIS into ischemic right hind-limb and injected with phosphate buffered saline (PBS) in left hind-limb (ii.); and a mouse injected with AAV9-hNIS + NA into ischemic right hind-limb and injected with phosphate buffered saline (PBS) in left hind-limb (iii.). B) Same as A, except that 99mTcO4 was co-administered with ClO4. C) Quantitative analysis of differences in gastrocnemius 99mTcO4 uptake derived from microSPECT/CT images in mice without (−) and with (+) co-administration of ClO4. D) Quantitative analysis of differences in gastrocnemius 99mTcO4 uptake in mice without (−) and with (+) co-administration of ClO4 derived from ex vivo gamma well counting. Image quantification and display are the same as in Figure 3. For gamma well counting, tissue activity is displayed as the ratio of gastrocnemius 99mTcO4 activity (% ID/g). * = P < 0.05 vs. no injection, †= P< 0.05 vs. PBS injection and ‡= P<0.05 vs. AA9-hNIS injection. § =P<0.05 within group difference between mean99mTcO4 gastrocnemius uptake with and without ClO4; || =P<0.0001 within group difference between mean99mTcO4 gastrocnemius uptake with and without ClO4.
Figure 5:
Figure 5:. Ischemia and neuraminidase treatments promote AAV9-driven hNIS expression.
A) Representative immunoblot of NIS protein expression. B) Densitometric quantitation of hNIS expression from all 84 muscle samples analyzed. C) Correlation between 99mTcO4 on SPECT imaging and NIS protein expression from immunoblot on day 10. * = P < 0.05 vs. no injection, † = P< 0.05 vs. PBS injection and ‡ = P<0.05 vs. AA9-hNIS injection. A.U.= arbitrary units.
Figure 6:
Figure 6:. Serial detection of increased AAV9-driven NIS expression over time using microSPECT/CT.
A) Representative coronal and transverse microSPECT/CT images of 99mTcO4 uptake in gastrocnemius muscles on days 3, 7, 10, 14 and 28 following intramuscular injection of AAV9-hNIS in a mouse that underwent unilateral surgical ischemia of the right hind-limb and had PBS delivered into the left hind-limb. Each representative image’s display scale was normalized to the injected dose and body weight and displayed as SUV. B) Time course C) Quantitative analysis of gastrocnemius 99mTcO4 uptake derived from microSPECT/CT images, and D) Correlation between 99mTcO4 uptake values using VOIs generated by the deep learning algorithm compared to ex vivo 99mTcO4 uptake values from tissue well counting. For image quantification, image activity in mCi/cc was corrected for injected dose and animal body weight, and also displayed as, SUV. * = P<0.05 vs. PBS; † = P<0.05 vs. AAV9-hNIS; ‡ P<0.05 vs. day, § P<0.01 vs. day 3, || P=0.0001 vs. day 3; # = P < 0.05 vs. day 7; ** = P< 0.05 vs. day 10 and ‡‡= P<0.05 vs. day 14.
Figure 7:
Figure 7:. Representative immunofluorescence images of the cellular distribution of hNIS and eGFP expression.
A) hNIS expression and distribution (red fluorescence) and enhanced green fluorescent protein (eGFP) expression and distribution (green fluorescence). Merged hNIS and eGFP fluorescent signals (yellow) indicating co-localization. Scale bar = 100 μm B) glucose transporter (GLUT4, red) and eGFP expression. C) CD34 (red) and eGFP expression. Merged GLUT4 and eGFP fluorescent signals (yellow) indicating co-localization. Scale bar = 20 μm

Comment in

  • New Tricks for an Aging Dog.
    Thackeray JT, Bascuñana P. Thackeray JT, et al. Circ Cardiovasc Imaging. 2019 Jul;12(7):e009452. doi: 10.1161/CIRCIMAGING.119.009452. Epub 2019 Jul 12. Circ Cardiovasc Imaging. 2019. PMID: 31296046 No abstract available.

References

    1. Ouriel K Peripheral arterial disease. The Lancet. 2001;358:1257–1264 - PubMed
    1. Benjamin EJ, Blaha MJ, Chiuve SE, Cushman M, Das SR, Deo R, de Ferranti SD, Floyd J, Fornage M, Gillespie C. Heart disease and stroke statistics—2017 update: A report from the american heart association. Circulation. 2017;135:e146–e603 - PMC - PubMed
    1. Ghosh R, Walsh S, Tang T, Noorani A, Hayes P. Gene therapy as a novel therapeutic option in the treatment of peripheral vascular disease: Systematic review and meta‐analysis. Int J Clin Pract. 2008;62:1383–1390 - PubMed
    1. Jones WS, Annex BH. Growth factors for therapeutic angiogenesis in peripheral arterial disease. Curr Opin Cardiol. 2007;22:458–463 - PubMed
    1. Boden J, Lassance-Soares RM, Wang H, Wei Y, Spiga MG, Adi J, Layman H, Yu H, Vazquez-Padron RI, Andreopoulos F, Webster KA. Vascular regeneration in ischemic hindlimb by adeno-associated virus expressing conditionally silenced vascular endothelial growth factor. J Am Heart Assoc.2016;5:1–19. - PMC - PubMed

Publication types

MeSH terms