. 2019 Jul 11;20(1):571.
doi: 10.1186/s12864-019-5953-1.

Systematic evaluation of RNA-Seq preparation protocol performance

Affiliations

Systematic evaluation of RNA-Seq preparation protocol performance

Hsueh-Ping Chao et al. BMC Genomics. .

Abstract

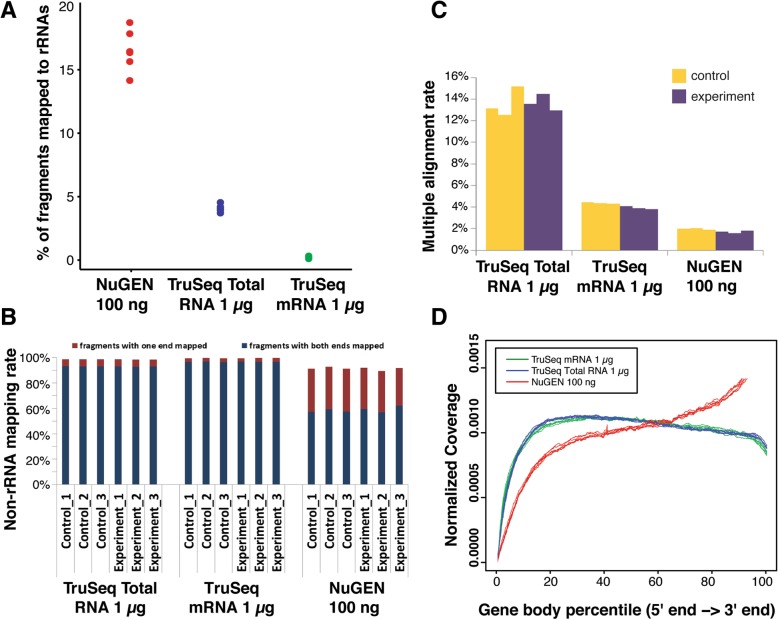
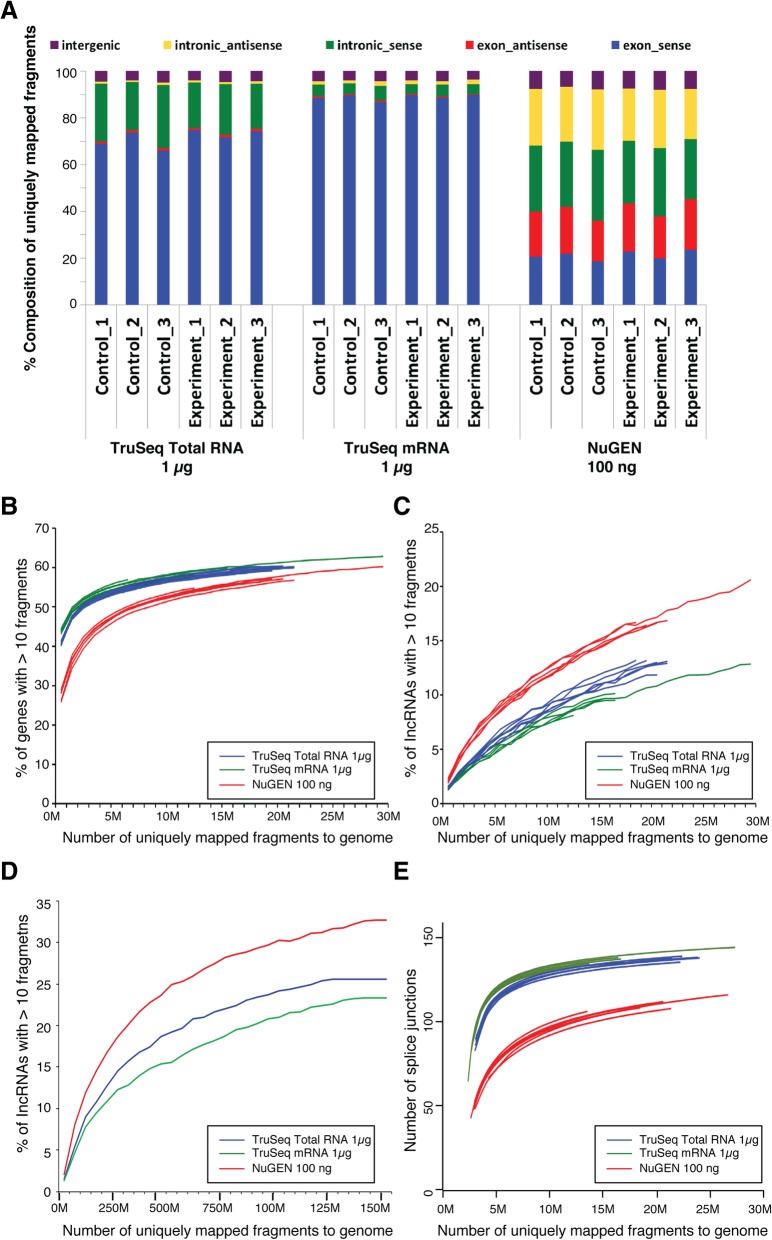
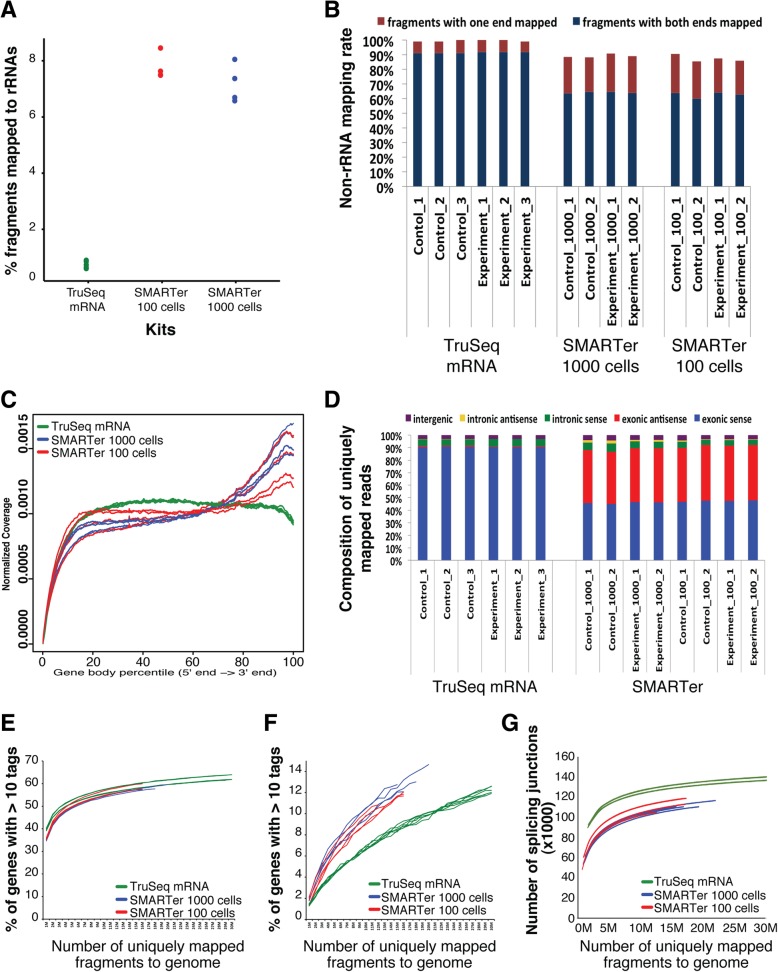
Background: RNA-Seq is currently the most widely used tool to analyze whole-transcriptome profiles. There are numerous commercial kits available to facilitate preparing RNA-Seq libraries; however, it is still not clear how some of these kits perform in terms of: 1) ribosomal RNA removal; 2) read coverage or recovery of exonic vs. intronic sequences; 3) identification of differentially expressed genes (DEGs); and 4) detection of long non-coding RNA (lncRNA). In RNA-Seq analysis, understanding the strengths and limitations of commonly used RNA-Seq library preparation protocols is important, as this technology remains costly and time-consuming.

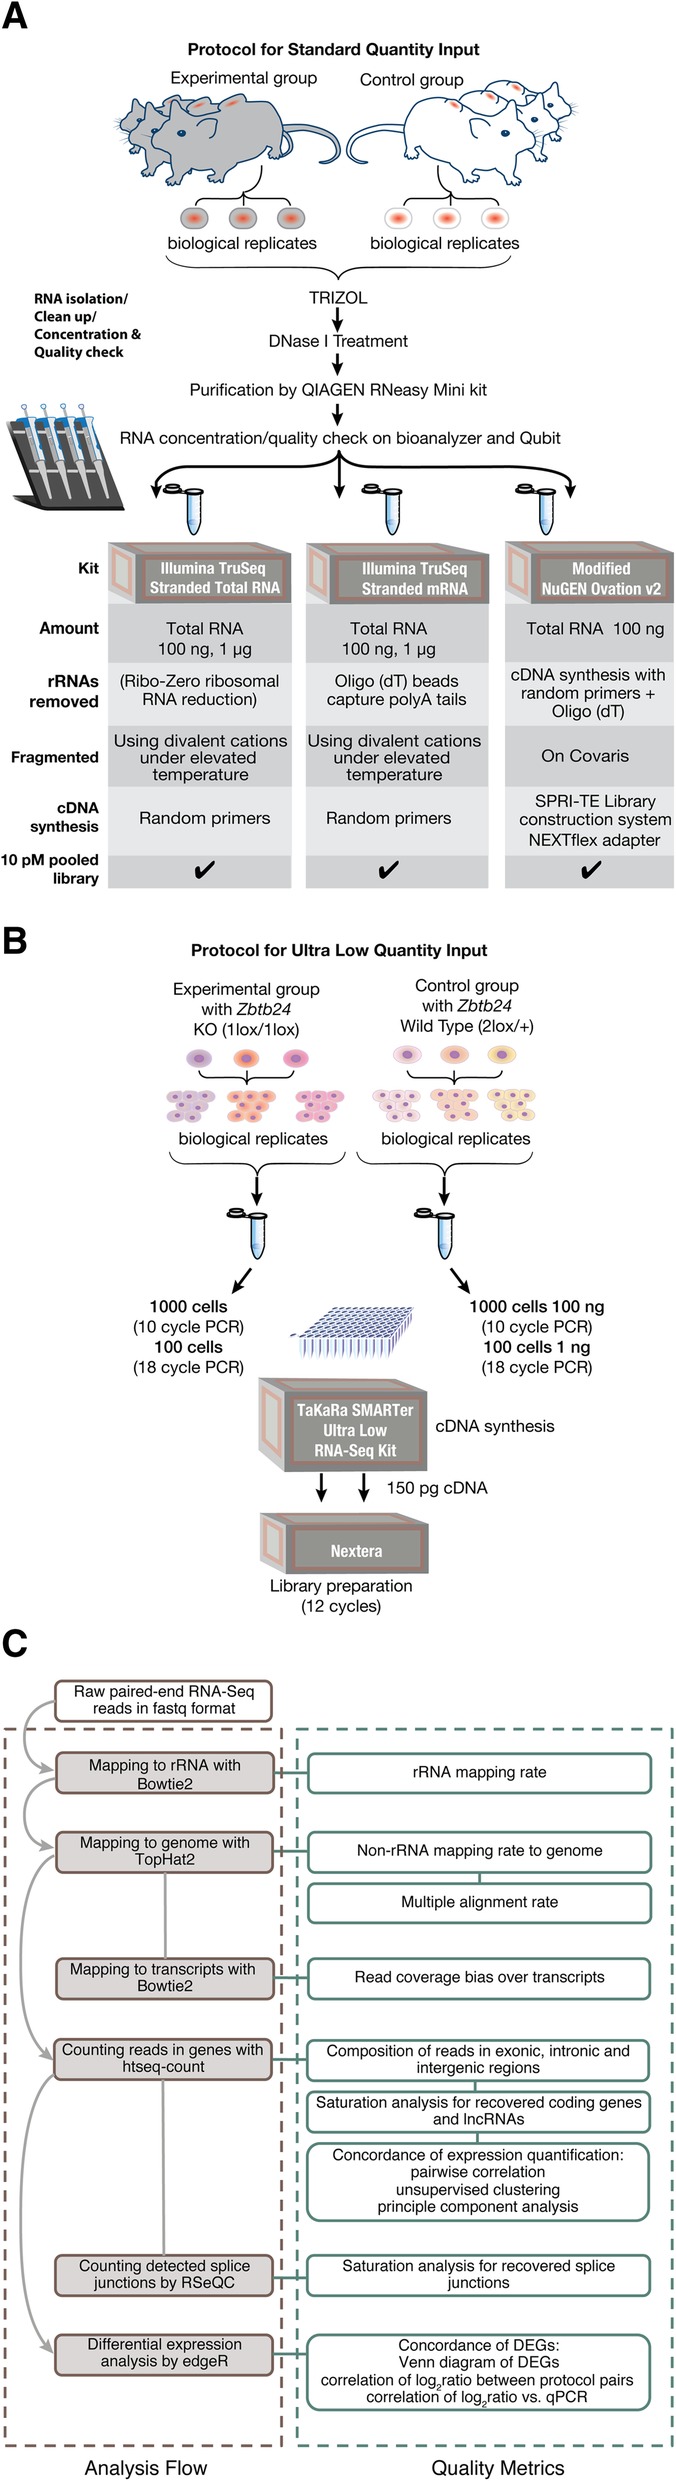
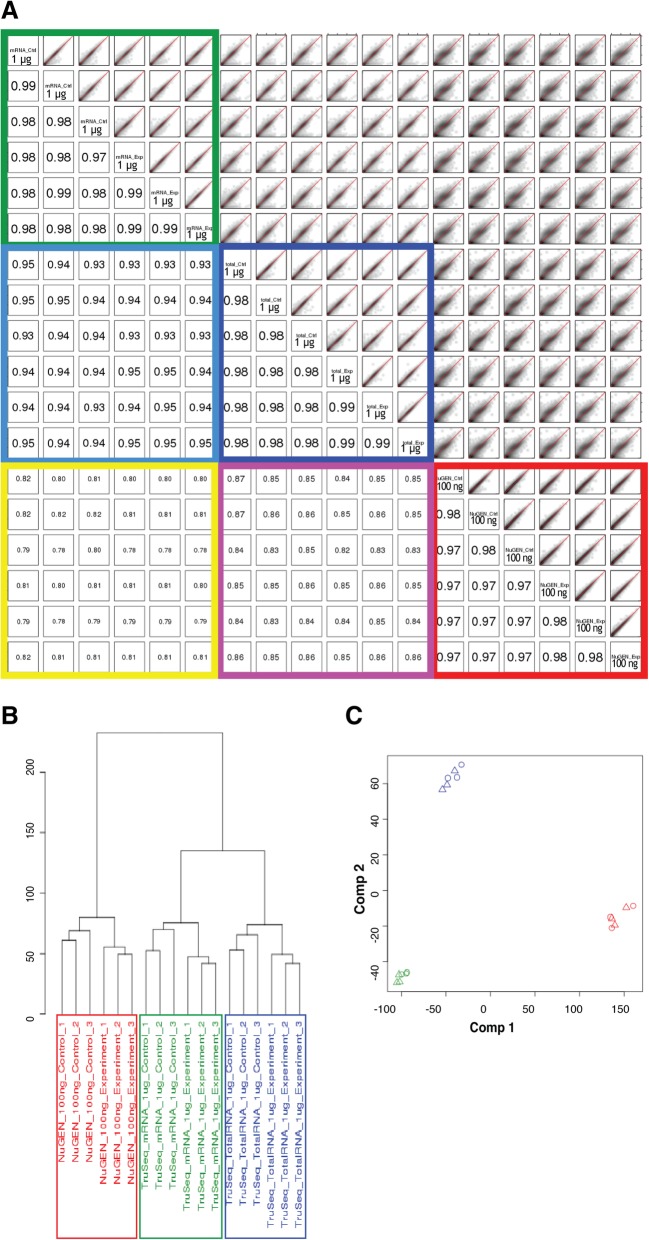
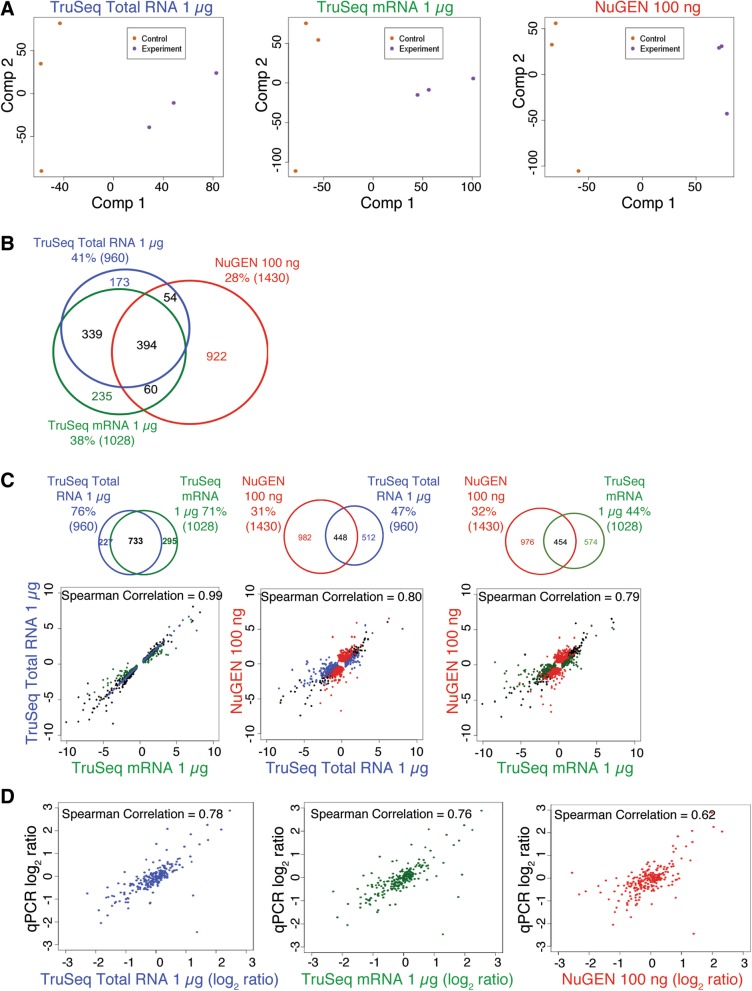
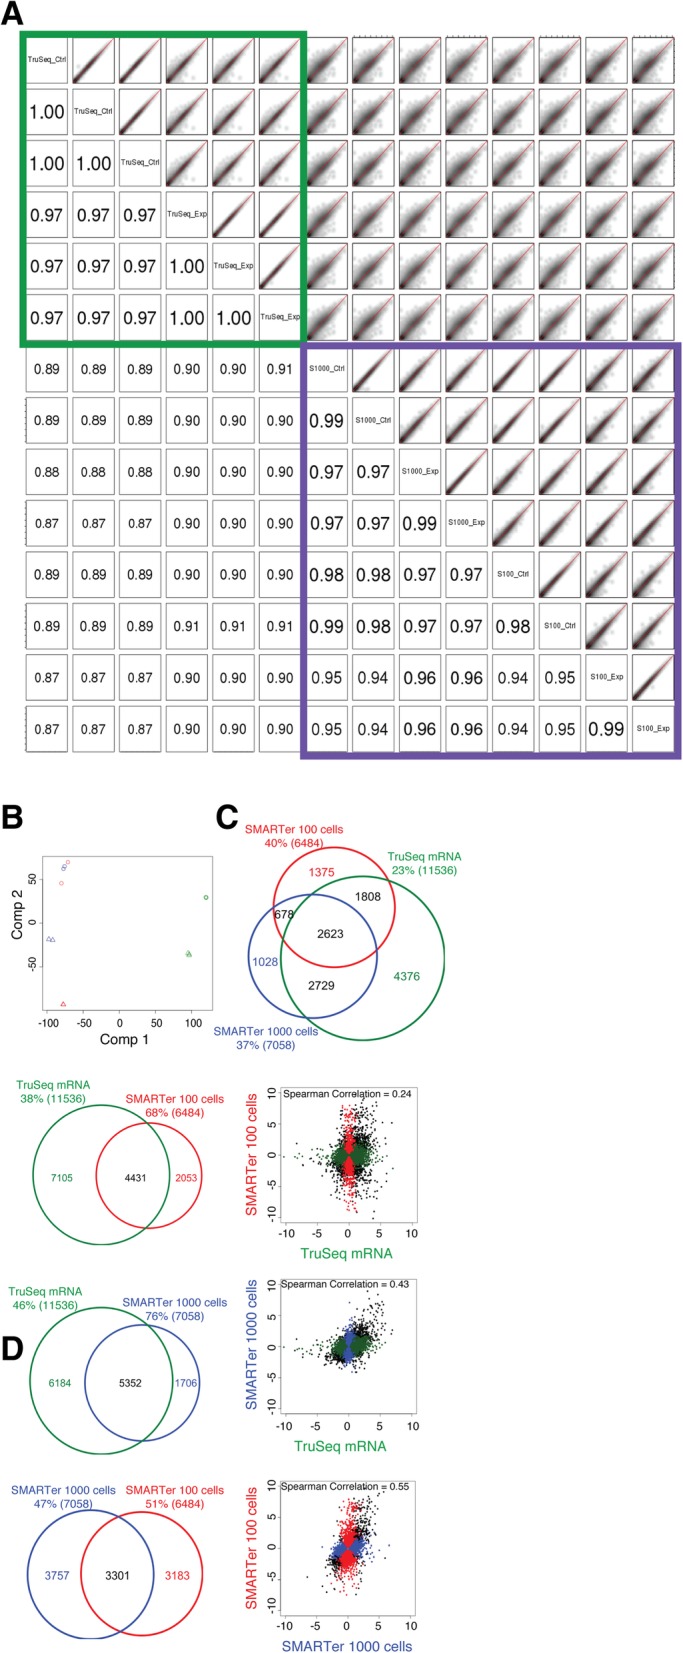
Results: In this study, we present a comprehensive evaluation of four RNA-Seq kits. We used three standard input protocols: Illumina TruSeq Stranded Total RNA and mRNA kits, a modified NuGEN Ovation v2 kit, and the TaKaRa SMARTer Ultra Low RNA Kit v3. Our evaluation of these kits included quality control measures such as overall reproducibility, 5' and 3' end-bias, and the identification of DEGs, lncRNAs, and alternatively spliced transcripts. Overall, we found that the two Illumina kits were most similar in terms of recovering DEGs, and the Illumina, modified NuGEN, and TaKaRa kits allowed identification of a similar set of DEGs. However, we also discovered that the Illumina, NuGEN and TaKaRa kits each enriched for different sets of genes.

Conclusions: At the manufacturers' recommended input RNA levels, all the RNA-Seq library preparation protocols evaluated were suitable for distinguishing between experimental groups, and the TruSeq Stranded mRNA kit was universally applicable to studies focusing on protein-coding gene profiles. The TruSeq protocols tended to capture genes with higher expression and GC content, whereas the modified NuGEN protocol tended to capture longer genes. The SMARTer Ultra Low RNA Kit may be a good choice at the low RNA input level, although it was inferior to the TruSeq mRNA kit at standard input level in terms of rRNA removal, exonic mapping rates and recovered DEGs. Therefore, the choice of RNA-Seq library preparation kit can profoundly affect data outcomes. Consequently, it is a pivotal parameter to consider when designing an RNA-Seq experiment.

Keywords: Next generation sequencing; Quality control; RNA-Seq.


Conflict of interest statement

The authors declare that they have no competing interests.

Figures

Fig. 1
Fig. 1
Experimental design and RNA-Seq data quality metrics. a Flow chart outlining the experimental design for comparing the three standard input RNA-Seq library preparation protocols. Six xenograft tumors, 3 from the control group and 3 from the experimental group, were used for all three protocols. Similar amounts of tumor tissue from control and experimental groups were used to isolate total RNA. Separate Illumina Stranded Total RNA and mRNA libraries were prepared using 100 ng and 1 μg RNA. The modified NuGEN Ovation v2 protocol library was prepared with 100 ng RNA. Images of the mice and vials were created by the Research Graphics department at MD Anderson Science Park (©MD Anderson), and the pipettes were taken from https://all-free-download.com/free-vectors/ b Flow chart outlining the ultra-low input protocol. Cells from 3 independently derived Zbtb24 wild-type (2lox/+) mESC control lines and 3 independently derived Zbtb24 knockout (1lox/1lox) mESC experimental lines were lysed directly in reaction buffer without isolating total RNA. One hundred cells (~ 1 ng RNA, 18 PCR cycles) and 1000 cells (~ 10 ng RNA, 10 PCR cycles) were used to make cDNA for the TaKaRa SMARTer Low Input RNA-Seq kit v3 protocol. One hundred-fifty pg of TaKaRa SMARTer-generated cDNA was then used to prepare the Nextera libraries. c A diagram depicting the data analysis flow and the data quality metrics used in this study to evaluate RNA-Seq protocols. The analysis steps are on the left and the data quality metrics that were derived from each analysis step are on the right
Fig. 2
Fig. 2
Mapping statistics and read coverage over transcripts for all the libraries prepared with standard input protocols. a The rRNA mapping rate was calculated as the percentage of fragments that were mappable to rRNA sequences. b The non-rRNA mapping rate was calculated from all the non-rRNA fragments as the percentage of fragments with both ends or one end mapped to the genome. c Multiple alignment rates were determined from non-rRNA fragments that were mapped to multiple locations of the genome. d Read-bias was assessed using the read coverage over transcripts. Each transcript was subdivided evenly into 1000 bins and the read coverage was averaged over all the transcripts
Fig. 3
Fig. 3
Representation of the transcriptome for all the libraries prepared with standard protocols. a Composition of the uniquely mapped fragments, shown as the percentage of fragments in exonic, intronic, and intergenic regions. According to the direction of transcription, exonic and intronic regions were further divided into sense and antisense. b Saturation analysis showing the percentage of coding genes recovered (calculated as the genes with more than 10 fragments) at increasing sequencing depth. c-d Saturation analysis showing the percentage of lncRNAs recovered (calculated as the lncRNAs with more than 10 fragments) at increasing sequencing depth. In C, the six libraries created using each of three protocols (18 libraries total) are plotted individually. In D, the six libraries from the same protocol were pooled. e Saturation analysis showing the number of splice junctions recovered at increasing sequencing depth
Fig. 4
Fig. 4
Concordance of expression quantification between the libraries prepared with standard input protocols. a Scatter plots in a smoothed color density representation (top-right panel) and Spearman’s rank correlation coefficients (bottom-left panel) for all pairs of libraries using log2(cpm + 1) values. b Unsupervised clustering of all the libraries using log2(cpm + 1) values. Euclidean distance with complete linkage was used to cluster the libraries. c Principal component analysis (PCA) of all the libraries, using log2(cpm + 1) values. The values for each gene across all the libraries were centered to zero and scaled to have unit variance before being analyzed. Circles and triangles represent control and experimental libraries, respectively (NuGEN, red; TruSeq mRNA, green; TrueSeq Total RNA, blue). For all analyses in Fig. 4, genes represented by fewer than 10 fragments in all the libraries were excluded
Fig. 5
Fig. 5
Concordance of differentially expressed genes (DEGs) recovered from libraries prepared with standard protocols. a Principle component analysis (PCA) was performed on the libraries prepared with each standard protocol. b Venn diagram showing the number of DEGs recovered with the three standard protocols. c Pairwise scatter plots of log2 ratio values comparing the DEGs identified in the tumor tissues of control and experimental mice. The black dots represent genes that were called as differentially expressed in libraries from both protocols, colored dots represent genes that were called as differentially expressed in the libraries from only one protocol. The Spearman’s rank correlation coefficient is shown at the top of each plot. The Venn diagram above each plot shows the number of DEGs recovered with the specified protocols. d Scatter plots of log2 ratio values calculated between tumor tissues of control and experimental mice for each protocol vs. qPCR. Spearman’s rank correlation coefficient is shown at the top of each plot
Fig. 6
Fig. 6
Mapping statistics, read coverage bias, and transcriptome representation for libraries prepared using the SMARTer Ultra Low RNA Kit. a The percentage of fragments mapped to rRNA sequences. b Of all the non-rRNA fragments, the percentage of fragments with both ends or one end mapped to the genome. c The read coverage over transcripts. Each transcript was subdivided evenly into 1000 bins and the read coverage was averaged over all the transcripts. d Composition of the uniquely mapped fragments, shown as the percentage of fragments in exonic, intronic, and intergenic regions. According to the direction of transcription, exonic and intronic regions were further divided to sense and antisense. e Saturation analysis showing the percentage of coding genes recovered at increasing sequencing depth. f Saturation analysis showing the percentage of lncRNAs recovered at increasing sequencing depth. g Saturation analysis showing the number of splice junctions recovered at increasing sequencing depth. For the purpose of evaluation, the above analyses also include the libraries prepared with the TruSeq Stranded mRNA protocol using the same biological conditions
Fig. 7
Fig. 7
Concordance of expression quantification and DEG detection using the SMARTer Ultra Low RNA Kit. For the purpose of evaluation, the libraries prepared from the same biological conditions with the TruSeq Stranded mRNA protocol are also included. a Smoothed color density representation scatter plots (top, right) and Spearman’s rank correlation coefficients (bottom left) for all library pairs using log2(cpm + 1) values. 100 and 1000 represent the SMARTer Ultra Low RNA Kit using 100 and 1000 cells. b Principal component analysis (PCA) of all libraries using log2(cpm + 1) values. Red, blue, and green represent libraries prepared with the ultra-low protocol 100 cells, ultra-low protocol 1000 cells, and TruSeq Stranded mRNA protocol, respectively. Circles and triangles represent control and experimental libraries, respectively. c Venn diagram showing the number of DEGs recovered with the SMARTer Ultra Low RNA (100 cells and 1000 cells) and the TruSeq Stranded mRNA kits. d Pairwise scatter plots of log2 ratio values between the biological conditions using the DEGs. The black dots represent genes called as differentially expressed in libraries prepared with both kits, and the colored dots represent genes called as differentially expressed in libraries from only one kit. The Spearman’s rank correlation coefficient is shown at the top of each plot. The Venn diagram to the left of each scatter plot shows the number of DEGs called for the data produced using both or only one of the protocols

References

    1. Margulies M, Egholm M, Altman WE, Attiya S, Bader JS, Bemben LA, et al. Genome sequencing in microfabricated high-density picolitre reactors. Nature. 2005;437(7057):376–380. doi: 10.1038/nature03959. - DOI - PMC - PubMed
    1. Mardis ER. Next-generation DNA sequencing methods. Annu Rev Genomics Hum Genet. 2008;9:387–402. doi: 10.1146/annurev.genom.9.081307.164359. - DOI - PubMed
    1. Mortazavi A, Williams BA, McCue K, Schaeffer L, Wold B. Mapping and quantifying mammalian transcriptomes by RNA-Seq. Nat Methods. 2008;5(7):621–628. doi: 10.1038/nmeth.1226. - DOI - PubMed
    1. Nagalakshmi U, Wang Z, Waern K, Shou C, Raha D, Gerstein M, et al. The transcriptional landscape of the yeast genome defined by RNA sequencing. Science. 2008;320(5881):1344–1349. doi: 10.1126/science.1158441. - DOI - PMC - PubMed
    1. Lister R, O'Malley RC, Tonti-Filippini J, Gregory BD, Berry CC, Millar AH, et al. Highly integrated single-base resolution maps of the epigenome in Arabidopsis. Cell. 2008;133(3):523–536. doi: 10.1016/j.cell.2008.03.029. - DOI - PMC - PubMed

Publication types

MeSH terms