

Epithelial-mesenchymal transition markers screened in a cell-based model and validated in lung adenocarcinoma
- PMID: 31296175
- PMCID: PMC6624955
- DOI: 10.1186/s12885-019-5885-9
Epithelial-mesenchymal transition markers screened in a cell-based model and validated in lung adenocarcinoma
Abstract
Background: Re-capture of the differences between tumor and normal tissues observed at the patient level in cell cultures and animal models is critical for applications of these cancer-related differences. The epithelial-mesenchymal transition (EMT) process is essential for tumor migratory and invasive capabilities. Although plenty of EMT markers are revealed, molecular features during the early stages of EMT are poorly understood.
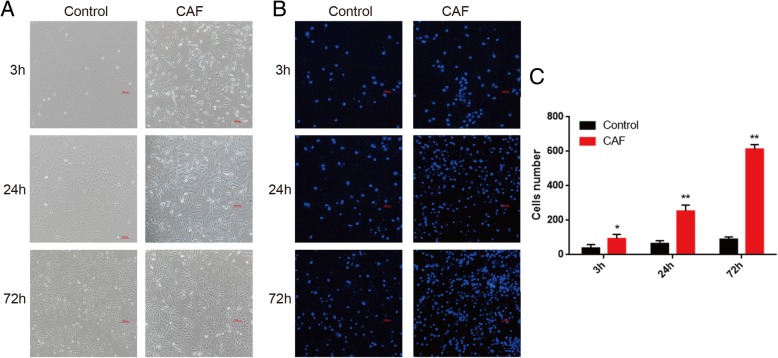
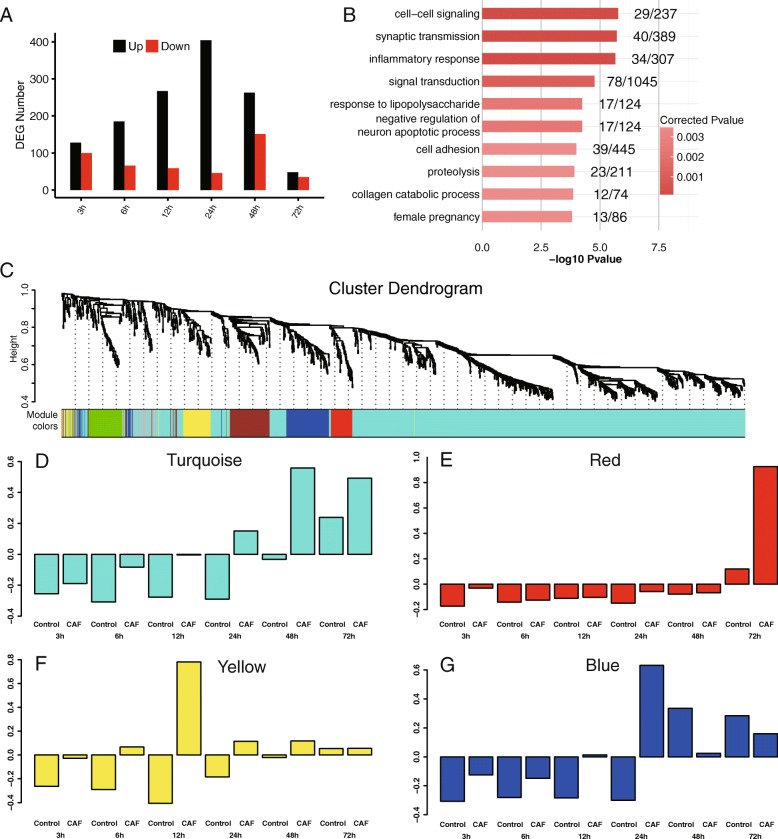
Methods: A cell-based model to induce lung cell (A549) EMT using conditioned medium of in vitro cancer activated fibroblast (WI38) was established. High-throughput sequencing methods, including RNA-seq and miRNA-seq, and advanced bioinformatics methods were used to explore the transcriptome profile transitions accompanying the progression of EMT. We validated our findings with experimental techniques including transwell and immunofluorescence assay, as well as the TCGA data.
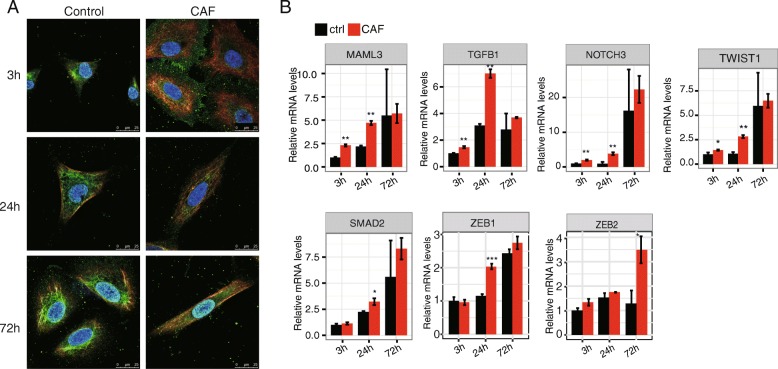
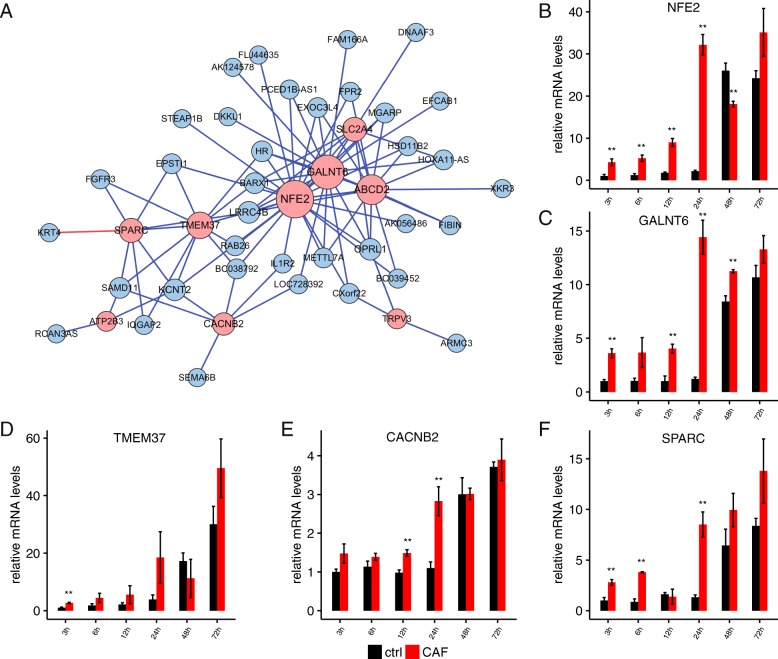
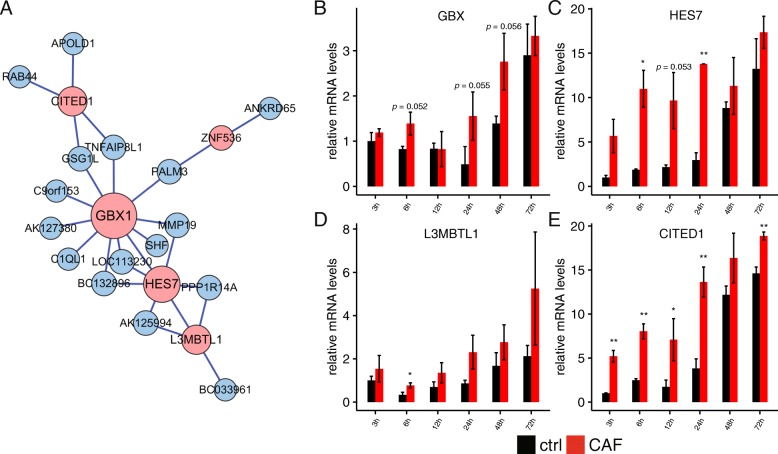
Results: We have constructed an in vitro cell model to mimic the EMT in patients. We discovered that several new transcription factors were among the early genes (3 h) to respond to cancer micro-environmental cues which could play critical roles in triggering further EMT signals. The early EMT markers also included genes encoding membrane transporters and blood coagulation function. Three of the nine-examined early EMT hallmark genes, GALNT6, SPARC and HES7, were up-regulated specifically in the early stages of lung adenocarcinoma (LUAD) and confirmed by TCGA patient transcriptome data. In addition, we showed that miR-3613, a regulator of EGFR pathway genes, was constantly repressed during EMT progress and indicative of an epithelial miRNA marker.
Conclusions: The CAF-stimulated EMT cell model may recapture some of the molecular changes during EMT progression in clinical patients. The identified early EMT hallmark genes GALNT6, SPARC and HES7and miR-3613 provide new markers and therapeutic targets for LUAD for the further clinical diagnosis and drug screening.
Keywords: EMT; Lung adenocarcinoma; RNA-seq; WGCNA; miRNA-seq.
Conflict of interest statement
The authors declare that they have no competing interests.
Figures


Similar articles
-
Comparative gene co-expression network analysis of epithelial to mesenchymal transition reveals lung cancer progression stages.BMC Cancer. 2017 Dec 6;17(1):830. doi: 10.1186/s12885-017-3832-1. BMC Cancer. 2017. PMID: 29212455 Free PMC article.
-
High-throughput mRNA and miRNA profiling of epithelial-mesenchymal transition in MDCK cells.BMC Genomics. 2015 Nov 16;16:944. doi: 10.1186/s12864-015-2036-9. BMC Genomics. 2015. PMID: 26572553 Free PMC article.
-
TGF-β-mediated epithelial-mesenchymal transition and tumor-promoting effects in CMT64 cells are reflected in the transcriptomic signature of human lung adenocarcinoma.Sci Rep. 2021 Nov 17;11(1):22380. doi: 10.1038/s41598-021-01799-x. Sci Rep. 2021. PMID: 34789779 Free PMC article.
-
Is There an Interconnection between Epithelial-Mesenchymal Transition (EMT) and Telomere Shortening in Aging?Int J Mol Sci. 2021 Apr 9;22(8):3888. doi: 10.3390/ijms22083888. Int J Mol Sci. 2021. PMID: 33918710 Free PMC article. Review.
-
Computational models to explore the complexity of the epithelial to mesenchymal transition in cancer.Wiley Interdiscip Rev Syst Biol Med. 2020 Nov;12(6):e1488. doi: 10.1002/wsbm.1488. Epub 2020 Mar 24. Wiley Interdiscip Rev Syst Biol Med. 2020. PMID: 32208556 Review.
Cited by
-
Roles and signaling pathways of CITED1 in tumors: overview and novel insights.J Int Med Res. 2024 Jan;52(1):3000605231220890. doi: 10.1177/03000605231220890. J Int Med Res. 2024. PMID: 38190845 Free PMC article. Review.
-
Small Non-coding RNAs: Do They Encode Answers for Controlling SARS-CoV-2 in the Future?Front Microbiol. 2020 Sep 18;11:571553. doi: 10.3389/fmicb.2020.571553. eCollection 2020. Front Microbiol. 2020. PMID: 33072032 Free PMC article. Review.
-
The Analysis of Selected miRNAs and Target MDM2 Gene Expression in Oral Squamous Cell Carcinoma.Biomedicines. 2023 Nov 14;11(11):3053. doi: 10.3390/biomedicines11113053. Biomedicines. 2023. PMID: 38002053 Free PMC article.
-
Placenta-specific protein 8 promotes the proliferation of lung adenocarcinoma PC-9 cells and their tolerance to an epidermal growth factor receptor tyrosine kinase inhibitor by activating the ERK signaling pathway.Oncol Lett. 2019 Nov;18(5):5621-5627. doi: 10.3892/ol.2019.10911. Epub 2019 Sep 24. Oncol Lett. 2019. PMID: 31620204 Free PMC article.
-
ppGalNAc-T4-catalyzed O-Glycosylation of TGF-β type Ⅱ receptor regulates breast cancer cells metastasis potential.J Biol Chem. 2021 Jan-Jun;296:100119. doi: 10.1074/jbc.RA120.016345. Epub 2020 Dec 3. J Biol Chem. 2021. PMID: 33234595 Free PMC article.
References
-
- Witz IP, Levy-Nissenbaum O. The tumor microenvironment in the post-PAGET era. Cancer Lett. 2006;242(1):1–10. - PubMed
-
- Kalluri R, Zeisberg M. Fibroblasts in cancer. Nat Rev Cancer. 2006;6(5):392–401. - PubMed
-
- Kuzet SE, Gaggioli C. Fibroblast activation in cancer: when seed fertilizes soil. Cell Tissue Res. 2016;365(3):607–619. - PubMed
-
- Kalluri R. The biology and function of fibroblasts in cancer. Nat Rev Cancer. 2016;16(9):582–598. - PubMed
MeSH terms
Substances
Grants and funding
- 91129733/National Natural Science Foundation of China
- 81330060/National Natural Science Foundation of China
- 81502702/National Natural Science Foundation of China
- 2015AA020409/National High Technology Research and Development Program of China
- 2014225003/Science and Technology Plan Foundation of Liaoning Province
LinkOut - more resources
Full Text Sources
Research Materials
Miscellaneous
