

Integrative genomic and transcriptomic analysis of genetic markers in Dupuytren's disease
- PMID: 31296227
- PMCID: PMC6624179
- DOI: 10.1186/s12920-019-0518-3
Integrative genomic and transcriptomic analysis of genetic markers in Dupuytren's disease
Abstract
Background: Dupuytren's disease (DD) is a fibroproliferative disorder characterized by thickening and contracting palmar fascia. The exact pathogenesis of DD remains unknown.
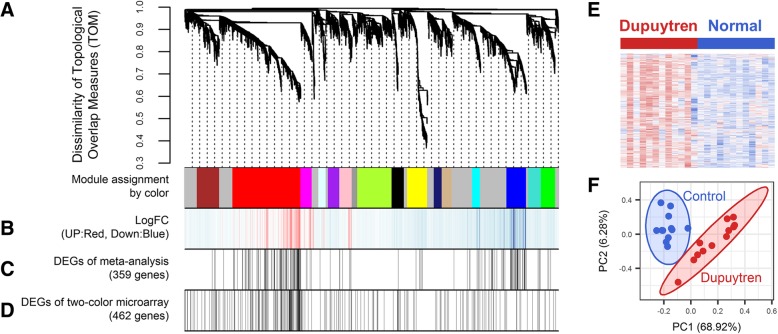
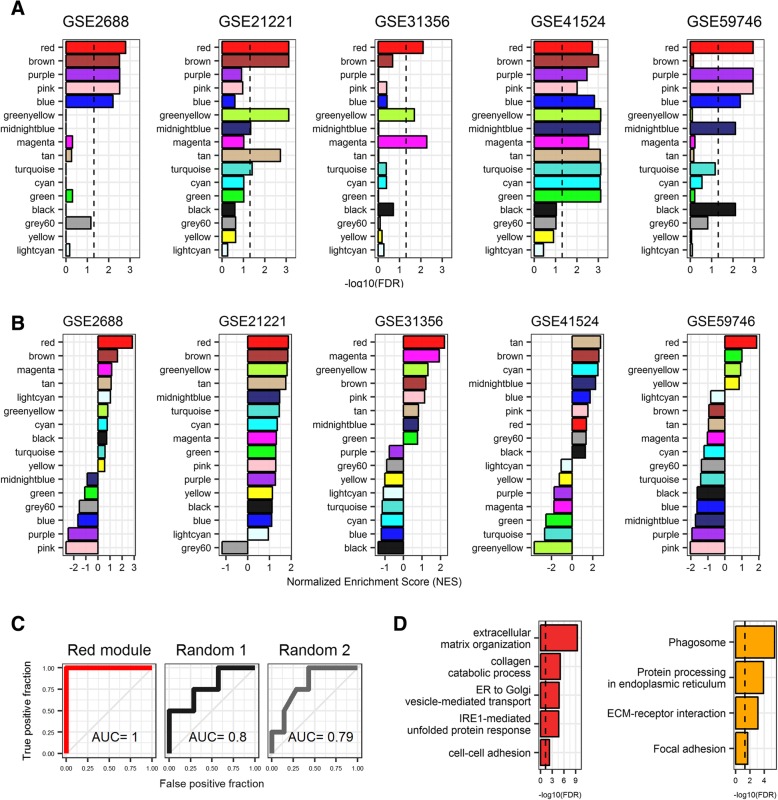
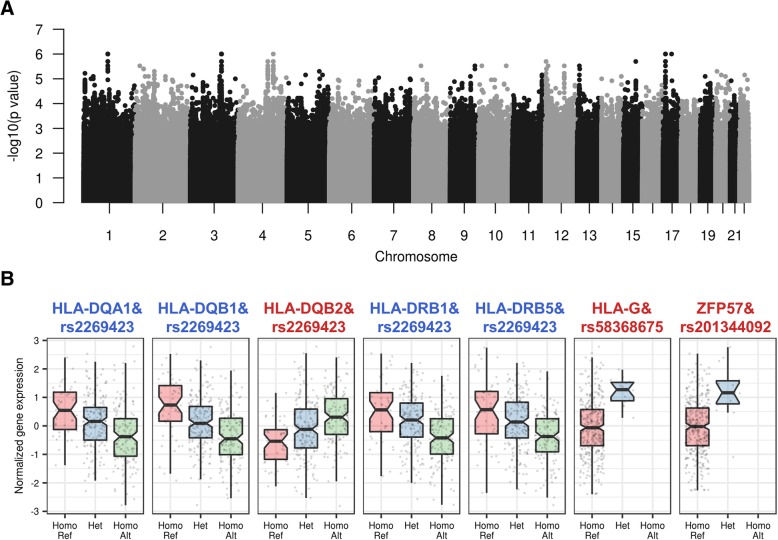
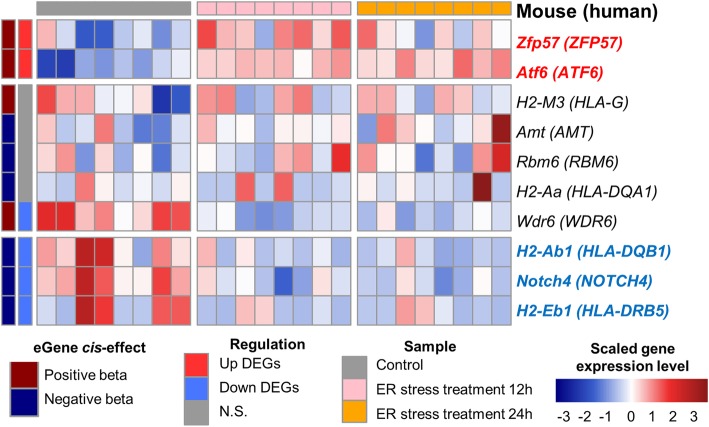
Results: In this study, we identified co-expressed gene set (DD signature) consisting of 753 genes via weighted gene co-expression network analysis. To confirm the robustness of DD signature, module enrichment analysis and meta-analysis were performed. Moreover, this signature effectively classified DD disease samples. The DD signature were significantly enriched in unfolded protein response (UPR) related to endoplasmic reticulum (ER) stress. Next, we conducted multiple-phenotype regression analysis to identify trans-regulatory hotspots regulating expression levels of DD signature using Genotype-Tissue Expression data. Finally, 10 trans-regulatory hotspots and 16 eGenes genes that are significantly associated with at least one cis-eQTL were identified.
Conclusions: Among these eGenes, major histocompatibility complex class II genes and ZFP57 zinc finger protein were closely related to ER stress and UPR, suggesting that these genetic markers might be potential therapeutic targets for DD.
Keywords: Dupuytren’s disease; Endoplasmic reticulum (ER) stress; Major histocompatibility complex class II; Multiple-phenotype analysis; Unfolded protein response (UPR); ZFP57 zinc finger protein; trans-regulatory hotspots.
Conflict of interest statement
The authors declare that they have no competing interests.
Figures
Similar articles
-
Molecular phenotypic descriptors of Dupuytren's disease defined using informatics analysis of the transcriptome.J Hand Surg Am. 2008 Mar;33(3):359-72. doi: 10.1016/j.jhsa.2007.11.010. J Hand Surg Am. 2008. PMID: 18343292
-
Expression of a novel gene, MafB, in Dupuytren's disease.J Hand Surg Am. 2006 Feb;31(2):211-8. doi: 10.1016/j.jhsa.2005.09.007. J Hand Surg Am. 2006. PMID: 16473681
-
Identification of biomarkers in Dupuytren's disease by comparative analysis of fibroblasts versus tissue biopsies in disease-specific phenotypes.J Hand Surg Am. 2009 Jan;34(1):124-36. doi: 10.1016/j.jhsa.2008.09.017. J Hand Surg Am. 2009. PMID: 19121738
-
Dupuytren's: a systems biology disease.Arthritis Res Ther. 2011;13(5):238. doi: 10.1186/ar3438. Epub 2011 Sep 12. Arthritis Res Ther. 2011. PMID: 21943049 Free PMC article. Review.
-
Functional genomics in identification of drug targets in Dupuytren's contracture.Front Biosci (Landmark Ed). 2010 Jan 1;15(1):57-64. doi: 10.2741/3606. Front Biosci (Landmark Ed). 2010. PMID: 20036806 Review.
Cited by
-
RNA-seq unravels distinct expression profiles of keloids and Dupuytren's disease.Heliyon. 2023 Dec 13;10(1):e23681. doi: 10.1016/j.heliyon.2023.e23681. eCollection 2024 Jan 15. Heliyon. 2023. PMID: 38187218 Free PMC article.
-
Meta-Analysis of Polymyositis and Dermatomyositis Microarray Data Reveals Novel Genetic Biomarkers.Genes (Basel). 2019 Oct 30;10(11):864. doi: 10.3390/genes10110864. Genes (Basel). 2019. PMID: 31671645 Free PMC article.
-
The prevalence of Dupuytren's disease in patients with diabetes mellitus.Commun Med (Lond). 2023 Jul 13;3(1):96. doi: 10.1038/s43856-023-00332-7. Commun Med (Lond). 2023. PMID: 37443309 Free PMC article.
-
An in-silico approach to studying a very rare neurodegenerative disease using a disease with higher prevalence with shared pathways and genes: Cerebral adrenoleukodystrophy and Alzheimer's disease.Front Mol Neurosci. 2022 Sep 27;15:996698. doi: 10.3389/fnmol.2022.996698. eCollection 2022. Front Mol Neurosci. 2022. PMID: 36245924 Free PMC article.
-
An Integrative Transcriptomic Analysis of Systemic Juvenile Idiopathic Arthritis for Identifying Potential Genetic Markers and Drug Candidates.Int J Mol Sci. 2021 Jan 12;22(2):712. doi: 10.3390/ijms22020712. Int J Mol Sci. 2021. PMID: 33445803 Free PMC article.
References
Publication types
MeSH terms
Substances
LinkOut - more resources
Full Text Sources
Other Literature Sources
