. 2019 Jul 16;74(2):219-234.
doi: 10.1016/j.jacc.2019.04.060.

Evaluation of 30-Day Hospital Readmission and Mortality Rates Using Regression-Discontinuity Framework

Affiliations

Evaluation of 30-Day Hospital Readmission and Mortality Rates Using Regression-Discontinuity Framework

Rohan Khera et al. J Am Coll Cardiol. .

Abstract

Background: The Hospital Readmissions Reduction Program (HRRP) has been associated with reduced 30-day readmissions for acute myocardial infarction (AMI) and heart failure (HF).

Objectives: The purpose of this study was to test whether this 30-day readmission reduction is a manifestation of practices that defer or avoid hospitalizations beyond the 30-day period.

Methods: At all U.S. hospitals under HRRP, the authors calculated daily readmission rates for elderly Medicare fee-for-service beneficiaries through day-60 post-discharge following a hospitalization for AMI and HF-the 2 target cardiovascular conditions-as well as pneumonia in July 2008 to June 2016. The authors applied a robust bias-corrected nonparametric regression approach to evaluate for discontinuities in rates around day 30.

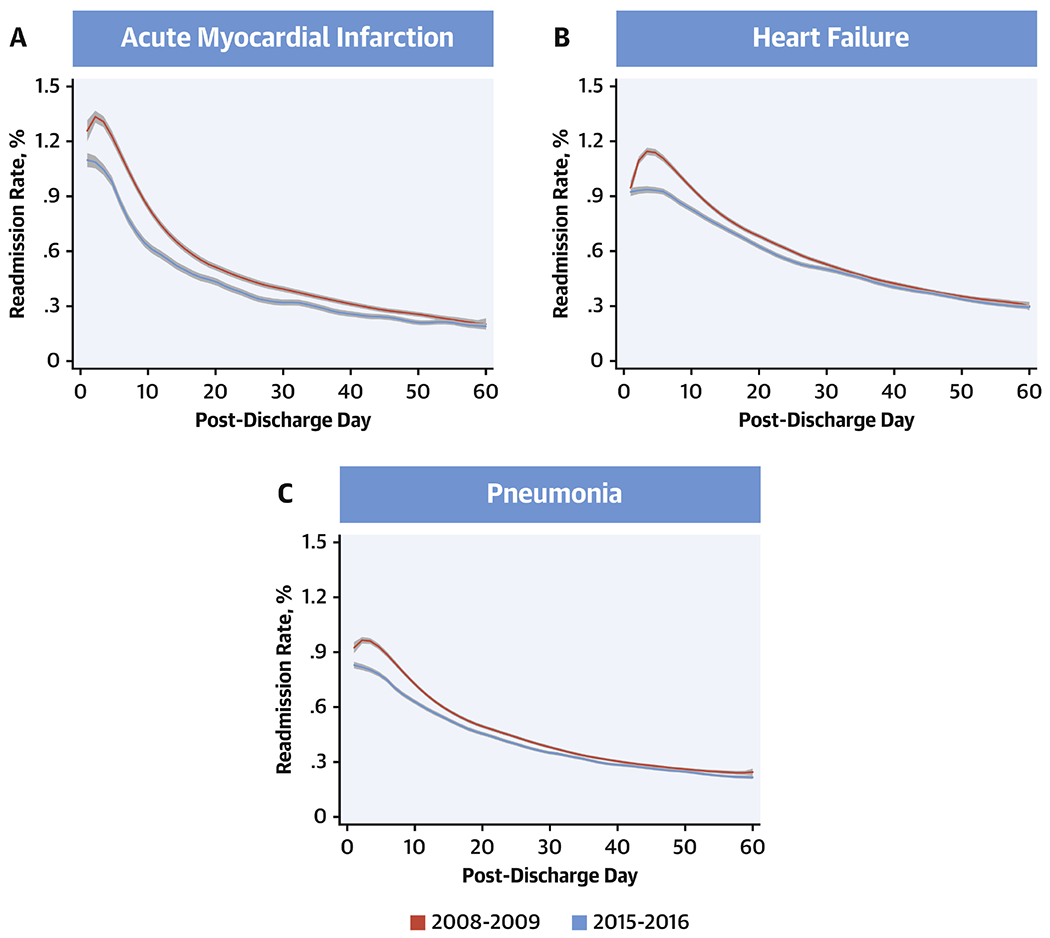
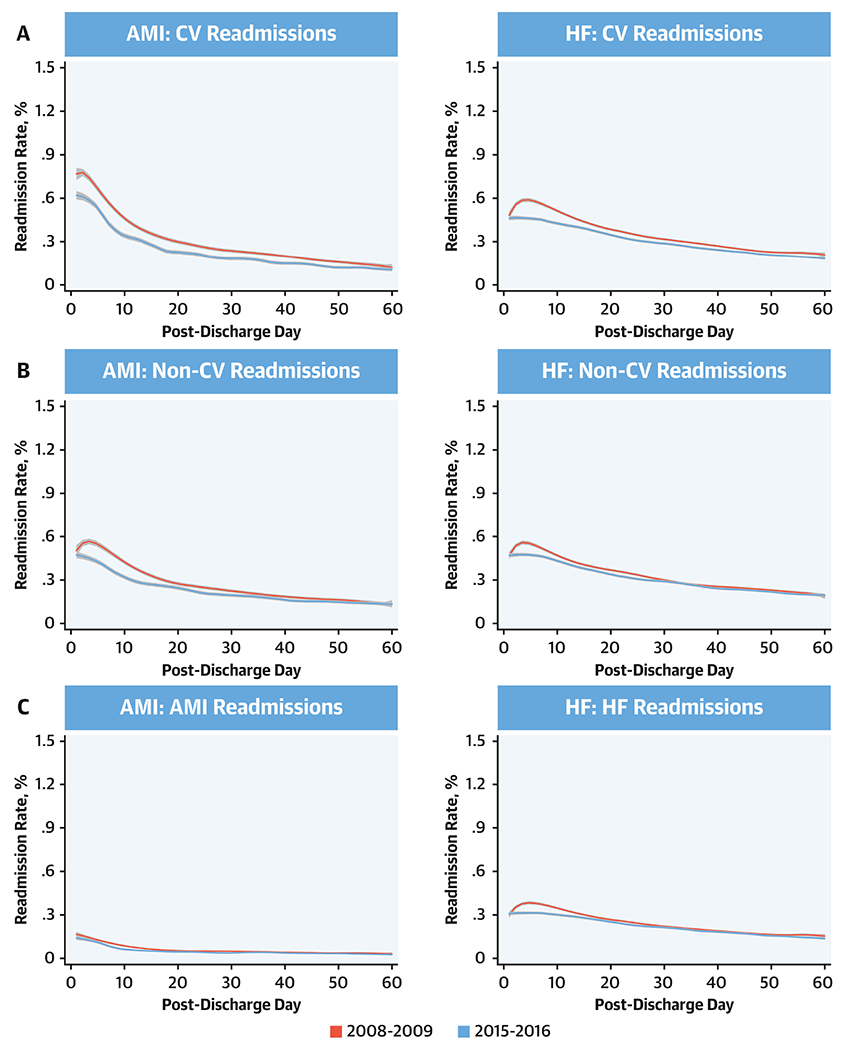
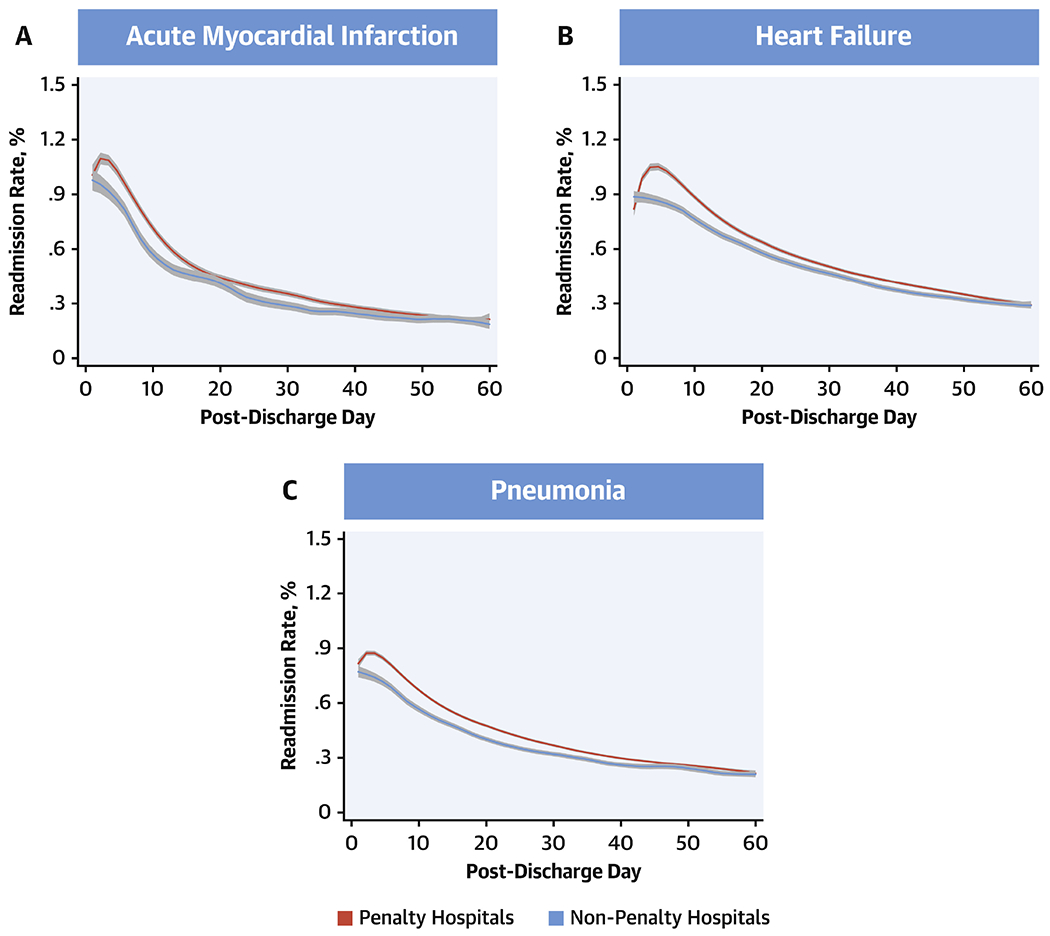
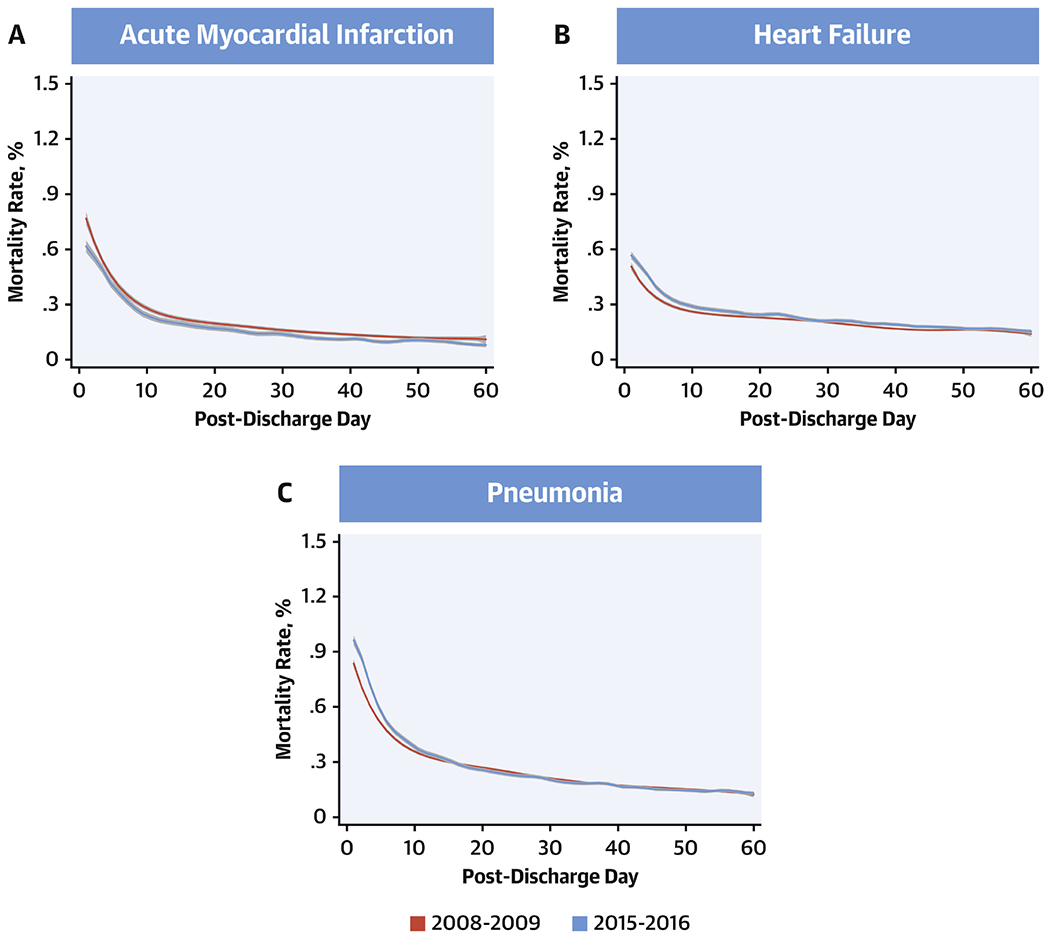
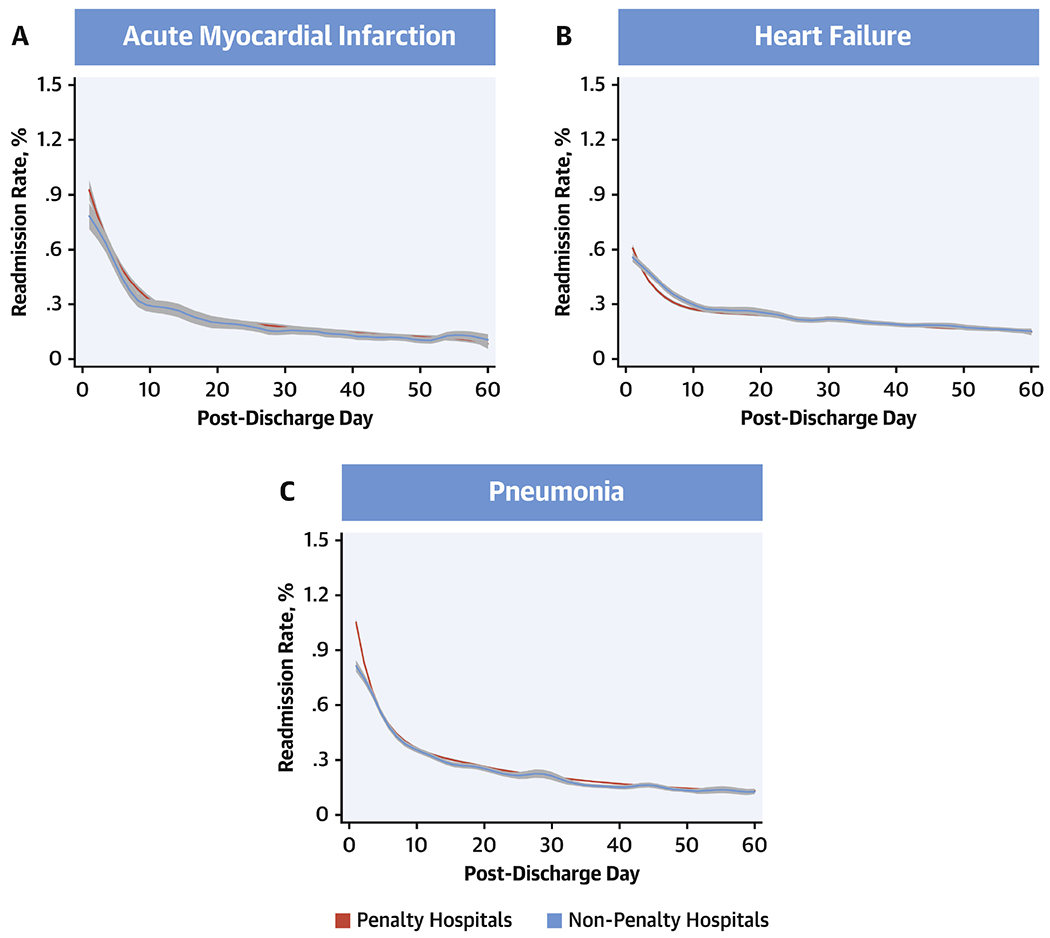
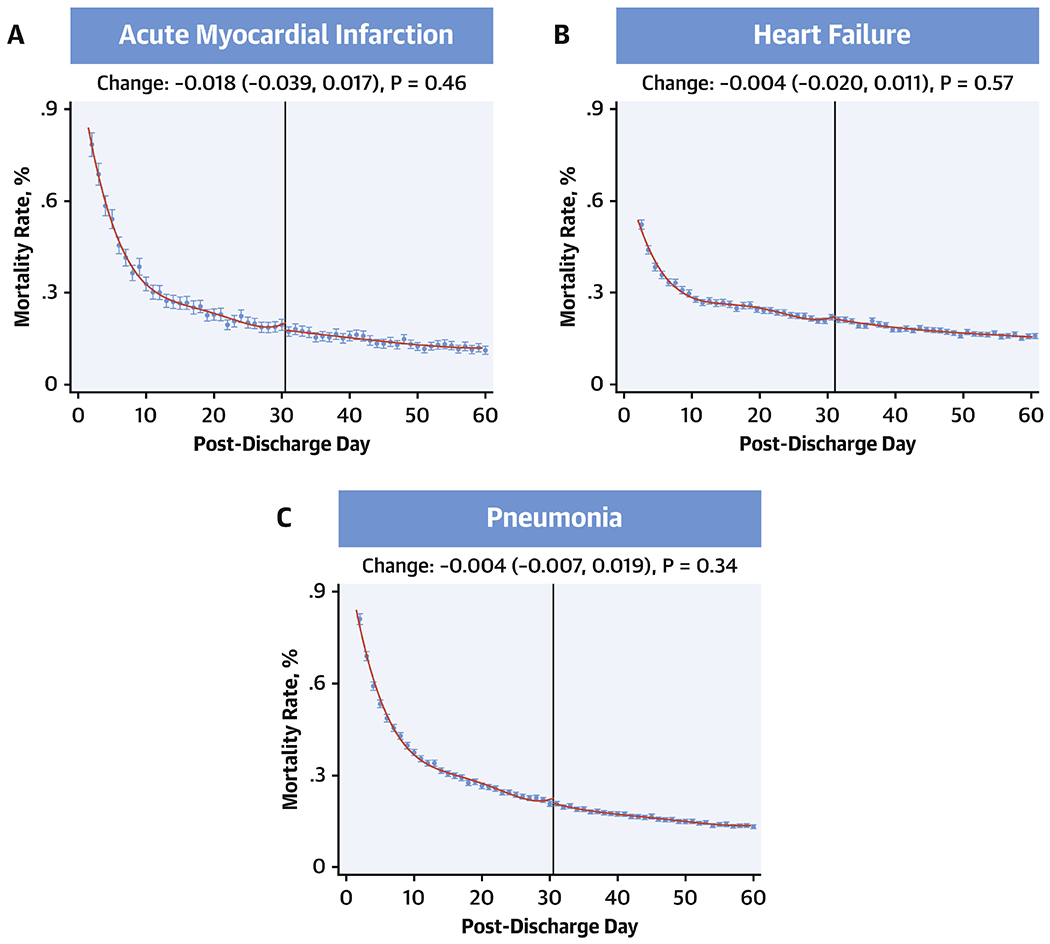
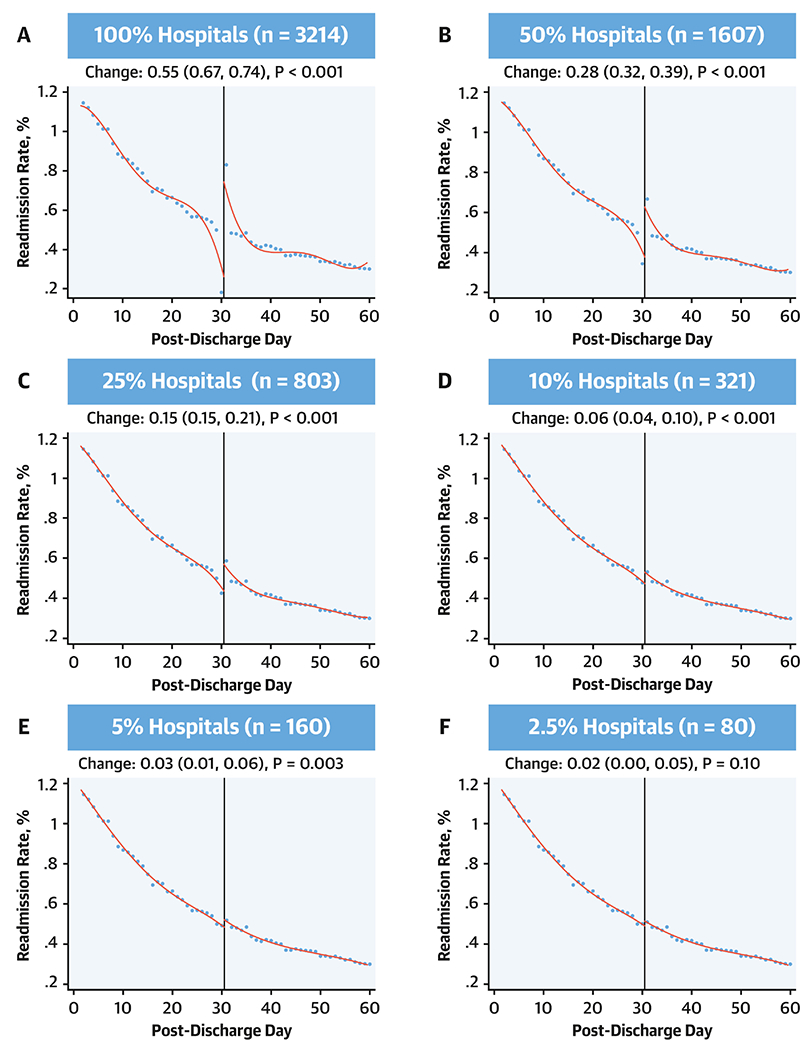
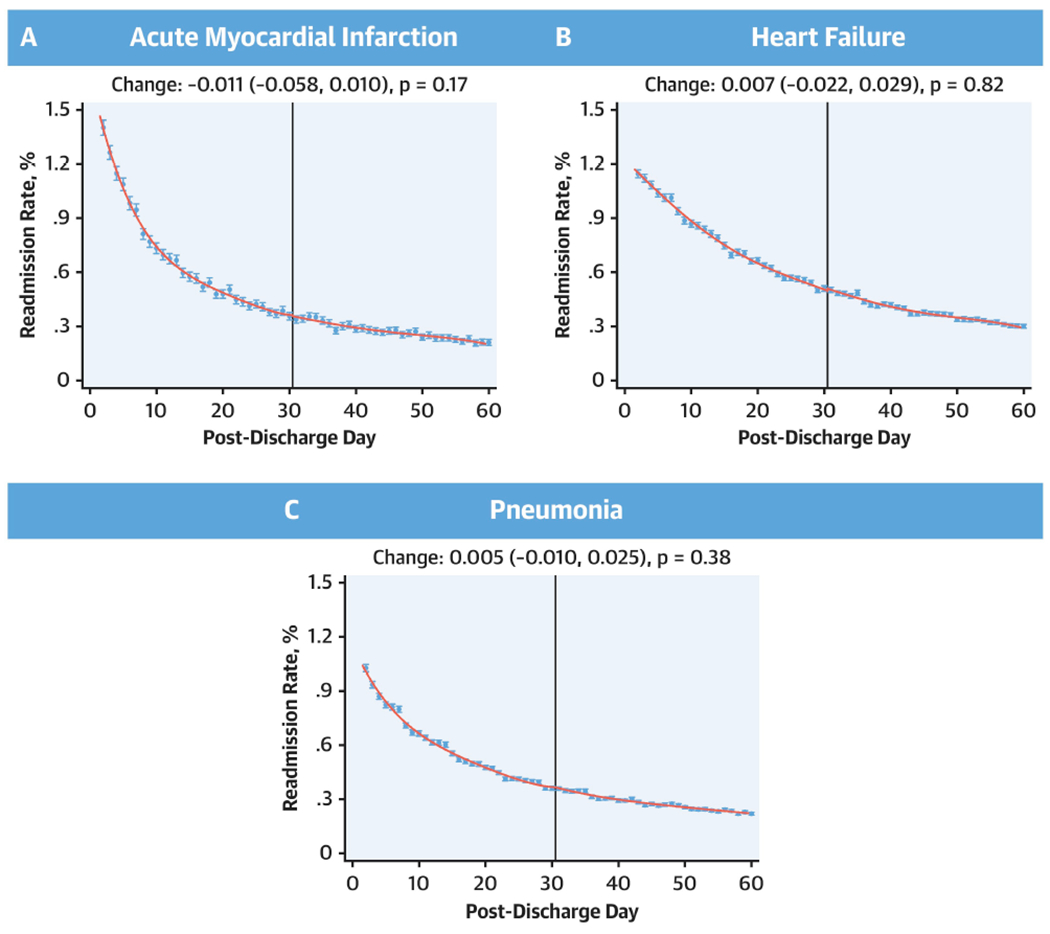
Results: The authors identified 3,256 eligible hospitals, with median readmission rates in the days 1 to 30 and 31 to 60 post-discharge of 19.6% (interquartile range [IQR]: 16.7% to 22.9%) and 7.8% (IQR: 6.5% to 9.4%) for AMI, 23.0% (IQR: 20.6% to 25.3%) and 11.4% (IQR: 10.2% to 12.6%) for HF, and 17.5% (IQR: 15.4% to 19.8%) and 8.3% (IQR: 7.3% to 9.3%) for pneumonia, respectively. Daily readmission rates decreased across most of the 60 post-discharge days, with no discontinuities in the local polynomial regression for readmission at the 30-day mark, with a >95% power to detect 0.1% difference for each outcome across post-discharge day 30. Similarly, there was no discontinuity in mortality at 30 days post-discharge, or for either outcome at hospitals that incurred readmission penalties.

Conclusions: There was no evidence that clinicians adopted strategies that specifically deferred admissions or affected mortality in the 30-day period after discharge. The findings are consistent with the institution of strategies that generally affected readmission risk after discharge.

Keywords: Hospital Readmissions Reduction Program; health policy; outcomes research; quality of care.


Figures

Figure 1:
Figure 1:. All-cause Readmission Rates from Day 1 Through 60 Post-Discharge.
Readmission rates from days 1 through 60 post-discharge during the first year (July 2008-June 2009) and final year (July 2015-June 2016) of the study. Lines represent the smooth curves based on generalized additive models with a fourth order polynomial. Red: 2008-09, blue: 2015-16.
Figure 2:
Figure 2:. Changes in Readmission Rates from Day 1 Through 60 Post-Discharge by Cause of Readmission.
Readmissions were classified as cardiovascular readmissions, non-cardiovascular readmissions, and index-condition readmission and were defined based on the primary diagnosis of the readmission. Lines represent the smooth curves based on generalized additive models with a fourth order polynomial. Red line represents start year July 2008- June 2009 and blue line represents the last year July 2015-June 2016.
Figure 3:
Figure 3:. Readmission Rates at Penalty Hospitals.
Readmission rates from days 1 through 60 post-discharge during July 2013 -June 2016 based on whether hospitals incurred penalties under the Hospital Readmissions Reduction Program in 2013. Lines represent the smooth curves based on generalized additive models with a fourth order polynomial. Red: Penalty hospitals, blue: Non-penalty hospitals.
Figure 4:
Figure 4:. All-cause Mortality Rates from Days 1 Through 60 Post-Discharge.
Mortality rates from days 1 through 60 post-discharge during the first year (July 2008-June 2009) and final year (July 2015-June 2016) of the study. Lines represent the smooth curves based on generalized additive models with a fourth order polynomial. Red: 2008-09, blue: 2015-16.
Figure 5:
Figure 5:. Mortality Rates at Penalty Hospitals.
Mortality rates from days 1 through 60 post-discharge during July 2013 -June 2016 based on whether hospitals incurred penalties under the Hospital Readmissions Reduction Program in 2013. Lines represent the smooth curves based on generalized additive models with a fourth order polynomial. Red: Penalty hospitals, blue: Non-penalty hospitals.
Figure 6:
Figure 6:. Discontinuity regression plots for 30-day mortality using local polynomial regression.
No discontinuities in the regression around 30 days for either heart failure, acute myocardial infarction or pneumonia. Effect estimates represent changes that occurred across day-30 post-discharge.
Figure 7:
Figure 7:. Simulation analyses moving 1 readmission from day 30 to 31.
Coefficient for discontinuities and their 95% confidence intervals for local polynomial regression with a cut point at post-discharge day 30. Simulation applied sequentially at all hospitals for the heart failure readmission outcomes and then varying randomly selected subsets of these hospitals.
Central Illustration:
Central Illustration:. Discontinuity regression plots for 30-day readmission using local polynomial regression.
No discontinuities in the regression around 30 days for either acute myocardial infarction, heart failure, or pneumonia. Effect estimates represent changes that occurred across day-30 post-discharge.

Comment in

Similar articles

Cited by

References

    1. Zuckerman RB, Sheingold SH, Orav EJ, Ruhter J, Epstein AM. Readmissions, observation, and the Hospital Readmissions Reduction Program. N Engl J Med 2016;374:1543–51. - PubMed
    1. Khera R, Dharmarajan K, Wang Y, et al. Association of the hospital readmissions reduction program with mortality during and after hospitalization for acute myocardial infarction, heart failure, and pneumonia. JAMA Network Open 2018;1:e182777. - PMC - PubMed
    1. McIlvennan CK, Eapen ZJ, Allen LA. Hospital Readmissions Reduction Program. Circulation 2015;131:1796–803. - PMC - PubMed
    1. Dharmarajan K, Hsieh AF, Kulkarni VT et al. Trajectories of risk after hospitalization for heart failure, acute myocardial infarction, or pneumonia: retrospective cohort study. BMJ 2015;350:h411. - PMC - PubMed
    1. Krumholz HM, Hsieh A, Dreyer RP, Welsh J, Desai NR, Dharmarajan K. Trajectories of Risk for Specific Readmission Diagnoses after Hospitalization for Heart Failure, Acute Myocardial Infarction, or Pneumonia. PLoS One 2016;11:e0160492. - PMC - PubMed

Publication types

MeSH terms