. 2020 Mar:217:86-94.
doi: 10.1016/j.schres.2019.06.003. Epub 2019 Jul 8.

Markers of glutamate and GABA neurotransmission in the prefrontal cortex of schizophrenia subjects: Disease effects differ across anatomical levels of resolution

Affiliations

Markers of glutamate and GABA neurotransmission in the prefrontal cortex of schizophrenia subjects: Disease effects differ across anatomical levels of resolution

Samuel J Dienel et al. Schizophr Res. 2020 Mar.

Abstract

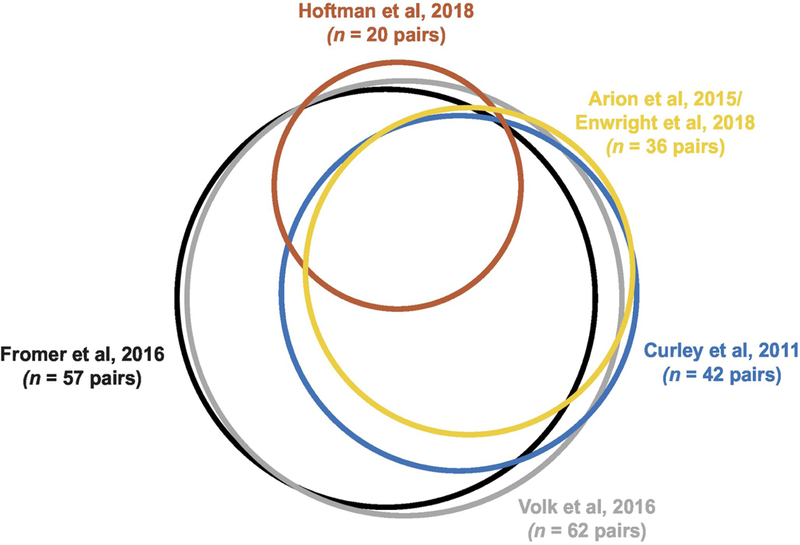
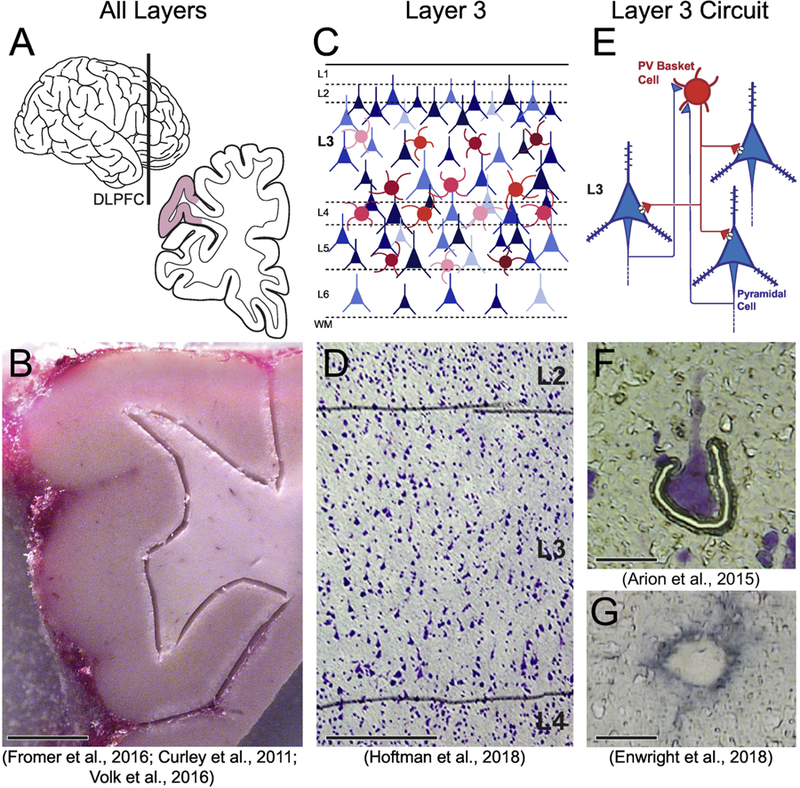
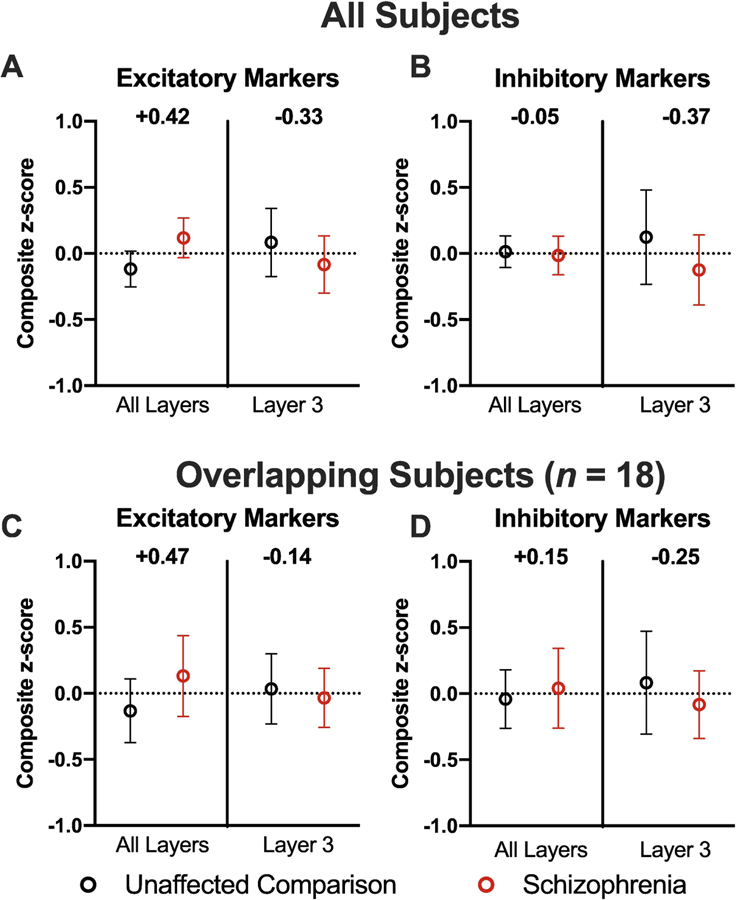
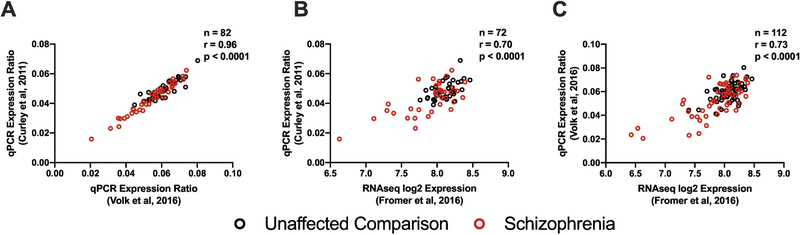
Cognitive dysfunction in individuals with schizophrenia is thought to reflect, at least in part, altered levels of excitatory and inhibitory neurotransmission in the dorsolateral prefrontal cortex (DLPFC). Studies of the postmortem human brain allow for interrogation of the disease-related alterations in markers of excitatory and inhibitory neurotransmission at different levels of anatomical resolution. Here, we re-analyzed six published datasets from postmortem studies of schizophrenia to assess molecular markers of glutamate and GABA neurotransmission in the DLPFC at three levels of anatomical resolution: 1) total cortical gray matter, 2) gray matter restricted to layer 3, and 3) a layer 3 local circuit composed of excitatory pyramidal cells and inhibitory, parvalbumin-containing, GABA neurons. We formulated composite measures of glutamate and GABA neurotransmission from z-scores of key transcripts that regulate these functions. Relative to unaffected comparison subjects, the composite glutamate measure was higher in schizophrenia subjects in total gray matter homogenates but lower in samples restricted to layer 3 or the layer 3 local circuit. The composite index of GABA neurotransmission did not differ between subject groups in total gray matter homogenates but was lower in schizophrenia subjects in layer 3 and lower still in the local layer 3 circuit. These findings suggest that the balance of excitation and inhibition in the DLPFC of schizophrenia subjects differs depending on the level of anatomical resolution studied, highlighting the importance of layer- and cell type-specific studies to understand disease-related alterations in cortical circuitry.

Keywords: E/I balance; GABA; Glutamate; Layer 3; Prefrontal cortex; Schizophrenia.


Conflict of interest statement

Declaration of Competing Interest David A. Lewis currently receives investigator-initiated research support from Pfizer and Merck. All other authors report no conflicts of interest.

Figures

Figure 1.
Figure 1.
Euler diagram illustrating in proportionally-sized circles the number of subject pairs in each study and the overlap of identical subject pairs across studies. Between some studies, a different unaffected comparison subject was paired to the same schizophrenia subject, and these cases were omitted from the overlap in the diagrams. Plot was made in R using the eulerr package (Larsson, 2018).
Figure 2.
Figure 2.
Approaches for studying postmortem tissue at multiple levels of anatomical resolution and techniques for capturing tissue at these resolutions for RNA quantification. (A) Schematic of the whole brain (left); the vertical line indicates the approximate location of the coronal tissue blocks (right) from which the DLPFC was sampled. Shaded area indicates the approximate location of the tissue block shown in (B). (B) Total gray matter tissue homogenates were dissected from the underlying white matter and collected for RNAseq or qPCR analyses (scale bar = 5mm). (C) Schematic of the laminar organization of the DLPFC. Objects of different colors and sizes represent the various cell types present in different cortical layers. (D) Under a laser microdissection 5x microscope objective (scale bar = 400 µm), the layer 2/3 and 3/4 borders were identified, and samples restricted to layer 3 tissue were collected for qPCR analysis. (E) Schematic drawing indicating the principal excitatory/inhibitory circuit within layer 3 between pyramidal cells (blue) and parvalbumin-containing interneurons (red). (F) Individual pyramidal cells were microdissected using a similar laser microdissection approach with a 40x microscope objective (scale bar = 25 µm). (G) Individual parvalbumin cells, identified by aggrecan which labels the perineuronal net surrounding parvalbumin cells, were collected using a laser microdissection approach with a 40x microscope objective (scale bar = 10 µm). Images D, F and G were adapted from Hoftman et al., 2018, Arion et al., 2015 and Enwright et al., 2018, respectively.
Figure 3.
Figure 3.
Comparison of composite measures for (A) excitatory and (B) inhibitory markers in all layers (i.e., total cortical gray matter homogenates) and in layer 3 tissue homogenates. Cohen’s D effect sizes are shown between the schizophrenia (red) and unaffected comparison (black) subject groups. Data in (A) and (B) are from all subjects in each study (n = 57 subject pairs for total gray matter, n = 20 subject pairs for layer 3). Data in (C) and (D) show composite measures for excitatory and inhibitory markers after these scores were re-calculated using only the subset of subjects (n = 18 subject pairs) common to both studies. Values are mean ± 95% confidence interval of the mean.
Figure 4.
Figure 4.
Plots of individual subject data for GAD67 mRNA levels in total gray matter homogenates from three studies. (A) Correlation of GAD67 mRNA levels between Volk et al., 2016, and Curley et al., 2011 for separate qPCR analyses in the same 41 subject pairs. (B) Correlation of GAD67 mRNA levels as determined by RNAseq (Fromer et al 2016) or qPCR (Curley et al 2011) in the same 36 subject pairs. (C) Correlation of GAD67 mRNA levels as determined by RNAseq (Fromer et al 2016) or qPCR Volk et al 2016 (qPCR) in the same 56 subject pairs.
Figure 5.
Figure 5.
Comparison of composite measures for (A) excitatory and (B) inhibitory markers in all layers (n = 57 subject pairs, left panels), layer 3 tissue homogenates (n = 20 subject pairs, middle panel), and layer 3 local circuit consisting of excitatory pyramidal cells and inhibitory PV cells (n = 36 subject pairs, right panels). Cohen’s D effect sizes are shown for the composite z-scores between schizophrenia (red) and unaffected comparison (black) subjects. Data for (A) and (B) show all subjects from each dataset, and (C) and (D) show the same composite excitatory and inhibitory measures, respectively, re-calculated using only the subset of subject pairs (n = 13) common to all three studies. Values are mean ± 95% confidence interval of the mean.

References

    1. Anticevic A, Hu X, Xiao Y, Hu J, Li F, Bi F, Cole MW, Savic A, Yang GJ, Reprovs G, Murray JD, Wang X-J, Huang X, Lui S, Krystal JH, Gong Q, 2015. Early-Course Unmedicated Schizophrenia Patients Exhibit Elevated Prefrontal Connectivity Associated with Longitudinal Change. J. Neurosci 35, 267–286. 10.1523/jneurosci.2310-14.2015 - DOI - PMC - PubMed
    1. Arion D, Corradi JP, Tang S, Datta D, Boothe F, He A, Cacace AM, Zaczek R, Albright CF, Tseng G, Lewis DA, 2015. Distinctive transcriptome alterations of prefrontal pyramidal neurons in schizophrenia and schizoaffective disorder. Mol. Psychiatry 20, 1397–1405. 10.1038/mp.2014.171 - DOI - PMC - PubMed
    1. Arion D, Huo Z, Enwright JF, Corradi JP, Tseng G, Lewis DA, 2017. Transcriptome Alterations in Prefrontal Pyramidal Cells Distinguish Schizophrenia From Bipolar and Major Depressive Disorders. Biol. Psychiatry 82, 594–600. 10.1016/j.biopsych.2017.03.018 - DOI - PMC - PubMed
    1. Asada H, Kawamura Y, Maruyama K, Kume H, Ding RG, Kanbara N, Kuzume H, Sanbo M, Yagi T, Obata K, 1997. Cleft palate and decreased brain gamma-aminobutyric acid in mice lacking the 67-kDa isoform of glutamic acid decarboxylase. Proc Natl Acad Sci U S A 94, 6496–6499. 10.1073/pnas.94.12.6496 - DOI - PMC - PubMed
    1. Bartos M, Vida I, Jonas P, 2007. Synaptic mechanisms of synchronized gamma oscillations in inhibitory interneuron networks. Nat. Rev. Neurosci 8, 45–56. 10.1038/nrn2044 - DOI - PubMed

Publication types