. 2019 Aug 5;218(8):2782-2796.
doi: 10.1083/jcb.201904004. Epub 2019 Jul 11.

Quantitative glycoproteomics reveals new classes of STT3A- and STT3B-dependent N-glycosylation sites

Affiliations

Quantitative glycoproteomics reveals new classes of STT3A- and STT3B-dependent N-glycosylation sites

Natalia A Cherepanova et al. J Cell Biol. .

Abstract

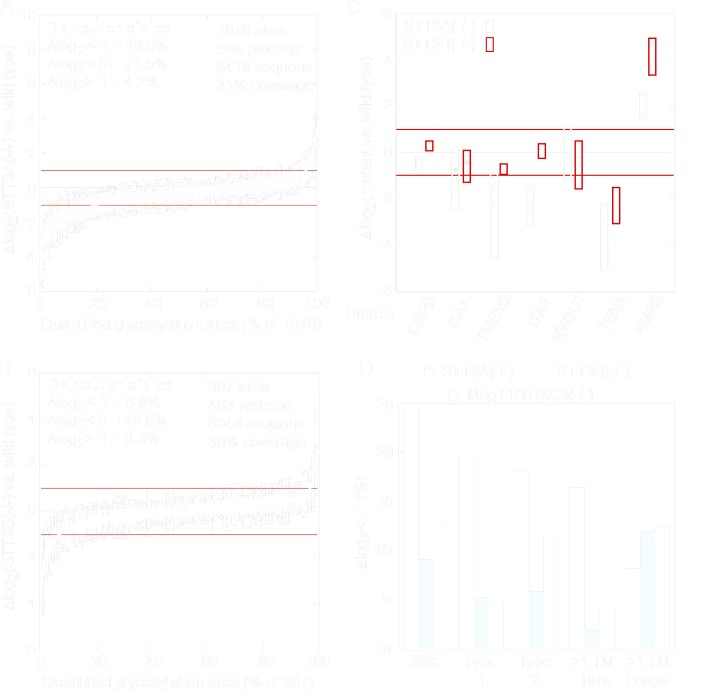
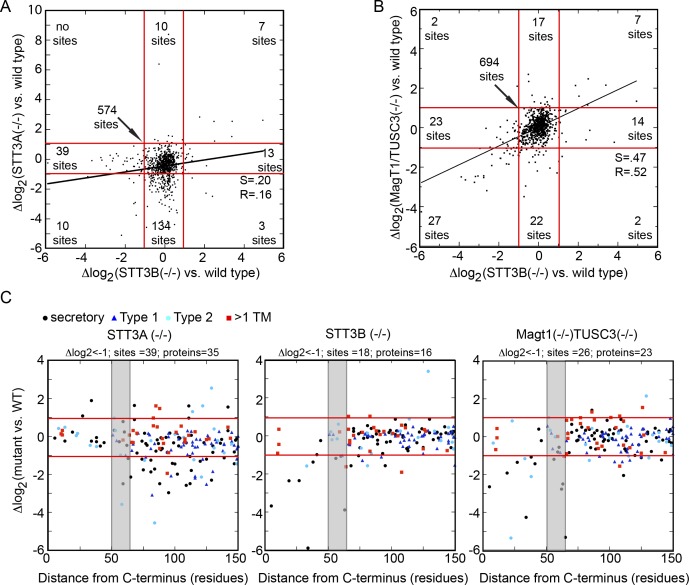
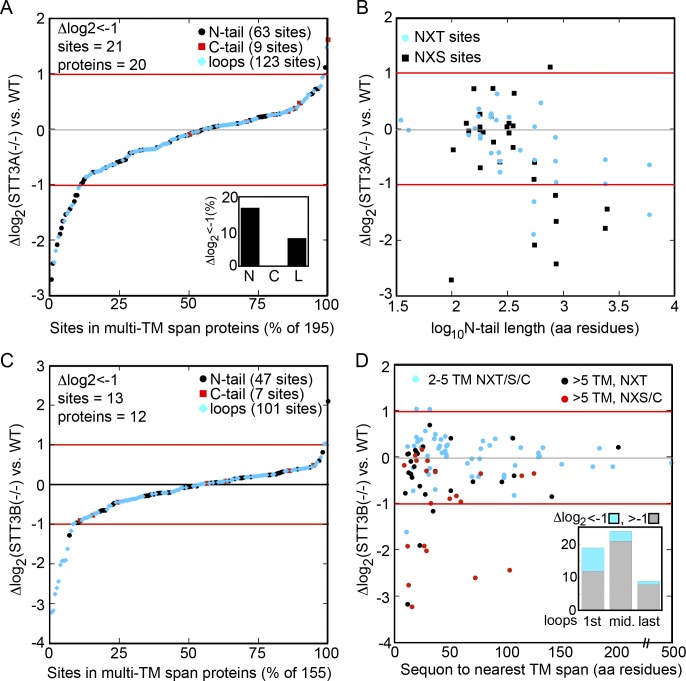
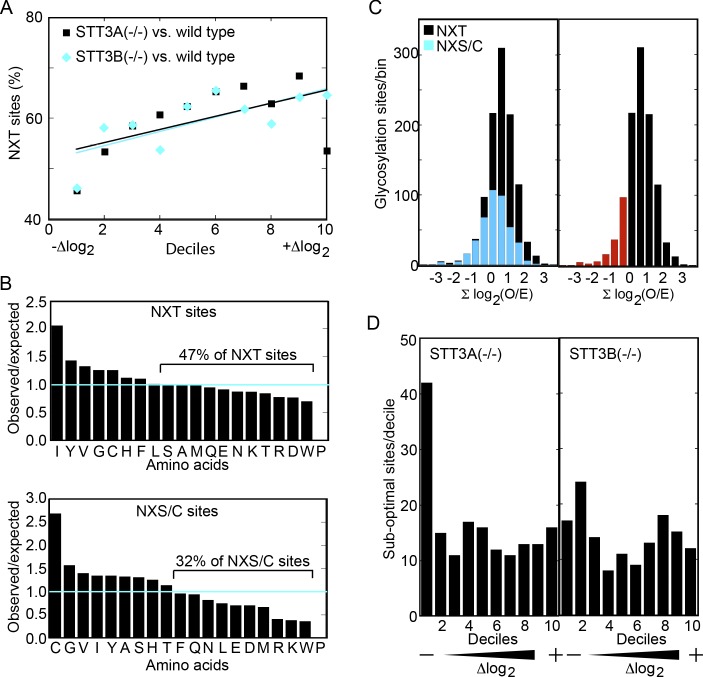
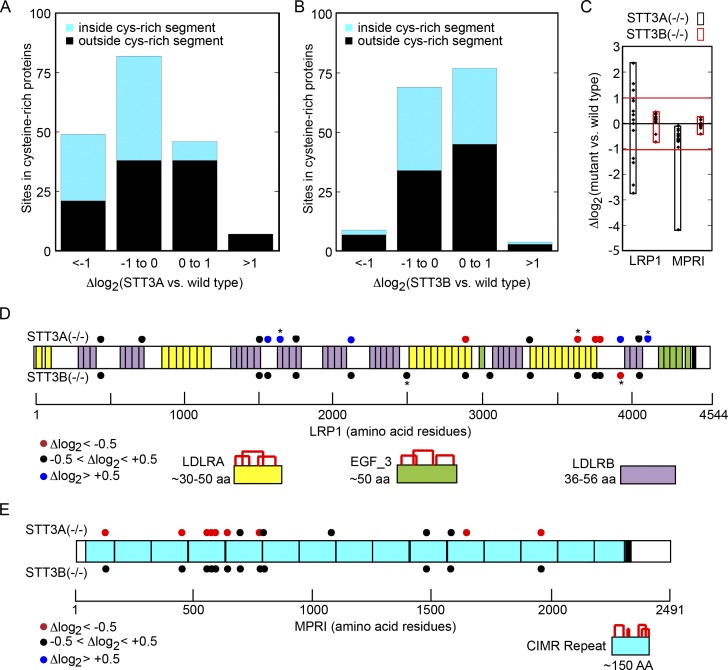
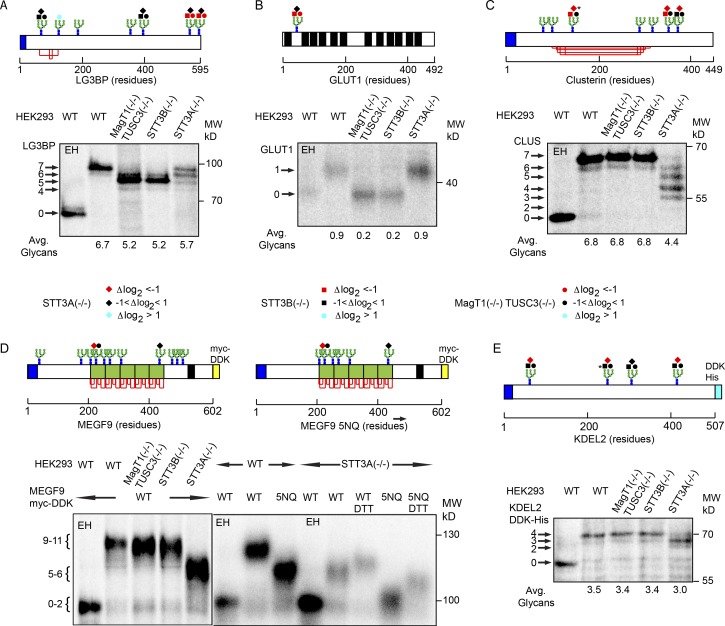
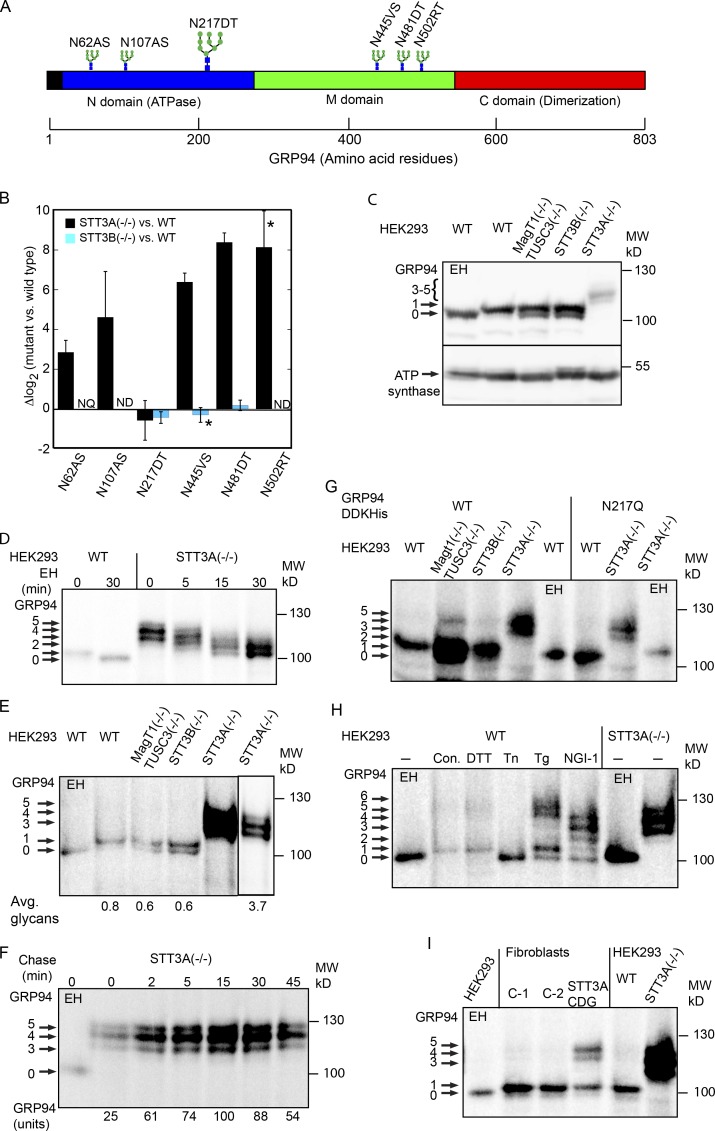
Human cells express two oligosaccharyltransferase complexes (STT3A and STT3B) with partially overlapping functions. The STT3A complex interacts directly with the protein translocation channel to mediate cotranslational glycosylation, while the STT3B complex can catalyze posttranslocational glycosylation. We used a quantitative glycoproteomics procedure to compare glycosylation of roughly 1,000 acceptor sites in wild type and mutant cells. Analysis of site occupancy data disclosed several new classes of STT3A-dependent acceptor sites including those with suboptimal flanking sequences and sites located within cysteine-rich protein domains. Acceptor sites located in short loops of multi-spanning membrane proteins represent a new class of STT3B-dependent site. Remarkably, the lumenal ER chaperone GRP94 was hyperglycosylated in STT3A-deficient cells, bearing glycans on five silent sites in addition to the normal glycosylation site. GRP94 was also hyperglycosylated in wild-type cells treated with ER stress inducers including thapsigargin, dithiothreitol, and NGI-1.


Figures

Figure 1.
Figure 1.
Quantitative glycoproteomics of HEK293 derived cell lines. Reduced N-glycosylation of acceptor sites in cell lines that lack STT3A (A) or STT3B (B). Differences in glycosylation site occupancy are expressed as Δlog2. The blue lines are the mean Δlog2 values from two or more LC-MS/MS experiments. Error bars are SDs (n = 3–8) or individual data points (n = 2). The number of quantified sites, proteins from which they are derived, predicted sites, and calculated coverage are shown. (C) The Δlog2 values for selected glycoproteins with three or more quantified sites. Color-coded boxes indicate the dataset and highlight the Δlog2 range. (D) Percentage of glycosylation sites in different protein classes with Δlog2 < −1.
Figure 2.
Figure 2.
Loss of the STT3A or STT3B impacts different sequons. (A) Scatter plot of 790 sites shared by the STT3A−/− and STT3B−/− datasets. (B) Scatter plot of 808 sites shared by the STT3B−/− and MAGT1/TUSC3−/− datasets. (C) Glycosylation of sequons in the C-terminal 150 residues of proteins. Color codes designate protein classes. The number of C-terminal sites (C-terminal 150 residues, Δlog2 < −1) and proteins from which they are derived are shown above each panel. The gray shaded area designates a region (50–65 residues) of decreasing STT3B dependence (Shrimal et al., 2013b).
Figure 3.
Figure 3.
Glycosylation of multi-TM proteins. (A) The Δlog2 values for sites located in loops (L) or N- or C-terminal tails (N- or C-tails, respectively) of multi-TM proteins in STT3A−/− cells. Sites in N-terminal tails are enriched in the negative zone (inset, Δlog2 < −1). (B) The Δlog2 values for sites in the N-terminal tails are plotted versus tail length (log10) and color-coded for sequon type (NXT vs. NXS). (C) The Δlog2 values for sites located in loops or in N- or C-terminal tails of multi-TM proteins in STT3B−/− cells. (D) The Δlog2 values for sites located in loops are plotted versus the distance between the sequon and the closest TM span and color-coded for sequon type (NXT vs. NXS) and number of TM spans. Most of the affected sites (Δlog2 < −1) in proteins with more than five TM spans are located in the first lumenal loop of the protein (see inset). For proteins with more than three lumenal loops, the middle (mid.) category includes all lumenal loops except the first and last. (A and C) The number of sites (Δlog2 < −1) and proteins from which they are derived is shown.
Figure 4.
Figure 4.
N-glycosylation of suboptimal sequons. (A) The STT3A and STT3B datasets were divided into deciles based on Δlog2 values. The percentage of NXT sites in each decile is shown. (B) The distribution of amino acids at the X position of 1,263 NXT sites and 906 NXS sites plus 21 NXC sites was determined. The results are expressed as an O/E ratio. O/E ratios were calculated for the −2, −1, +1(X), +2, and +3 positions (Table S5). (C) Acceptor site flanking scores (Tables S2 B and S3 B) that were calculated as the sum of the log2 O/E for the five residues (−2 to +3) are shown for the STT3A dataset. The number of NXT sites and NXS/C sites in half-unit bins is plotted (left panel). Glycosylation sites with a flanking score <0 (red bars) are potential suboptimal sites. (D) The distribution of suboptimal sites in each decile of the STT3A and STT3B datasets.
Figure 5.
Figure 5.
Glycosylation of cysteine-rich proteins. (A and B) Distribution of glycosylation sites in cysteine (cys)–rich domains of cysteine-rich proteins. Cysteine-rich domains are defined in Materials and methods. (C) The Δlog2 values for quantified sites in LRP1 and MPRI. Color-coded boxes specify the dataset and Δlog2 range. (D) Quantified acceptor sites in LRP1 are displayed as color-coded circles that flank the domain diagram showing cysteine-rich (LDLRA and EGF_3) and cysteine-deficient (LDLRB) domains. Red lines designate disulfides. Glycosylation sites marked by asterisks were quantified in a single LC-MS/MS experiment. (E) Quantified acceptor sites in MPRI are shown as color coded circles that flank the domain diagram showing the cysteine-rich CIMR repeats. TM spans (D and E) are indicated by black bars.
Figure 6.
Figure 6.
Pulse labeling of selected glycoproteins. (A–E) Blue and black segments designate signal sequences and TM spans respectively; red lines are disulfides. The disulfide pattern for KDEL2 is unknown. Color-coded symbols are defined below panels A–C. EH designates digestion with EH. Asterisks in panels C and E indicate sites that were quantified in a single LC-MS/MS experiment. Pulse labeled glycoproteins (10 min, 35S Trans label) were immunoprecipitated, resolved by SDS-PAGE, and quantified by phosphor image analysis (see Materials and methods). (A–C and E) Quantification is for the experiment shown, which is representative of two or more pulse labeling experiments. (D) The MEGF9 5NQ mutant lacks the acceptor sites outside the EGF_3 repeats (green blocks). As indicated, cells were preincubated with 3 mM DTT for 5 min before and during the pulse labeling period. The vertical line designates images derived from separate experiments aligned to show comparable mobilities for glycosylated MEGF9 and EH-digested MEGF9.
Figure 7.
Figure 7.
Hyperglycosylation of GRP94. (A) The domain structure and location of glycosylation sites in GRP94. (B) The Δlog2 values for GRP94 sites in STT3A−/− and STT3B−/− cells. Error bars designate SDs (n = 3–8) unless denoted by an asterisk (n = 2). Not quantifiable (NQ) and not detected (ND) report results for the STT3B−/− cells. (C) Protein (50 µg) in lysates from WT and mutant cells was analyzed by protein immunoblotting using antisera to GRP94 and the α-subunit of ATP synthase. EH designates digestion with EH. (D) EH digestion time course of pulse-labeled GRP94. (E) Pulse labeling of GRP94 in similar numbers of WT and mutant cells. The right hand lane is a lighter version of the preceding lane. (F) Pulse labeling (5 min) of GRP94 in STT3A−/− cells followed by the indicated chase times. (G) Pulse labeling of human GRP94-DDK-His and GRP94-DDK-His N217Q mutant in WT and mutant cells. (H) Pulse labeling of GRP94 in WT or STT3A−/− cells treated with the following compounds: DTT (200 µm), tunicamycin (Tn, 0.6 µM), thapsigargin (Tg, 0.1 µM), and NGI-1 (10 µM). (I) Pulse labeling of GRP94 in control fibroblasts (C-1 and C-2), STT3A-CDG fibroblasts, and WT and STT3A−/− cells. The EH-digested sample is from the STT3A−/− cells and is equivalent to 10% of the undigested sample.

References

    1. Bai L., Wang T., Zhao G., Kovach A., and Li H.. 2018. The atomic structure of a eukaryotic oligosaccharyltransferase complex. Nature. 555:328–333. 10.1038/nature25755 - DOI - PMC - PubMed
    1. Bause E. 1984. Model studies on N-glycosylation of proteins. Biochem. Soc. Trans. 12:514–517. 10.1042/bst0120514 - DOI - PubMed
    1. Braunger K., Pfeffer S., Shrimal S., Gilmore R., Berninghausen O., Mandon E.C., Becker T., Förster F., and Beckmann R.. 2018. Structural basis for coupling protein transport and N-glycosylation at the mammalian endoplasmic reticulum. Science. 360:215–219. 10.1126/science.aar7899 - DOI - PMC - PubMed
    1. Chen M.M., Glover K.J., and Imperiali B.. 2007. From peptide to protein: comparative analysis of the substrate specificity of N-linked glycosylation in C. jejuni. Biochemistry. 46:5579–5585. 10.1021/bi602633n - DOI - PubMed
    1. Chen W., Helenius J., Braakman I., and Helenius A.. 1995. Cotranslational folding and calnexin binding during glycoprotein synthesis. Proc. Natl. Acad. Sci. USA. 92:6229–6233. 10.1073/pnas.92.14.6229 - DOI - PMC - PubMed

Publication types