. 2019 Jul 23;116(30):15272-15281.
doi: 10.1073/pnas.1907962116. Epub 2019 Jul 11.

The role of the optic tectum for visually evoked orienting and evasive movements

Affiliations

The role of the optic tectum for visually evoked orienting and evasive movements

Daichi G Suzuki et al. Proc Natl Acad Sci U S A. .

Abstract

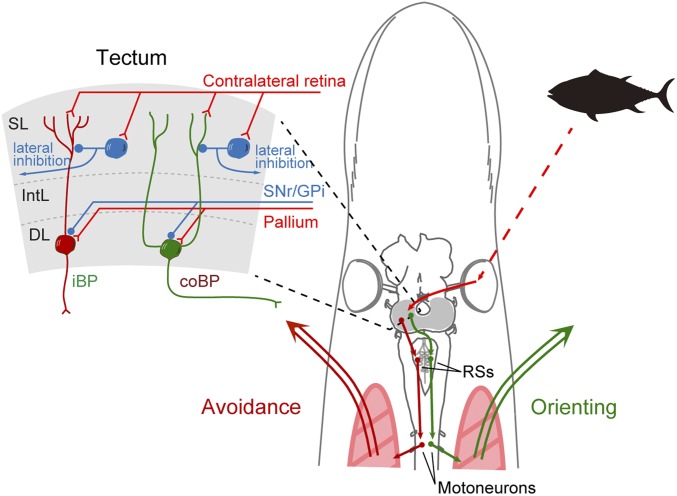
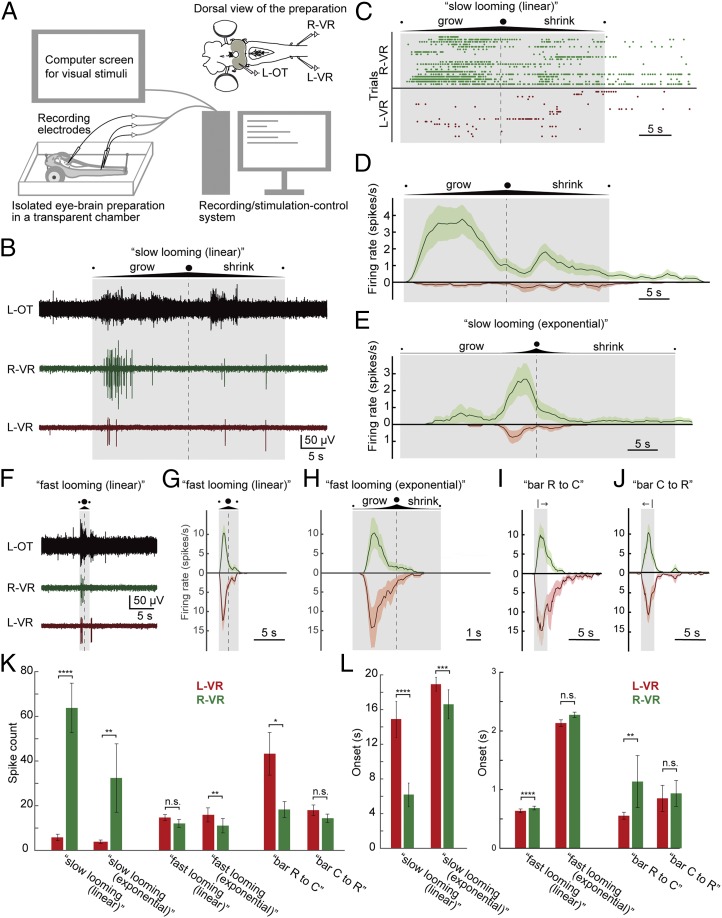
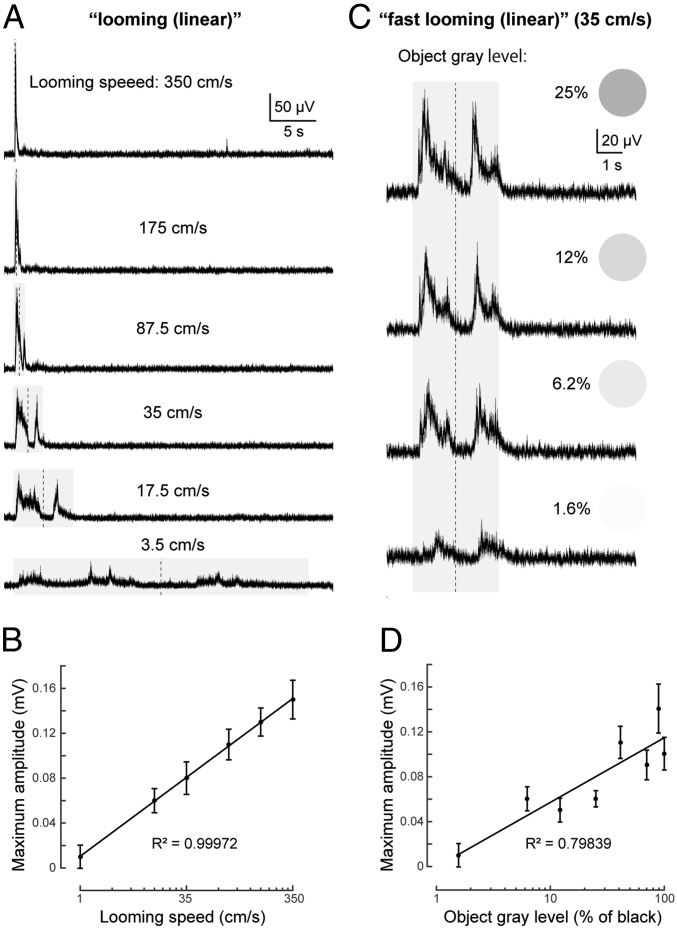
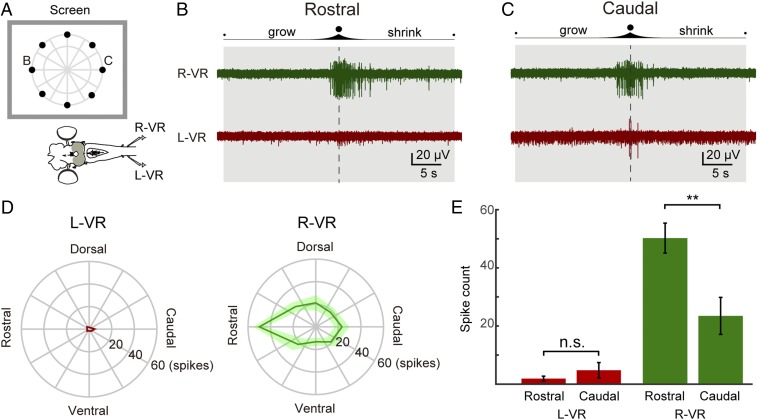
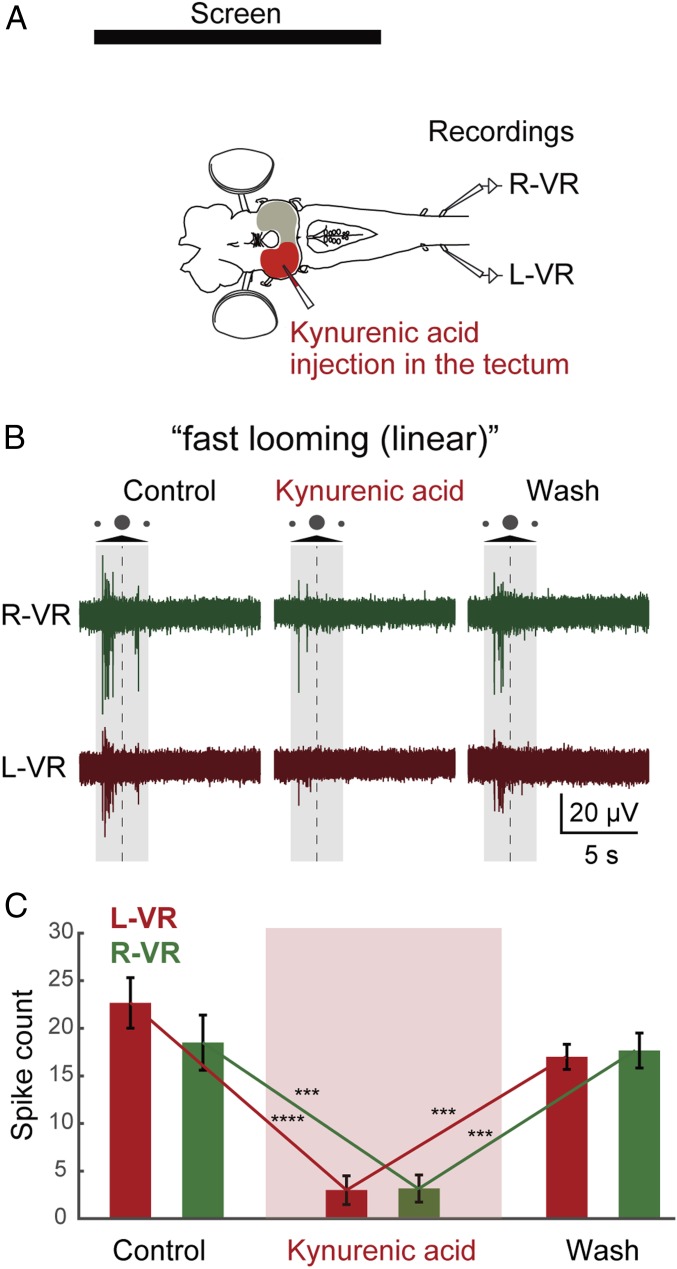
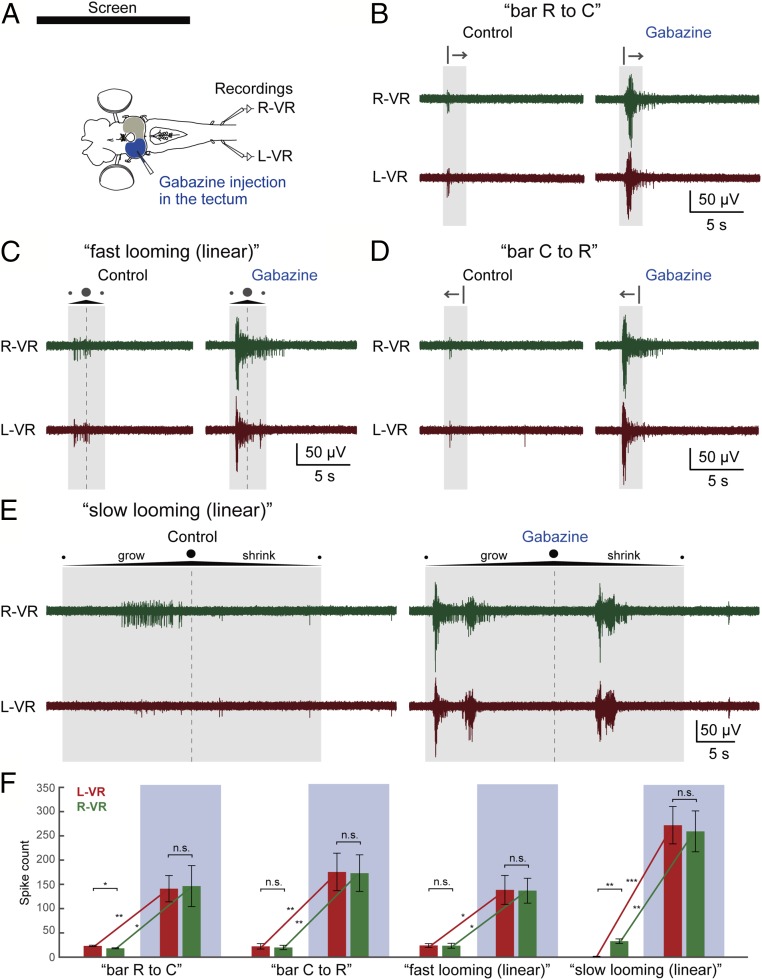
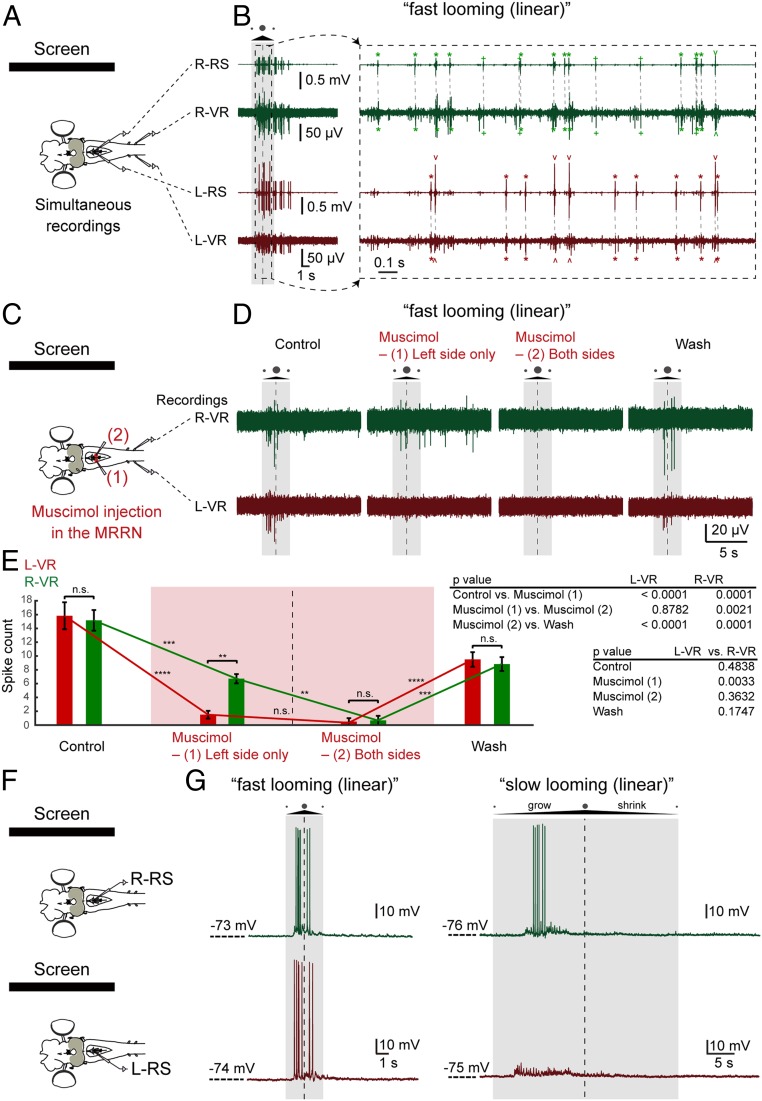
As animals forage for food and water or evade predators, they must rapidly decide what visual features in the environment deserve attention. In vertebrates, this visuomotor computation is implemented within the neural circuits of the optic tectum (superior colliculus in mammals). However, the mechanisms by which tectum decides whether to approach or evade remain unclear, and also which neural mechanisms underlie this behavioral choice. To address this problem, we used an eye-brain-spinal cord preparation to evaluate how the lamprey responds to visual inputs with distinct stimulus-dependent motor patterns. Using ventral root activity as a behavioral readout, we classified 2 main types of fictive motor responses: (i) a unilateral burst response corresponding to orientation of the head toward slowly expanding or moving stimuli, particularly within the anterior visual field, and (ii) a unilateral or bilateral burst response triggering fictive avoidance in response to rapidly expanding looming stimuli or moving bars. A selective pharmacological blockade revealed that the brainstem-projecting neurons in the deep layer of the tectum in interaction with local inhibitory interneurons are responsible for selecting between these 2 visually triggered motor actions conveyed through downstream reticulospinal circuits. We suggest that these visual decision-making circuits had evolved in the common ancestor of vertebrates and have been conserved throughout vertebrate phylogeny.

Keywords: evolution; superior colliculus; visuomotor transformation.


Conflict of interest statement

The authors declare no conflict of interest.

Figures

Fig. 1.
Fig. 1.
Tectal neural circuits for visual behavior. (Left) Optic tectum has 3 main layers. Visual inputs from the contralateral retina target the superficial layer (SL), where most GABAergic interneurons (blue) are sparsely distributed. The intermediate layer (IntL) receives inputs from other brain centers, including the substance nigra pars reticulata (SNr), globus pallidus interna (GPi), and pallium. In the deep layer (DL), there are contralaterally and ipsilaterally brainstem-projecting neurons (coBP and iBP, respectively). (Right) In the lamprey, visual information (a fish silhouette here) selectively activates coBP or iBP neurons, which elicit muscle contraction on each side via reticulospinal neurons (RSs) and spinal motoneurons, resulting in orienting or avoidance movement, respectively.
Fig. 2.
Fig. 2.
Motor response to looming/bar visual stimuli applied at different speeds. (A) Schematic illustration of the experimental system. (Top Right) Isolated eye–brain preparation was placed in a cooling chamber perfused with aCSF, and neural activity was recorded from the left optic tectum (L-OT) and ventral roots on both sides (left ventral root [L-VR] and right ventral root [R-VR]). A computer screen for presenting visual stimuli was placed on the right side of the preparation connected to a computer, which was used to synchronously control the recordings and the visual stimulation. (B) Tectal and ventral root activity evoked by the “slow looming (linear)” visual stimuli (a looming dot on white background, linearly expanding to cover the entire screen at the maximum limit and then shrinking at 3.5 cm⋅s−1). The duration of the stimulus and the point of maximum expansion are shown by a shaded box and a dashed line, respectively. Note that the ventral root on the orienting right side (green) is more strongly activated, compared with the left side (red). (C) Raster plots for “slow looming (linear)” showing the evoked spikes in the ventral roots over time for 20 trials. (D) PSTH for “slow looming (linear)” stimuli showing spike probability through time, combining data from the raster plots. Data are represented as mean ± SEM. (E) PSTHs for “slow looming (exponential)” based on 10 trials. Here “exponentially” growing (and shrinking) dots are used to simulate a situation where a circular project approaches the eye with constant speed (the diameter of the circle increases/decreases 1.35-fold per second). Similar to the “slow looming (linear),” “slow looming (exponential)” stimuli also preferentially evoke ventral root activity on the orienting right side (green). (F) Tectal and ventral root activity evoked by “fast looming (linear)” visual stimuli, 10-fold faster than “slow looming (linear)” (i.e., growing and shrinking 35 cm⋅s−1 on the screen). (G) PSTHs for “fast looming (linear)” visual stimuli based on 27 trials. Note that the ventral roots on both sides are activated. (H) PSTHs for “fast looming (exponential)” stimuli (the diameter of the circle increases/decreases 18.7-fold per second) based on 10 trials. Likewise, the ventral roots on both sides are activated. (I and J) PSTHs for visual stimuli consisting of black vertical bars moving from rostral to caudal (based on 16 trials) or from caudal to rostral (21 trials) with respect to the animal (with a total stimulus duration in both cases of 2.1 s). (I) When the bar moves rostral to caudal (“bar R to C”), it tends to activate the ventral roots on the evasive left side more than on the right orienting side. (J) On the other hand, when the bar moves caudal to rostral (“bar C to R”), it evokes ventral root activity on both sides in a more symmetrical manner. (K) Plots showing the average spike counts from L-VR and R-VR, respectively, for “slow looming (linear),” “slow looming (exponential),” “fast looming (linear),” “fast looming (exponential),” “bar R to C,” and “bar R to C” stimuli (also SI Appendix, Table S1). Data are represented as mean ± SEM. Slow looming stimuli evoke significantly more spikes in the ventral root on the (orienting) right side than on the left side. On the other hand, threatening-like stimuli (fast looming dots and bars) tend to activate the evasive left side stronger than the right side. (L) Plots showing the average onset. Data are represented as mean ± SEM (P values are provided in SI Appendix, Table S1). Note that different scales are used between slow looming stimuli and the others. Slow looming stimuli evoke spikes on the orienting right side significantly earlier than on the left side, while threatening-like stimuli tend to elicit activity on the evasive left side earlier than on the right side. *P < 0.05, **P < 0.01, ***P < 0.001, ****P < 0.0001. n.s., no statistical significance.
Fig. 3.
Fig. 3.
Tectal responses to looming stimuli at different speeds and contrast. (A) Averaged (10 trials each) LFPs recorded from the deep layer of tectum for “looming” (linear) stimuli at different speeds, from 3.5 to 350 cm⋅s−1. Stimulus duration is shown by the shaded area, and the vertical dotted line shows the point of maximum expansion. (B) Graph showing the strong log-linear correlation between maximum amplitude of LFPs and relative speed. Data are represented as mean ± SEM. (C) Averaged (of 10 trials each) tectal LFPs evoked by “fast looming (linear)” stimuli (35 cm⋅s−1) with different levels of gray (1.6%, 6.2%, 12%, and 25%; with 0% being white and 100% black). Averaged LFPs in response to a black looming stimulus (100% gray) with the same speed (35 cm⋅s−1) can be seen in Fig. 3A. (D) Graph showing the log-linear correlation between maximum amplitude of LFPs and the object gray level. Data are represented as mean ± SEM.
Fig. 4.
Fig. 4.
Tectal responses to looming stimuli of different colors. (A) Averaged (10 trials each) tectal LFPs in response to red, green, and blue “fast looming (linear)” visual stimuli on a white background. The shaded area indicates the duration of the stimulus, and the vertical dotted line indicates the point of maximum expansion. (B) Plots showing the average maximum amplitude of LFPs. Data are represented as mean ± SEM (P = 0.3679). (C) Averaged (10 trials each) tectal LFPs for red, green, and blue “fast looming (linear)” visual stimuli on a brightness-adjusted background (Material and Methods). (D) Plots showing the average maximum amplitude of LFPs, demonstrating that all colors can be distinguished from backgrounds with the same brightness. Data are represented as mean ± SEM (P = 0.8700). n.s., no statistical significance.
Fig. 5.
Fig. 5.
Anterior visual field evokes the strongest orienting-like response. (A) Schematic illustration showing the 8 positions in which the “slow looming (linear)” stimuli were presented. The evoked motor outputs were monitored by recordings from the left and right ventral roots (L-VR and R-VR, respectively). (B) Representative response to a stimulus presented in a rostral position. The duration of the stimulus and the moment of maximum expansion are indicated by a shaded area and a vertical dotted line, respectively. Strong activity was observed in the R-VR (green trace), whereas no activity was detected in the L-VR (red trace). (C) Representative response to a stimulus presented in a caudal position. Compared with rostral stimuli, less activity was evoked in the R-VR (green trace), whereas more activity was evoked in the L-VR (red trace) compared with rostrally evoked responses. (D) Polar plots showing L-VR and R-VR average firing counts for each of the 8 positions. (E) Plots showing the average spike counts (of 9 trials) from the L-VR (Left, red) and R-VR (Right, green) in response to rostral and caudal visual stimuli, showing that rostral visual stimuli evoke activity on the orienting right side is significantly stronger than for caudal stimuli. Data are represented as mean ± SEM (P = 0.3255 for L-VR, P = 0.0073 for R-VR). n.s., no statistical significance.
Fig. 6.
Fig. 6.
Optic tectum mediates visually evoked ventral root responses. (A) Kynurenic acid injection in the optic tectum. L-VR, left ventral root; R-VR, right ventral root. (B) After kynurenic acid injection, motor responses to visual stimuli from both the L-VR and R-VR were totally abolished. The shaded area indicates the duration of the stimulus, and the dotted line indicates the moment of maximum expansion. (C) This observation is supported by the statistical analysis when comparing average spike counts (of 14 trials) from the L-VR and R-VR, between control and kynurenic acid (P < 0.0001 for L-VR, P = 0.0004 for R-VR) and kynurenic acid and washout (P = 0.0003 for L-VR, P = 0.0007 for R-VR). Data are represented as mean ± SEM. ***P < 0.001, ****P < 0.0001.
Fig. 7.
Fig. 7.
Tectal inhibitory system contributes to the stimulus type-dependent motor responses. (A) Gabazine injection in the tectum. L-VR, left ventral root; R-VR, right ventral root. (BE) After gabazine injection, drastic enhancement of the ventral root activity was observed on both sides, abolishing the stimulus-type dependency. Note that the “slow looming (linear)” stimulus strongly activates ventral roots on both sides after the gabazine injection. The shaded area and the dotted line show the duration of the stimulus and the moment of maximum expansion, respectively. (F) This observation is supported by the statistical analysis when comparing average spike counts (of 6 trials) from the L-VR (Left, red) and R-VR (Right, green) between control and gabazine injection (blue-shaded). Data are represented as mean ± SEM (“bar R to C”: P = 0.0136 for L-VR vs. R-VR before injection, P = 0.8326 for L-VR vs. R-VR after injection, P = 0.0068 for before vs. after injection in L-VR, P = 0.0285 for before vs. after injection in R-VR; “bar C to R”: P = 0.3737 for L-VR vs. R-VR before injection, P = 0.7588 for L-VR vs. R-VR after injection, P = 0.0073 for before vs. after injection in L-VR, P = 0.0062 for before vs. after injection in R-VR; “fast looming [linear]”: P = 0.8074 for L-VR vs. R-VR before injection, P = 0.8682 for L-VR vs. R-VR after injection, P = 0.0177 for before vs. after injection in L-VR, P = 0.0118 for before vs. after injection in R-VR; “slow looming [linear]”: P = 0.0010 for L-VR vs. R-VR before injection, P = 0.2654 for L-VR vs. R-VR after injection, P = 0.0009 for before vs. after injection in L-VR, P = 0.0026 for before vs. after injection in R-VR). *P < 0.05, **P < 0.01, ***P < 0.001. n.s., no statistical significance.
Fig. 8.
Fig. 8.
Reticulospinal control of visual responses. (A) Simultaneous recordings from left (L) or right (R) reticulospinal neurons (RSs) and ventral roots (VRs). (B) When “fast looming (linear)” visual stimuli were applied, burst responses on both sides from reticulospinal neurons, as well as ventral roots, were observed (Left) with firing correlation between reticulospinal neurons and ventral roots on the respective sides (Right, smaller time scale). Correlated neural activity between reticulospinal neurons and ventral roots is shown with asterisks (*), regular/inverted caret (ˆ), and plus (+) signs. The duration of the stimulus and the moment of maximum expansion are indicated by a shaded area and a vertical dotted line, respectively. (C) Sequential muscimol injection in the left and right MRRN. (D) After the first muscimol injection (left MRRN), L-VR activity was selectively inactivated, followed by total inactivation of ventral root activity after the subsequent second injection (right MRRN). (E) This observation is supported by the statistical analysis comparing average spike counts (of 7 trials) from the L-VR and R-VR between control (before muscimol injection) and first injection, first and second injection, and second injection and washout. Data are represented as mean ± SEM ( **P < 0.01, ***P < 0.001, ****P < 0.0001). n.s., no statistical significance. (F) Intracellular recordings of reticulospinal neurons in the left and right MRRN. (G, Left) Reticulospinal neurons on both the left and right sides were responsive to “fast looming (linear)” stimuli. (G, Right) All “fast looming” stimuli-responsive neurons on the right side also responded to the “slow looming (linear)” stimuli (n = 6 of 6), whereas neurons on the left side rarely responded to this type of stimuli (n = 2 of 7).

References

    1. Cohen J. D., Castro-Alamancos M. A., Neural correlates of active avoidance behavior in superior colliculus. J. Neurosci. 30, 8502–8511 (2010). - PMC - PubMed
    1. Kaas J. H., Topographic maps are fundamental to sensory processing. Brain Res. Bull. 44, 107–112 (1997). - PubMed
    1. Krauzlis R. J., Lovejoy L. P., Zénon A., Superior colliculus and visual spatial attention. Annu. Rev. Neurosci. 36, 165–182 (2013). - PMC - PubMed
    1. Northmore D., “The optic tectum.” The Encyclopedia of Fish Physiology: From Genome to Environment, Farrell A., Ed. (Academic Press, 2011), pp. 131–142.
    1. Butler A. B., Evolution of brains, cognition, and consciousness. Brain Res. Bull. 75, 442–449 (2008). - PubMed

Publication types

MeSH terms