

doi: 10.3324/haematol.2018.214031.
Epub 2019 Jul 11.
Progression of progenitor B-cell leukemia is associated with alterations of the bone marrow micro-environment
Affiliations
- PMID: 31296580
- PMCID: PMC7049369
- DOI: 10.3324/haematol.2018.214031
Item in Clipboard
Progression of progenitor B-cell leukemia is associated with alterations of the bone marrow micro-environment
Haematologica.
2020 Mar.
No abstract available
Figures
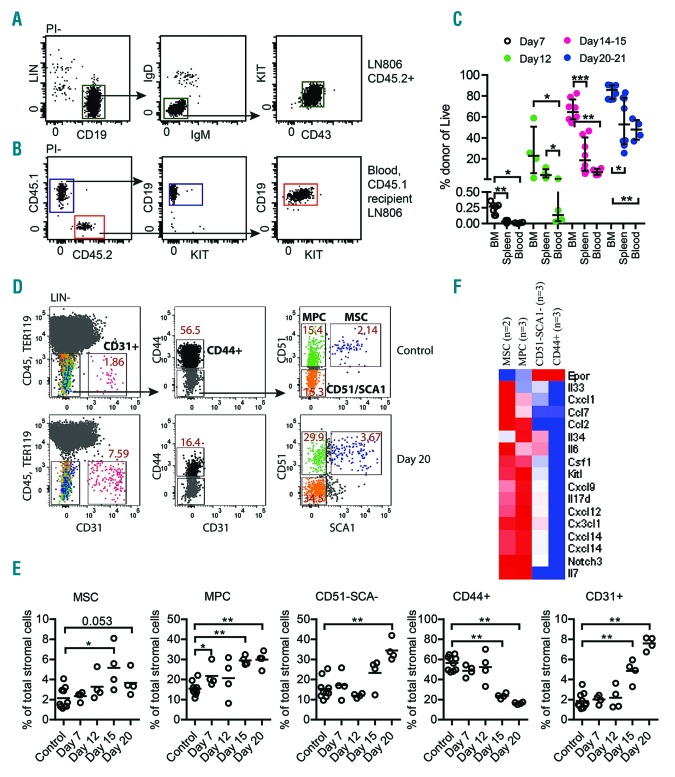
Dynamic analysis of leukemic B-cell progenitors shows sequential engraftment to bone marrow and peripheral tissues. (A) Gating strategy for sorting CD19+IgD–IgM–KIT+CD43+ (tumor) pro-B cells from lymph nodes of mouse (here #806) that suffered spontaneous leukemic disease progression. (B) Gating strategy of CD19+ blood cells analyzed in a 12-16 weeks old CD45.1 Wt recipient transplanted with 100.000 LN806 CD45.2 tumor cells. (C) Graph showing the engraftment levels in different tissues at indicated time points after initial intravenous injection of 100.000 LN806 pro-B tumor cells. The presence of leukemia cells in bone marrow, spleen and blood was analyzed in each individual mouse.(n=27 transplanted mice in total). Each dot represents one mouse and the statistical analysis was performed in GraphPad Prism using the Mann Whitney test, P*≤0.05, P**≤0.01, P***≤0.001. (D) Representative flow plot of the gating strategy used to analyze and sort CD45–TER119–CD31–CD44–CD51+SCA1+ mesenchymal stem cells (MSC), CD45–TER119–CD31–CD44–CD51+SCA1– mesenchymal progenitor cells (MPC), CD45–TER119–CD31–CD44–CD51–SCA1− (CD51–SCA–) cells, CD45–TER119–CD31–CD44+ (CD44+) mature stroma cells and CD45-TER119–CD31+ endothelial cells (CD31+). The upper panel shows a control animal and the lower panel shows bone marrow from a mouse 20 days after the intravenous transplant of B-ALL cells from a leukemic mouse 806. The average percentages of each population out of the total Lin–CD45–TER119– population are indicated in the flow plots. (E) Graphs showing the relative change in stroma populations on indicated time points after transplantation. Total of animals at each time point is: controls n=10, day 7 n=4, day 12 n=4, day 15 n=4, day 20 n=4. Each dot represents one mouse and the statistical analysis was performed in GraphPad Prism using the Mann Whitney test, P*≤0.05, P**≤0.01. (F) Heat map visualizing the RNA expression of a set of genes encoding cytokines in MSC, MPC, CD51–SCA1– and CD44+ Wt stroma populations. For each cell type, a mean expression of the samples is shown.
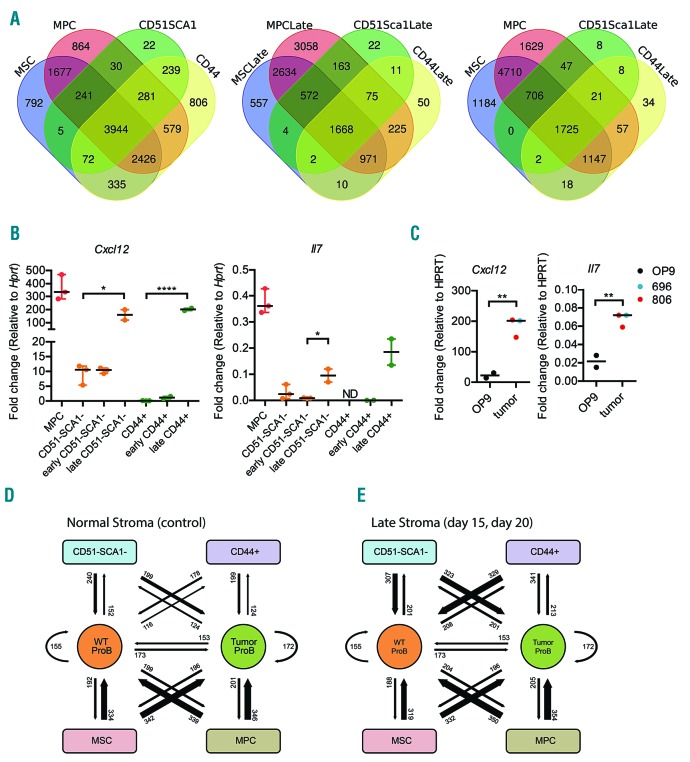
Phenotypic and molecular alterations of bone marrow stromal cell populations following engraftment of leukemic pro-B cells (A) Venn diagrams displaying differences in gene expression patterns in MSC, MPC as well as CD51−SCA− and CD44+ cells in non-transplanted or leukemic mice in late stage disease (Late). To be classified as expressed in any given cell type the gene was expressed with a read MAX ≥ 40 in at least two replicates. (B) Graphs displaying Q-PCR data from stroma populations sorted from bone marrow. The figure indicates the fold expression of Cxcl12 and Il7 relative to Hprt in each population and one dot represents an independent sample analyzed by Q-PCR in triplicate. ND: non detectable. Statistical analysis was performed in GraphPad Prism using unpaired t-test, P* ≤0.05, P****≤0.0001. (C) Q-PCR data analyzing the expression of Il7 and Cxcl12 mRNA in control OP9 stroma cells or in cells co-cultured for five days with B-ALL cells harvested from two different (696, 806) Ebf1+/−Pax5+/− mice. Statistical analysis was performed in GraphPad Prism using unpaired t-test, P**≤0.01, D-E) The panels display schematic views of the theoretical receptor-ligand interactions (represented by a number and an arrow of the relative thickness) between Wt stroma populations and Wt pro-B cells, or Wt stroma populations and tumor pro-B cells in healthy (D) or leukemic mice (E).
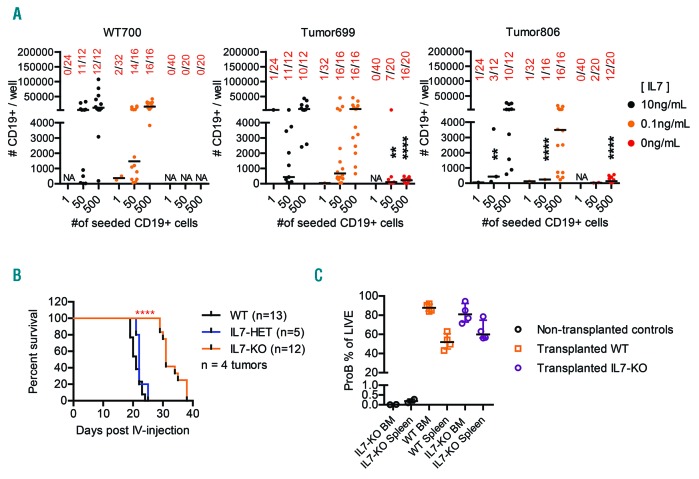
Interleukin-7 deficiency in BM microenvironment impedes progression of B-ALL progression in vivo. (A) Graphs displaying the result of a 10 day in vitro OP9 stroma co-culture of sorted bone marrow Pro-B (LIN-CD19+IgM–IgDCD43+KIT+) from one Wt (700) and two leukemic (699, 806) mice. The numbers on the x-axis are the number of pro-B cells initially sorted per well, while the numbers on y-axis are the total number of CD19+ cells present in the well at the time of analysis, based on counted events by flow cytometry during a fixed time of sample acquisition. The numbers in red are the number of positive wells/total number of seeded wells. The colors of the data dots indicate the concentration of IL7 during cultivation. (B) Kaplan-Meier curves describing the survival of 12-16 weeks old Wt (black line) and IL7-deficient (orange line) mice after intravenous injection with 100,000 sorted pro-B cells from lymph nodes of leukemic Pax5+/−Ebf1+/− mice. A drop in the curve represents euthanasia due to clinical manifestation of leukemia (palpable accessory axillary or subiliac lymph nodes). The overall log-rank (Mantel-Cox test) P value was calculated in GraphPad Prism, P****≤0.0001. The data is the result of a total of three separate experiments, using four different tumors (292, 1103, 697, 686). Each tumor was transplanted to both Wt and IL7-deficient recipients in the same experiment, Wt n=13, IL7−/− n=12. C). Graph showing the percentrage of Pro-B cells of total live cells in the bone marrow and spleen, of Wt and IL7−/− mice at the time of euthanasia.
References
Publication types
MeSH terms
LinkOut - more resources
Full Text Sources
Medical
Molecular Biology Databases
