. 2019 Aug 30;294(35):12921-12932.
doi: 10.1074/jbc.RA118.006425. Epub 2019 Jul 11.

Large-conductance calcium-activated potassium channels mediate lipopolysaccharide-induced activation of murine microglia

Affiliations

Large-conductance calcium-activated potassium channels mediate lipopolysaccharide-induced activation of murine microglia

Xiaoying Yang et al. J Biol Chem. .

Abstract

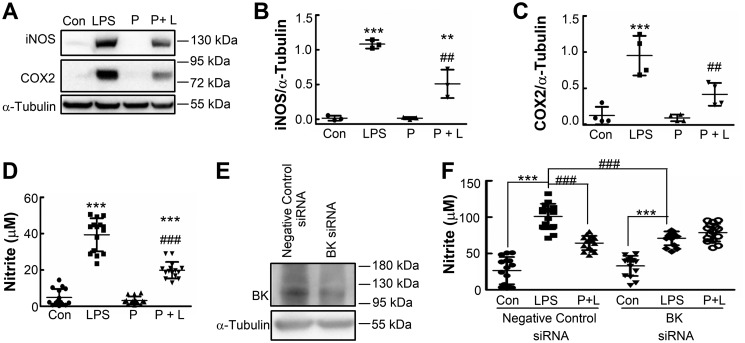
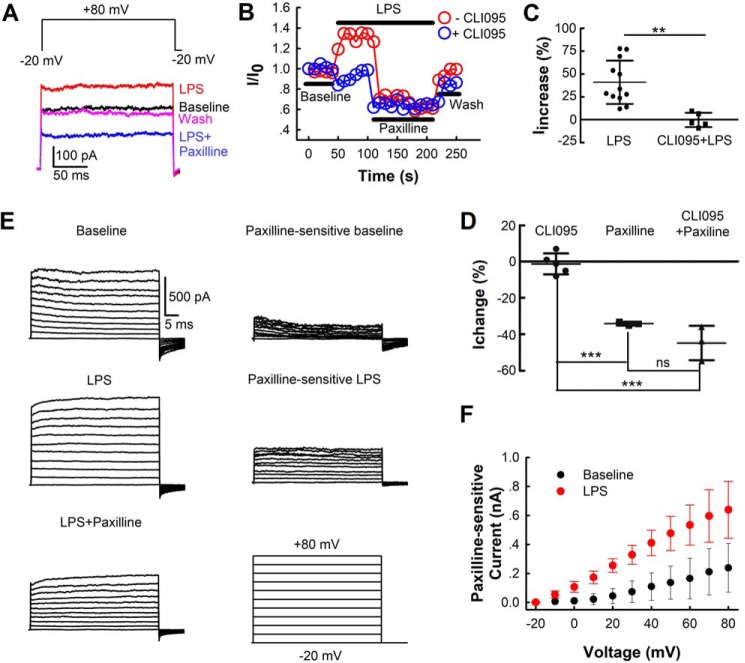
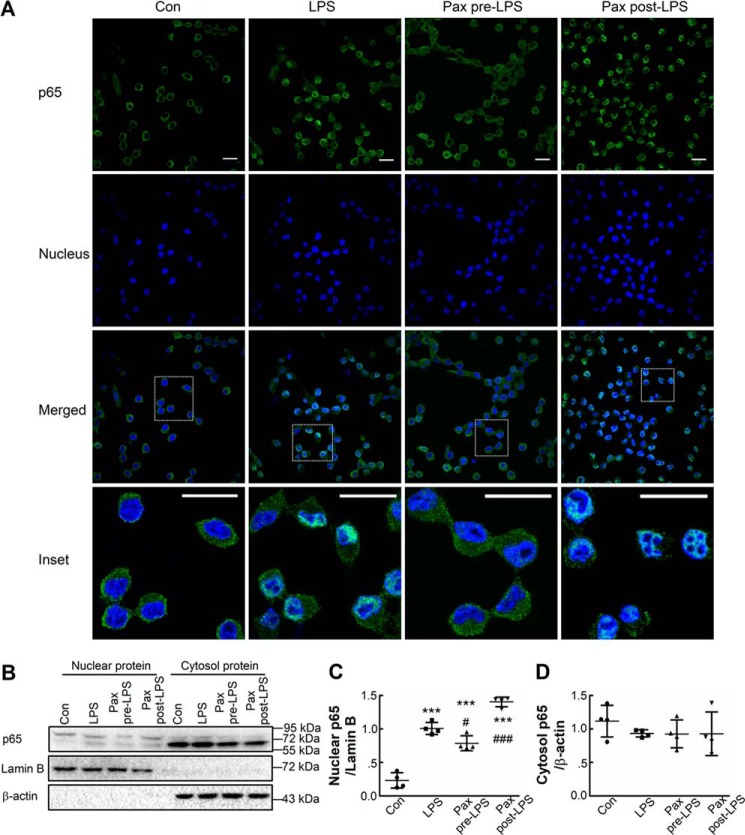
Large-conductance calcium-activated potassium (BK) channels are ubiquitously expressed in most cell types where they regulate many cellular, organ, and organismal functions. Although BK currents have been recorded specifically in activated murine and human microglia, it is not yet clear whether and how the function of this channel is related to microglia activation. Here, using patch-clamping, Griess reaction, ELISA, immunocytochemistry, and immunoblotting approaches, we show that specific inhibition of the BK channel with paxilline (10 μm) or siRNA-mediated knockdown of its expression significantly suppresses lipopolysaccharide (LPS)-induced (100 ng/ml) BV-2 and primary mouse microglial cell activation. We found that membrane BK current is activated by LPS at a very early stage through Toll-like receptor 4 (TLR4), leading to nuclear translocation of NF-κB and to production of inflammatory cytokines. Furthermore, we noted that BK channels are also expressed intracellularly, and their nuclear expression significantly increases in late stages of LPS-mediated microglia activation, possibly contributing to production of nitric oxide, tumor necrosis factor-α, and interleukin-6. Of note, a specific TLR4 inhibitor suppressed BK channel expression, whereas an NF-κB inhibitor did not. Taken together, our findings indicate that BK channels participate in both the early and the late stages of LPS-stimulated murine microglia activation involving both membrane-associated and nuclear BK channels.

Keywords: BK channel; NF-κB (NF-KB); Toll-like receptor 4 (TLR4); cytokine; innate immunity; lipopolysaccharide (LPS); microglia; neuroinflammation.


Conflict of interest statement

The authors declare that they have no conflicts of interest with the contents of this article

Figures

Figure 1.
Figure 1.
Blockade or knockdown of BK channels inhibits LPS-induced activation of BV-2 cells. A–C, BV-2 cells were left untreated (Con) or were treated with LPS (LPS, 100 ng/ml), with paxilline (P, 10 μm) for 24 h, or with paxilline (10 μm) 30 min prior to LPS (100 ng/ml) for 24 h (P + L); cell lysates were immunoblotted with antibodies against iNOS or COX2 (A). Quantification was performed by densitometric analysis of protein bands and normalized to α-tubulin levels. Data are presented as scatter plots; bars represent mean ± S.D. of three (iNOS, B) or 4 (COX2, C) independent experiments, each performed once. Differences among the groups were analyzed by two-way ANOVA with Bonferroni's multiple comparisons post-hoc test (B and C). F(1,8) = 155.61 (p < 0.0001) for LPS; F(1,8) = 20.86 (p = 0.0018) for paxilline; F(1,8) = 20.78 (p = 0.0019) for interaction (B); F(1,12) = 45.61 (p < 0.0001) for LPS; F(1,12) = 11.02 (p = 0.0061) for paxilline; F(1,12) = 8.67 (p = 0.0123) for interaction (C). **, p < 0.01; ***, p < 0.001 compared with the control group; ##, p < 0.01 compared with the LPS group. D, BV-2 cells were treated in the same manner as in A, and supernatants were analyzed for nitrites. Data are presented as a scatter plot; bars represent mean ± S.D. of three independent experiments, each performed in quintuplicate. Differences among the groups were analyzed by two-way ANOVA with Bonferroni's multiple comparisons post-hoc test (F(1,56) = 305.83 (p < 0.0001) for LPS; F(1,56) = 51.99 (p < 0.0001) for paxilline; F(1,56) = 37.21 (p < 0.0001) for interaction). ***, p < 0.001 compared with the control group; ###, p < 0.001 compared with the LPS group. E and F, BV-2 cells were transfected for 24 h with either negative control siRNA oligonucleotides or siRNA oligonucleotides targeting BK mRNA. Transfected cells were either harvested to prepare protein extracts for immunoblotting with anti-BK antibody or anti-α-tubulin antibody (E), or they were further untreated (Con) or treated with LPS (LPS, 100 ng/ml) for 24 h or paxilline (10 μm) 30 min prior to LPS (100 ng/ml) for 24 h (P + L), and then supernatants were analyzed for nitrites (F). Data are presented as a scatter plot; bars represent mean ± S.D. of three independent experiments, each performed in quintuplicate. Differences among the groups were analyzed by two-way ANOVA with Bonferroni's multiple comparisons post hoc test (F). F(2,84) = 129.74 (p < 0.0001) for the type of drug (Con, LPS, P + L); F(1,84) = 1.047 (p = 0.309) for the type of siRNA; F(2,84) = 21.33 (p < 0.0001) for interaction between drug and siRNA. ***, p < 0.001 compared with the control group; ###, p < 0.001 compared with the LPS group.
Figure 2.
Figure 2.
Effects of LPS on membrane BK currents in BV-2 cells. A, exemplar whole-cell current traces recorded before (baseline) and during application of LPS (100 ng/ml), LPS (100 ng/ml) + paxilline (10 μm), and washing out (wash). Currents were elicited by voltage of +80 mV for 200 ms. The prepulse potential was −20 mV for 20 ms (only the last 0.5 ms are shown), and the repolarization potential was −20 mV. B, time courses of activation of whole-cell current by LPS in the absence or presence of the TLR4 inhibitor CLI095 (2 μm) at +80 mV from two individual whole-cell patches. The steady-state currents before (baseline) and during application of LPS (100 ng/ml), LPS (100 ng/ml) + paxilline (10 μm), and washing out (wash) normalized to the steady-state current of initial baseline (I/I0) were used to plot the traces. Currents were recorded every 10 s. C and D, percentage of whole-cell steady-state currents changed upon various treatments at +80 mV (LPS (C, n = 12 cells from five independent experiments), CLI095 + LPS (C, n = 5 cells from three independent experiments), CLI095 (D, n = 5 cells from two independent experiments), paxilline (D, n = 3 cells from three independent experiments), and CLI095 + paxilline (D, n = 3 cells from two independent experiments)). The steady-state current of average baseline was used to calculate the percentages of current change. Data are presented as means ± S.D. Differences among the groups were analyzed by two-tailed unpaired Student's t tests (C) or one-way ANOVA with Bonferroni's multiple comparisons post hoc test (F(2,8) = 53.13 (p < 0.0001)) (D). **, p < 0.01; ***, p < 0.001; ns = not significant. E left, macroscopic current traces from one whole-cell patch recorded before (baseline) and after LPS (100 ng/ml), LPS (100 ng/ml) + paxilline (10 μm) treatment. Currents were elicited by voltages ranging from −20 to +80 mV for 50 ms with 10-mV increments. The prepulse potential was −20 mV for 20 ms (only the last 0.5 ms shown), and the repolarization potential was −20 mV. Right, paxilline-sensitive baseline (baseline − (LPS + paxilline)) and paxilline-sensitive LPS (LPS − (LPS + paxilline)) currents. F, I-V relations of paxilline-sensitive membrane currents in BV-2 cells before (baseline) and after LPS application. The means of steady-state currents from four individual whole-cell patches were plotted against relative voltages. Bars represent S.D.
Figure 3.
Figure 3.
Pre- rather than post-inhibition of BK channels prevents LPS-induced NF-κB translocation in BV-2 cells. A, BV-2 cells were untreated (Con) or treated with LPS (LPS, 100 ng/ml) for 1 h or with paxilline (10 μm) 30 min prior to (Pax pre-LPS) or 30 min after (Pax post-LPS) LPS (100 ng/ml) for 1 h and were then fixed and stained with anti-p65 antibody (green, p65) and Hoechst 33258 (blue, nucleus), and cells were analyzed using confocal fluorescence microscopy. Insets are enlarged views of the selected rectangle areas. Scale bar, 20 μm. B–D, BV-2 cells were treated in the same manner as in A. Nuclear and cytosolic proteins were extracted and immunoblotted with antibodies against p65, lamin B, or β-actin (B). Quantification was performed by densitometric analysis of protein bands normalized to either lamin B (nuclear p65, C) or β-actin levels (cytosol p65, D). Data are presented as scatter plots; bars represent mean ± S.D. of four independent experiments, each performed once. Differences among the groups were analyzed by one-way ANOVA with Bonferroni's multiple comparisons post hoc test (C and D). F(3,12) = 98.14 (p < 0.0001) for C; F(3,12) = 0.6778 (p = 0.5822) for D.,***, p < 0.001 compared with the control group. #, p < 0.05; ###, p < 0.001 compared with the LPS group.
Figure 4.
Figure 4.
Pre- or post-block of BK channels suppresses LPS-induced activation of BV-2 cells. A and B, BV-2 cells were untreated (Con) or treated with LPS (LPS, 100 ng/ml) for 24 h; paxilline (10 μm) for 30 min prior to (Pax Pre-LPS); or at 30 min (Pax post-LPS 30 min), 1 h (Pax post-LPS 1 h), 3 h (Pax post-LPS 3 h), 6 h (Pax post-LPS 6 h), or 12 h (Pax post-LPS 12 h) after LPS (100 ng/ml) during the 24-h LPS incubation. The supernatants were analyzed for nitrites (A), and cells were analyzed for viability using the MTT assay (B). Data are presented as scatter plots. Each point represents one determination, and the bars represent mean ± S.D. n = 6 from two independent experiments (each performed in triplicate) for control (Con) and LPS; n = 7 from two independent experiments (one performed in triplicate and the other in quadruplicate) for Pax pre-LPS and Pax post-LPS. Differences among the groups were analyzed by one-way ANOVA with Bonferroni's multiple comparisons post hoc test (A and B). F(7,46) = 44.02 (p < 0.0001) for A; F(7,46) = 2.182 (p = 0.0534) for B. ***, p < 0.001 compared with the control group. ##, p < 0.01; ###, p < 0.001 compared with the LPS group. $$, p < 0.01; $$$, p < 0.001 compared with the Pax Pre-LPS group. C and D, BV-2 cells were untreated (Con) or treated with LPS (LPS, 100 ng/ml) for 24 h, paxilline (10 μm) 30 min prior to (Pax Pre-LPS), or 30 min after (Pax post-LPS) LPS (100 ng/ml) for 24 h. The supernatants were analyzed for TNFα (C) and IL-6 (D). Data are presented as scatter plots. Each point represents one determination, and the bars represent mean ± S.D. of two independent experiments, each performed in duplicate. Differences among the groups were analyzed by one-way ANOVA with Bonferroni's multiple comparisons post hoc test (C) or one-way ANOVA with Newman-Keuls' multiple comparisons post hoc test (D). F(3,12) = 381.7 (p < 0.0001) for C; F(3,12) = 56.72 (p < 0.0001) for D. ***, p < 0.001 compared with the control group. ###, p < 0.001 compared with the LPS group. $, p < 0.05 compared with the Pax Pre-LPS group.
Figure 5.
Figure 5.
Nuclear BK channel expression is induced by LPS in BV-2 cells. A, BV-2 cells were treated with LPS (100 ng/ml) for 0, 6, 12, or 24 h, fixed, and immunostained with anti-BK antibody (green, BK) and Hoechst 33258 (blue, nucleus), and then were analyzed by confocal fluorescence microscopy. Scale bar, 40 μm. Insets are enlarged views of the selected rectangle areas, and scale bar represents 20 μm. B and C, nuclear, cytosolic, and whole-cell proteins were extracted and immunoblotted. Quantification performed by densitometric analysis of protein bands was normalized to either lamin B (nuclear BK, C left) or β-actin levels (cytosol BK, C middle; whole-cell BK, C right). D, BV-2 cells were untreated (control) or treated with LPS (100 ng/ml) for 12 h in the absence or presence of either Bay11-7082 (20 μm, specific NF-κB inhibitor) or CLI095 (2 μm, specific TLR4 inhibitor). Quantification performed by densitometric analysis of protein bands was normalized to β-actin levels. Data are presented as scatter plots; bars represent mean ± S.D. of five (Nuclear BK, C left; cytosol BK, C middle; and whole BK, D right) or three (whole BK, C right) independent experiments, each performed once. Differences among the groups were analyzed by one-way ANOVA with Newman-Keuls' multiple comparisons post hoc test (C and D). F(3,16) = 13.15 (p = 0.0001) for C left, Nuclear BK; F(3,16) = 1.694 (p = 0.2082) for C middle, Cytosol BK; F(3,8) = 6.723 (p = 0.0141) for C right, whole BK; F(3,16) = 4.894 (p = 0.0134) for D. *, p < 0.05; ***, p < 0.001 compared with the control group. #, p < 0.05 compared with the LPS group.
Figure 6.
Figure 6.
BK channel modulates primary mouse microglia activation by LPS. A–C, primary mouse microglia were untreated (Con) or treated with LPS (LPS, 100 ng/ml), or paxilline (Pax, 10 μm) for 24 h, or with paxilline (10 μm) 30 min prior to (Pax pre-LPS) or 30 min after (Pax post-LPS) LPS (100 ng/ml) for 24 h. The supernatants were analyzed for nitrites (A), IL-6 (B), and TNFα (C). Data are presented as a scatter plot; bars represent mean ± S.D. of three (A) or two (B and C) independent experiments, each performed in quadruplicate. Differences among the groups were analyzed by one-way ANOVA with Bonferroni's multiple comparisons post hoc test (A–C). F(4,55) = 45.22 (p < 0.0001) for A; F(4,35) = 66.05 (p < 0.0001) for B; F(4,35) = 15.32 (p < 0.0001) for C. ***, p < 0.001 compared with the control group. ##, p < 0.01; ###, p < 0.001 compared with the LPS group. D, primary mouse microglia were untreated (Con) or treated with LPS (LPS, 100 ng/ml) for 1 h, or with paxilline (10 μm) 30 min prior to (Pax pre-LPS) or 30 min after (Pax post-LPS) LPS (100 ng/ml) for 1 h, and were then fixed and stained with anti-p65 antibody (green, p65), anti-Iba1 antibody (red, Iba1), and Hoechst 33258 (blue, nucleus) and were analyzed by confocal fluorescence microscopy. Insets are enlarged views of the selected rectangle areas. Scale bar, 20 μm. E, primary mouse microglia were treated with LPS (100 ng/ml) for 0, 6, 12, or 24 h and then were fixed and immunostained with anti-BK antibody (green, BK), anti-Iba1 antibody (red, Iba1), and Hoechst 33258 (blue, nucleus) and were analyzed by confocal fluorescence microscopy. Insets are enlarged views of the selected rectangle areas. Scale bar, 20 μm.
Figure 7.
Figure 7.
Models of the possible mechanisms underlying BK channel participation in LPS-induced microglia activation. In one scenario, at an early stage of microglia activation, LPS activates membrane BK channels through TLR4 to stimulate NF-κB translocation to the nucleus, which then leads to increased NF-κB-dependent gene transcription in microglia (blue arrows). In another scenario, LPS induces elevation of nuclear BK channel expression through TLR4 in later stages of microglia activation (pink arrows). Both scenarios result in increased cytokine production in microglia (red arrows).

References

    1. Tao J., Lan Z., Wang Y., Hei H., Tian L., Pan W., Zhang X., and Peng W. (2016) Large-conductance calcium-activated potassium channels in glomerulus: from cell signal integration to disease. Front. Physiol. 7, 248 10.3389/fphys.2016.00248 - DOI - PMC - PubMed
    1. Pyott S. J., and Duncan R. K. (2016) BK channels in the vertebrate inner ear. Int. Rev. Neurobiol. 128, 369–399 10.1016/bs.irn.2016.03.016 - DOI - PubMed
    1. Krishnamoorthy-Natarajan G., and Koide M. (2016) BK channels in the vascular system. Int. Rev. Neurobiol. 128, 401–438 10.1016/bs.irn.2016.03.017 - DOI - PubMed
    1. Duncan P. J., and Shipston M. J. (2016) BK channels and the control of the pituitary. Int. Rev. Neurobiol. 128, 343–368 10.1016/bs.irn.2016.03.004 - DOI - PubMed
    1. Contet C., Goulding S. P., Kuljis D. A., and Barth A. L. (2016) BK channels in the central nervous system. Int. Rev. Neurobiol. 128, 281–342 10.1016/bs.irn.2016.04.001 - DOI - PMC - PubMed

Publication types

LinkOut - more resources