Randomized Controlled Trial
. 2019 Jul 12;365(6449):eaau4732.
doi: 10.1126/science.aau4732.

Effects of microbiota-directed foods in gnotobiotic animals and undernourished children

Affiliations
Randomized Controlled Trial

Effects of microbiota-directed foods in gnotobiotic animals and undernourished children

Jeanette L Gehrig et al. Science. .

Abstract

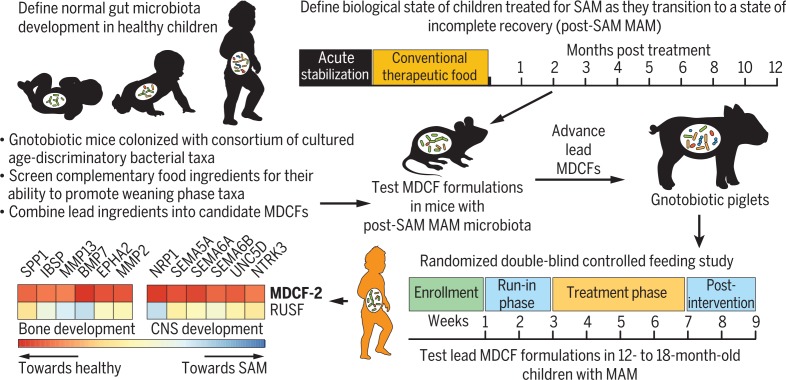
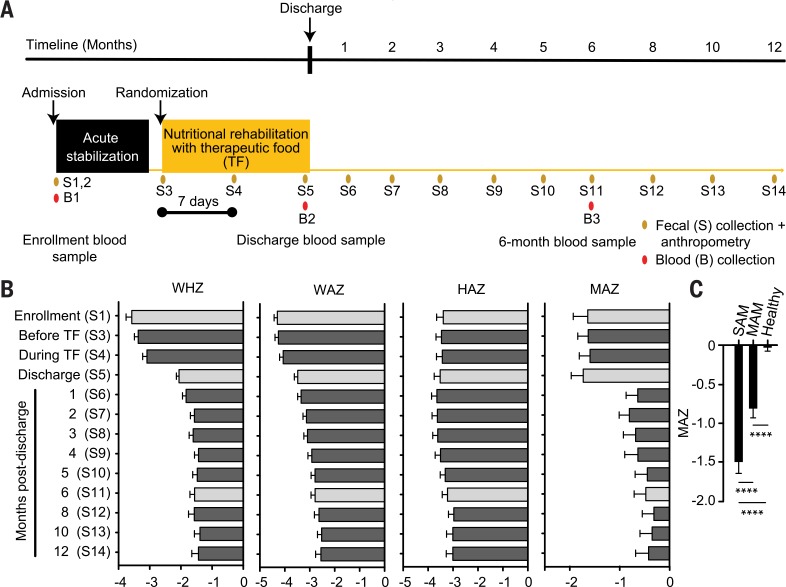
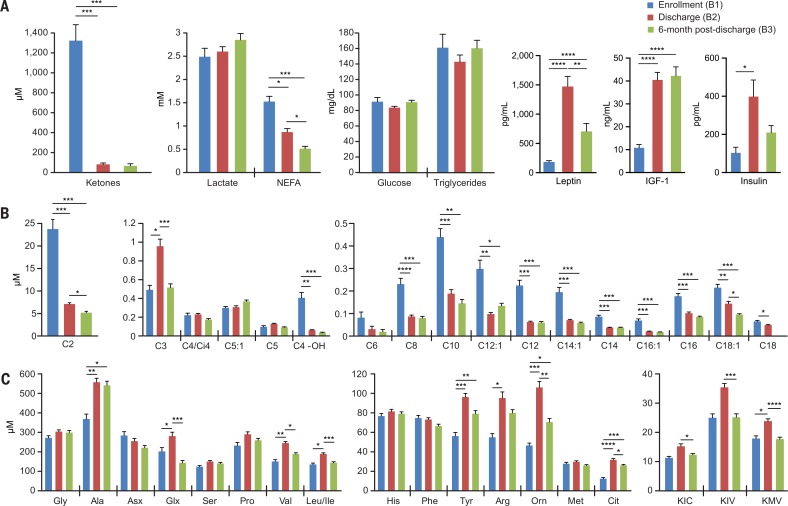
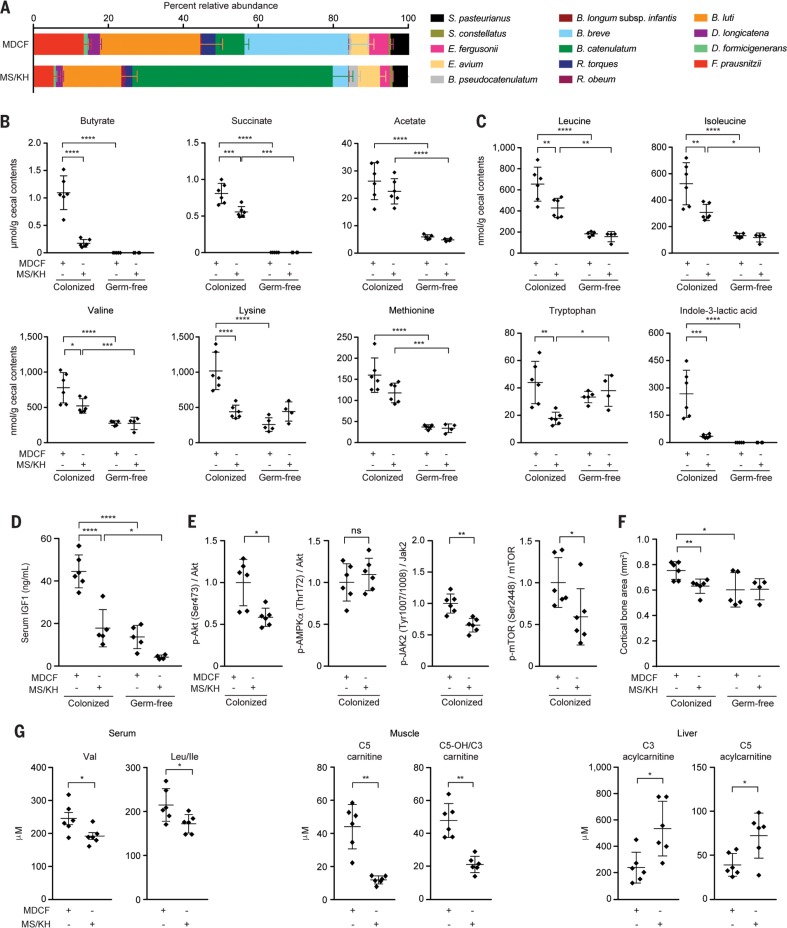
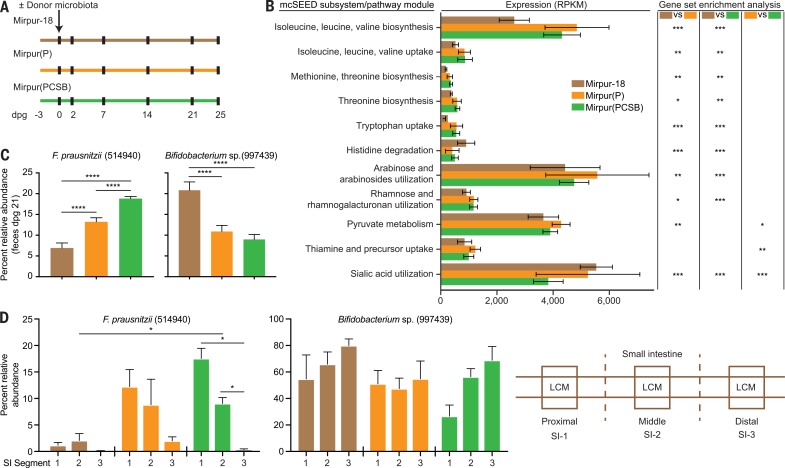
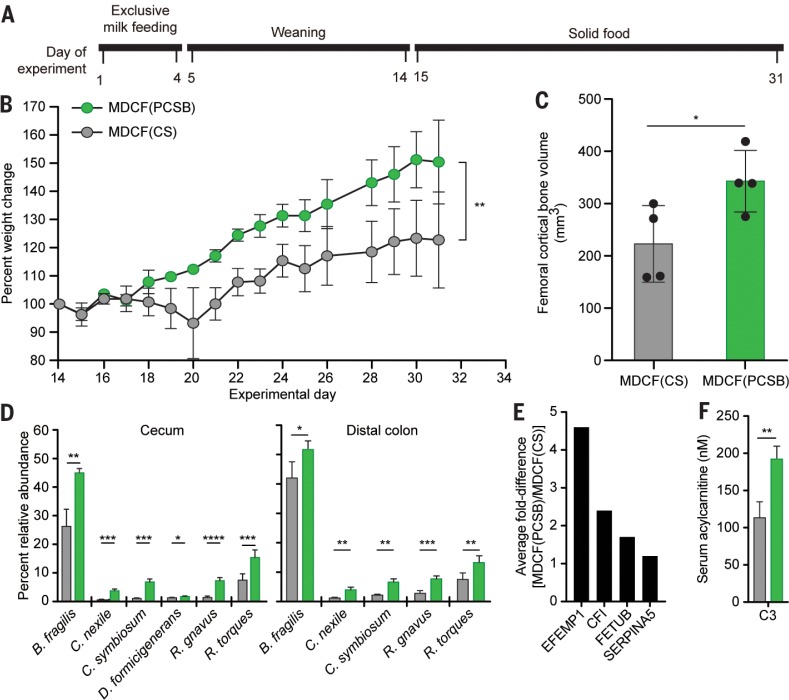
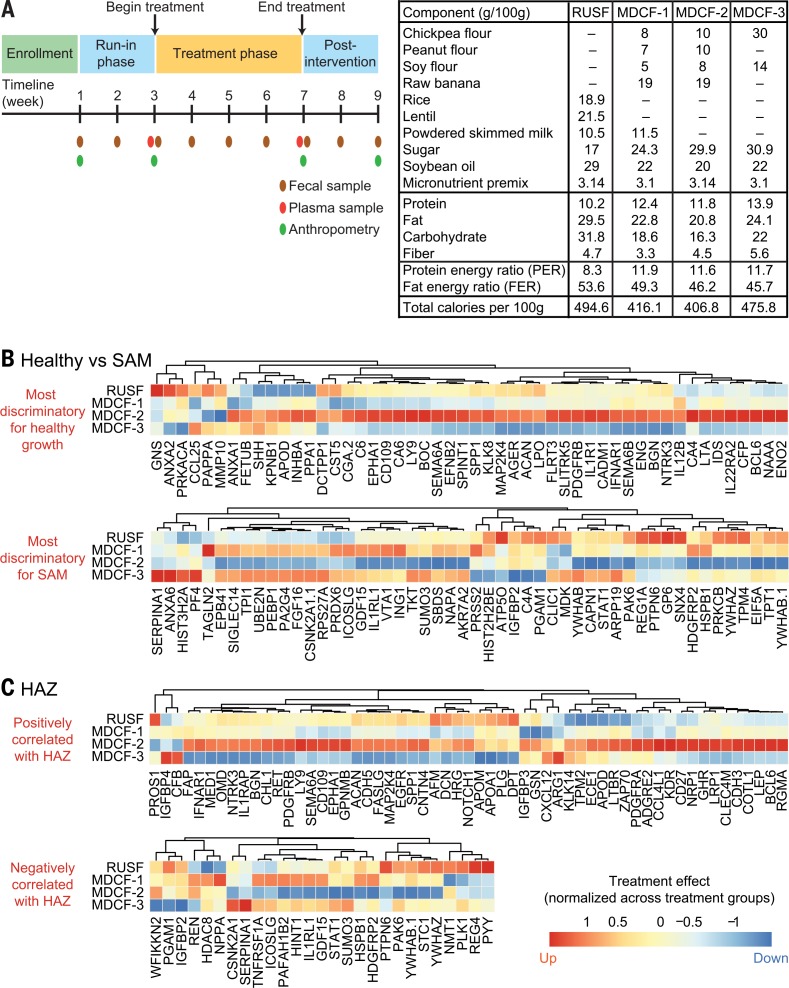
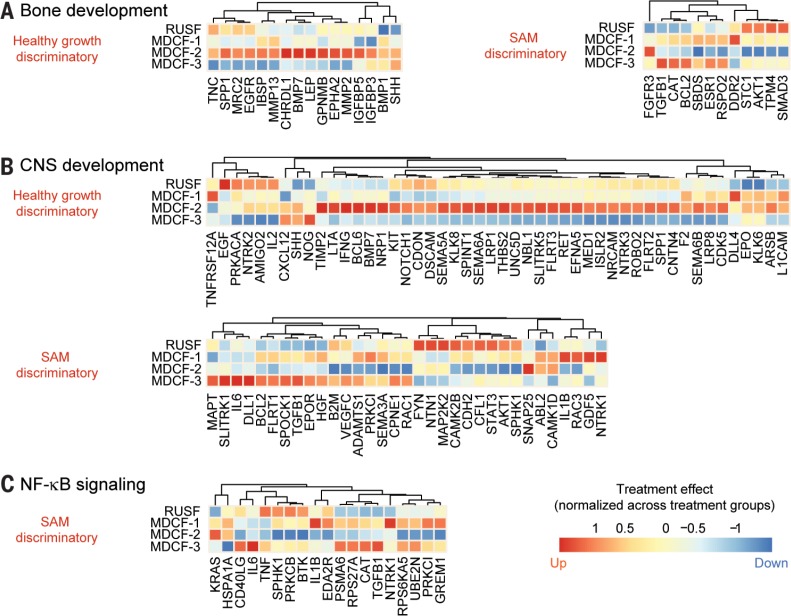
To examine the contributions of impaired gut microbial community development to childhood undernutrition, we combined metabolomic and proteomic analyses of plasma samples with metagenomic analyses of fecal samples to characterize the biological state of Bangladeshi children with severe acute malnutrition (SAM) as they transitioned, after standard treatment, to moderate acute malnutrition (MAM) with persistent microbiota immaturity. Host and microbial effects of microbiota-directed complementary food (MDCF) prototypes targeting weaning-phase bacterial taxa underrepresented in SAM and MAM microbiota were characterized in gnotobiotic mice and gnotobiotic piglets colonized with age- and growth-discriminatory bacteria. A randomized, double-blind controlled feeding study identified a lead MDCF that changes the abundances of targeted bacteria and increases plasma biomarkers and mediators of growth, bone formation, neurodevelopment, and immune function in children with MAM.


Conflict of interest statement

J.I.G. is a cofounder of Matatu, a company characterizing the role of diet-by-microbiota interactions in animal health. L.D.S. is currently a scientific sales representative at STEMCELL Technologies.

Figures

None
Overview of therapeutic food discovery and testing. The approach used for integrating preclinical gnotobiotic animal models with human studies to understand the contributions of perturbed gut microbiota development to childhood malnutrition and to identify MDCFs.
Fig. 1
Fig. 1
Longitudinal study of Bangladeshi children with SAM treated with therapeutic foods. (A) Study design. (B) Anthropometry and MAZ scores. Gray bars represent the three time points at which blood samples were collected. (C) Summary of MAZ scores for children with SAM (WHZ < –3; n = 96 fecal samples) and subsequently (post-SAM) MAM (WHZ > –3 and <–2; n = 151 fecal samples), plus healthy children aged 6 to 24 months living in the same area in which the SAM study was conducted (n = 450 fecal samples). Mean values for WHZ, WAZ, HAZ, and MAZ ± SEM are plotted on the x axes of (B) and (C). ****P < 0.0001 (one-way ANOVA followed by Tukey’s multiple comparisons test).
Fig. 2
Fig. 2
Metabolic features of children with SAM before and after treatment. (A to C) Levels of (A) standard clinical metabolites and selected hormones, (B) acylcarnitines, and (C) amino acids and ketoacids in plasma collected from children at enrollment (Fig. 1A, B1 blood sample), discharge (Fig. 1A, B2 sample), and 6 months after discharge (Fig. 1A, B3 sample). Abbreviations for branched chain ketoacids in (C) are KIC, a-ketoisocaproate; KIV, a-ketoisovalerate; and KMV, a-keto-b-methylvalerate. Mean values ± SEM are plotted. *P < 0.05; **P < 0.01; ***P < 0.001; ****P < 0.0001 (paired t test followed by FDR correction).
Fig. 3
Fig. 3
Comparison of microbial community and host effects of an initial MDCF prototype versus MS/KH. Separate groups of germ-free mice or animals colonized with the defined consortium of 14 bacterial strains were fed the two diets, monotonously, for 25 days, after which time they were euthanized, and cecal contents were analyzed. (A) The relative abundances of strains in the cecal microbiota of colonized mice. Mean values ± SD shown. (B and C)Diet- and colonization-dependent effects on (B) cecal levels of short chain fatty acids and (C) essential amino acids plus the tryptophan metabolite, indole 3-lactic acid. Each dot represents a sample from a mouse in the indicated treatment group. Mean values ± SD are shown. ***P < 0.001; ****P <0.0001[2-way ANOVA followed by Tukey’s multiple comparisons test for (A) to (C)]. (D) Diet- and colonization-dependent effects on serum IGF-1 levels. (E) Effects of diet on levels of liver proteins involved in IGF-1 signaling and IGF-1 production. Levels of phosphorylated proteins were normalized to the total amount of the corresponding nonphosphorylated protein or to glyceraldehyde-3-phosphate dehydrogenase (GAPDH). (F) Effect of diet and colonization status on the cortical thickness of femoral bone. (G) Effects of diet in colonized gnotobiotic mice on branched-chain amino acids in serum and acylcarnitines in muscle and liver. [C5-OH/C3 are isobars that are not resolved through flow injection MS/MS. C5-OH is a mix of 3-hydroxy-2-methylbutyryl carnitine (derived from the classical isoleucine catabolic intermediate 3-hydroxy-2-methylbutyryl CoA) and 3-hydroxyisovaleryl carnitine (a noncanonical leucine metabolite)]. For (D) to (G), mean values ± SD are shown. ns, not significant. *P <0.05; **P < 0.01; ****P < 0.0001 for (D) to (G) (Mann-Whitney test).
Fig. 4
Fig. 4
Effects of Mirpur-18 diet supplementation on a post-SAM MAM donor microbiota transplanted into gnotobiotic mice. (A) Experimental design. dpg, days post gavage of the donor microbiota; Mirpur(P), Mirpur-18 supplemented with peanut flour; Mirpur(PCSB), Mirpur-18 supplemented with peanut flour, chickpea flour, soy flour, and banana. (B) Expression of microbial mcSEED metabolic pathway/modules in the ceca of gnotobiotic mouse recipients of the post-SAM MAM donor gut community as a function of diet treatment. *P < 0.05; **P < 0.001; ***P < 0.0001 (statistical comparisons indicate results of gene set enrichment analysis expression on a per-gene basis across the indicated mcSEED subsystem/pathway module; all P values are FDR-adjusted). (C) Effects of supplementing Mirpur-18 with one or all four complementary food ingredients on the relative abundances of a weaning-phase– and a milk-phase–associated taxon in feces obtained at dpg 21 (one-way ANOVA followed by Tukey’s multiple comparisons test). (D) Relative abundances of the two taxa in mucosa harvested by means of LCM from the proximal, middle, and distal thirds of the small intestine. (Right) Schematic of locations in the small intestine where LCM was performed. The same color code for diets is used in (A) to (D). *P < 0.05; **P < 0.01; ****P < 0.0001 (Mann-Whitney test).
Fig. 5
Fig. 5
Effects of two different MDCF prototypes in gnotobiotic piglets. (A) Experimental design. (B) Weight gain in piglets weaned onto isocaloric MDCF prototypes containing either peanut flour, chickpea flour, soy flour, and banana [MDCF(PCSB)] or chickpea and soy flours [MDCF(CS)]. (C) mCT of femoral bone obtained at euthanasia. (D) Effects of the MDCFs on the relative abundances of community members in cecal and distal colonic contents. (E) Examples of serum proteins with significantly different post-treatment levels between the two diet groups. (F) Effect of diet on serum C3 acylcarnitine levels. Mean values ± SD are plotted. *P < 0.05; **P < 0.01; ***P < 0.005, ****P < 0.001 [two-way ANOVA in (B), unpaired t test in (C), (D), and (F)]. The color code provided in (B) also applies to (C), (D), and (F).
Fig. 6
Fig. 6
Comparing the effects of MDCF formulations on the health status of Bangladeshi children with MAM. (A) Study design and composition of diets. Total carbohydrate includes all components except added sugar. (B) Quantitative proteomic analysis of the average fold-change, per treatment group, in the abundances of the 50 plasma proteins most discriminatory for healthy growth and the 50 plasma proteins most discriminatory for SAM (protein abundance is column-normalized across treatment groups). (C) Average fold-change in abundances of plasma proteins that significantly positively or negatively correlate with HAZ [absolute value of Pearson correlation > 0.25, FDR-corrected P value < 0.05; abundance is column-normalized as in (B)].
Fig. 7
Fig. 7
The effects of different MDCF formulations on biomarkers and mediators of bone and CNS development, plus NF-kB signaling. (A to C) Average fold-change (normalized across treatment groups) in the abundances of plasma proteins belonging to GO categories related to (A) bone, (B) CNS development, and (C) agonists and components of the NF-ĸB signaling pathway. Proteins in the GO category that were significantly higher in the plasma of healthy compared with SAM children (fold-difference >30%; FDR-adjusted P value < 0.05) are labeled “healthy growth-discriminatory,” whereas those higher in SAM compared with healthy children (fold-difference >30%; FDR-adjusted P value < 0.05) are labeled “SAM-discriminatory.” Levels of multiple “healthy growth-discriminatory” proteins associated with (A) GO processes “osteoblast differentiation” and “ossification”, and (B) the GO process “CNS development” are enhanced by MDCF-2 treatment while (C) NF-kB signaling is suppressed.

Comment in

References

    1. Ahmed T., et al., The MAL-ED cohort study in Mirpur, Bangladesh. Clin. Infect. Dis. 59, S280–S286 (2014). doi: 10.1093/cid/ciu458; pmid: - DOI - PubMed
    1. Subramanian S., et al., Persistent gut microbiota immaturity in malnourished Bangladeshi children. Nature 510, 417–421 (2014). doi: 10.1038/nature13421; pmid: - DOI - PMC - PubMed
    1. World Health Organization Department of Nutrition for Health and Development, WHO child growth standards Length/height-for-age, weight-for-age, weight-for-length, weight-for-height and body mass index-for-age: methods and development (2000); www.who.int/childgrowth/en
    1. Blanton L. V., et al., Gut bacteria that prevent growth impairments transmitted by microbiota from malnourished children. Science 351, aad3311 (2016). doi: 10.1126/science.aad3311; pmid: - DOI - PMC - PubMed
    1. World Health Organization (WHO) , Infant and Young Child feeding; fact sheet no. 342, 1–5 (WHO, 2016).

Publication types