. 2019 Jul 11;10(7):531.
doi: 10.1038/s41419-019-1764-1.

cPLA2 activation contributes to lysosomal defects leading to impairment of autophagy after spinal cord injury

Affiliations

cPLA2 activation contributes to lysosomal defects leading to impairment of autophagy after spinal cord injury

Yun Li et al. Cell Death Dis. .

Abstract

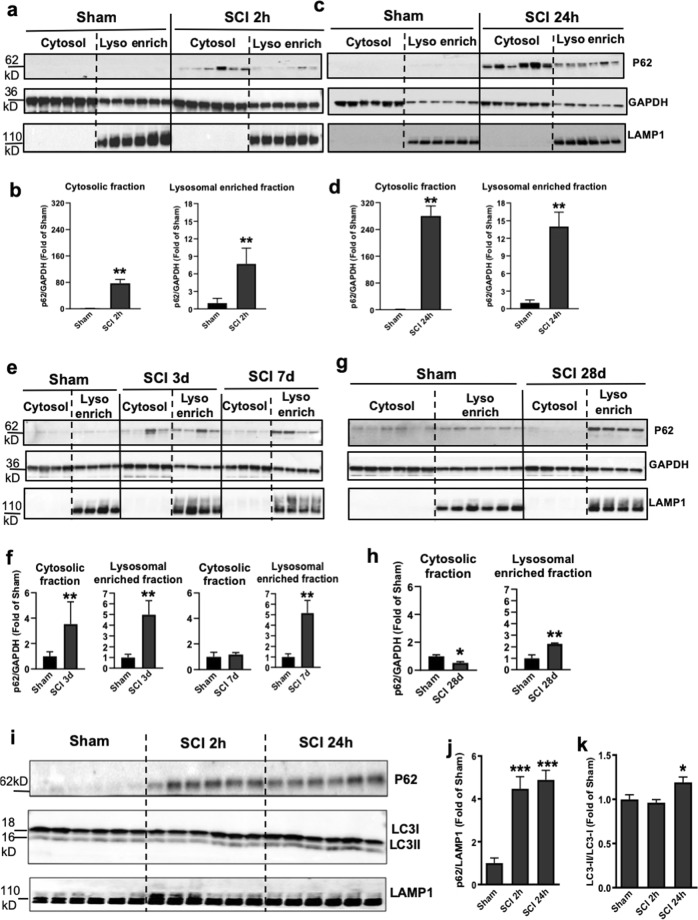
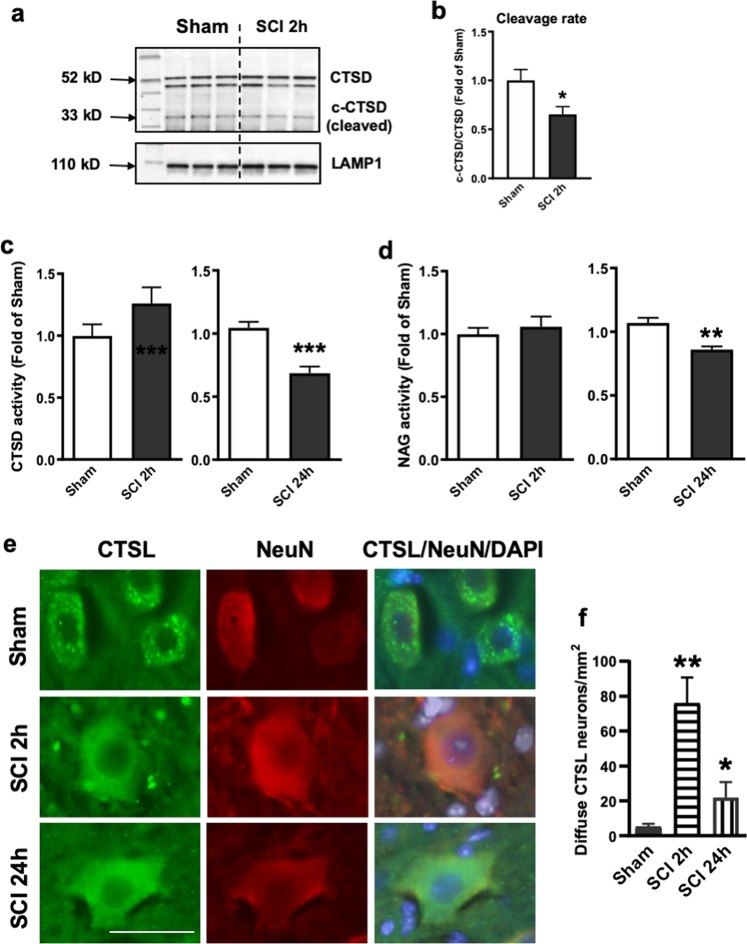
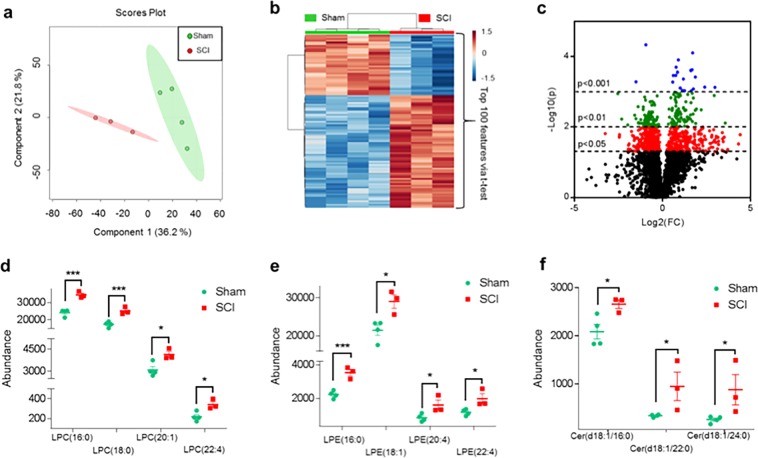
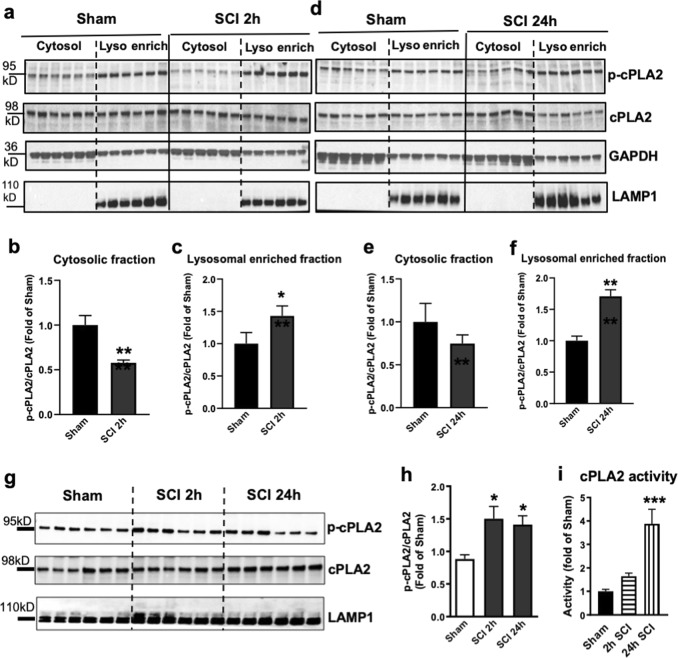
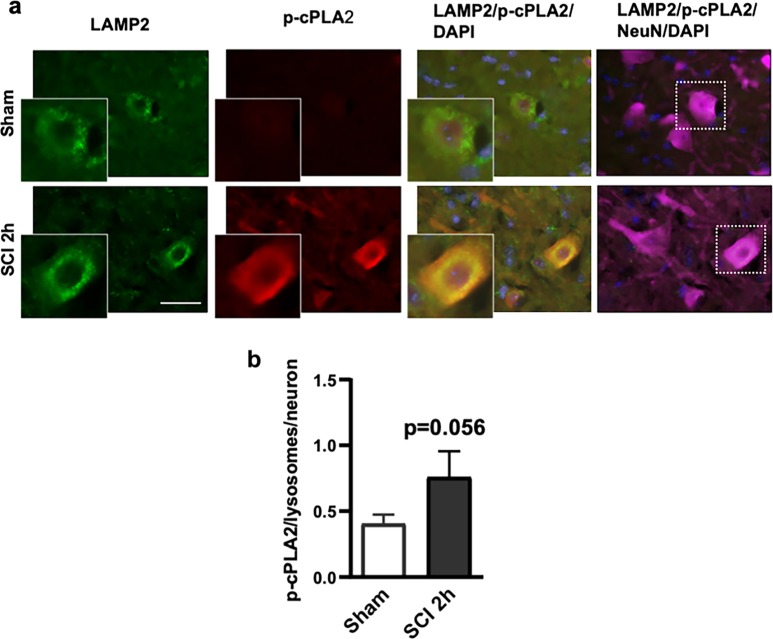
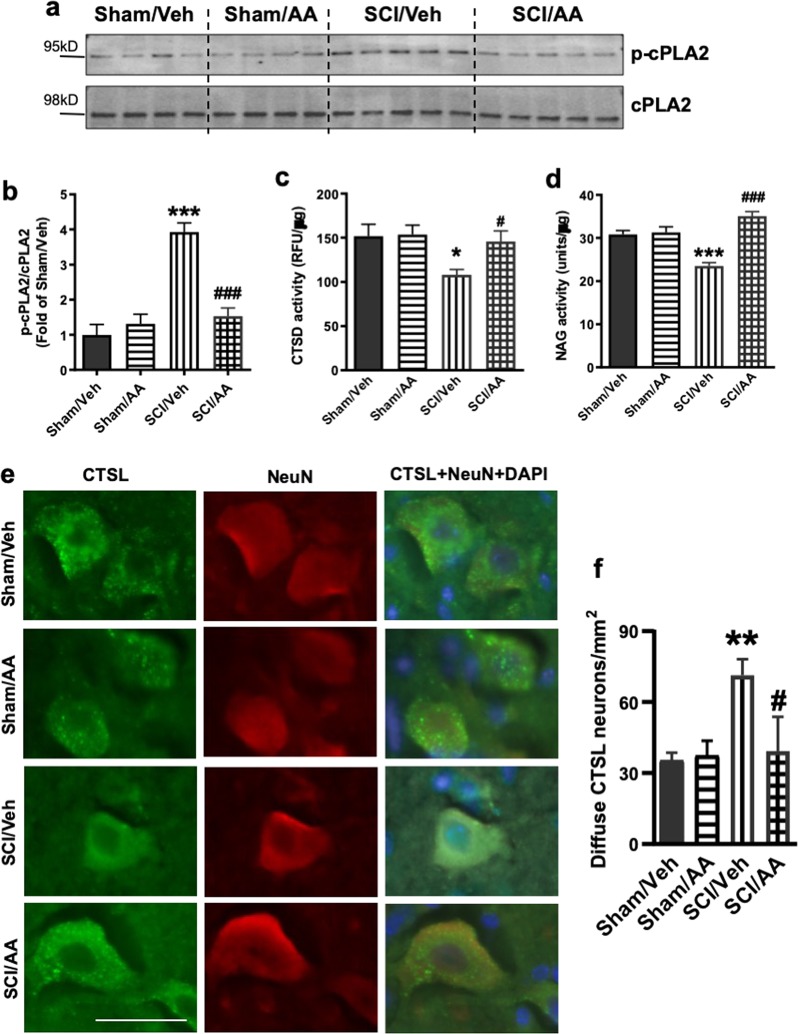
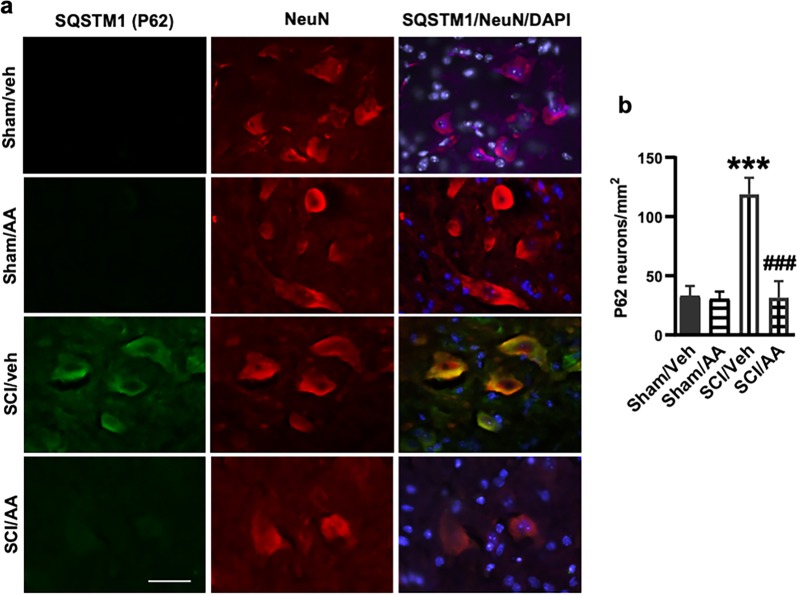
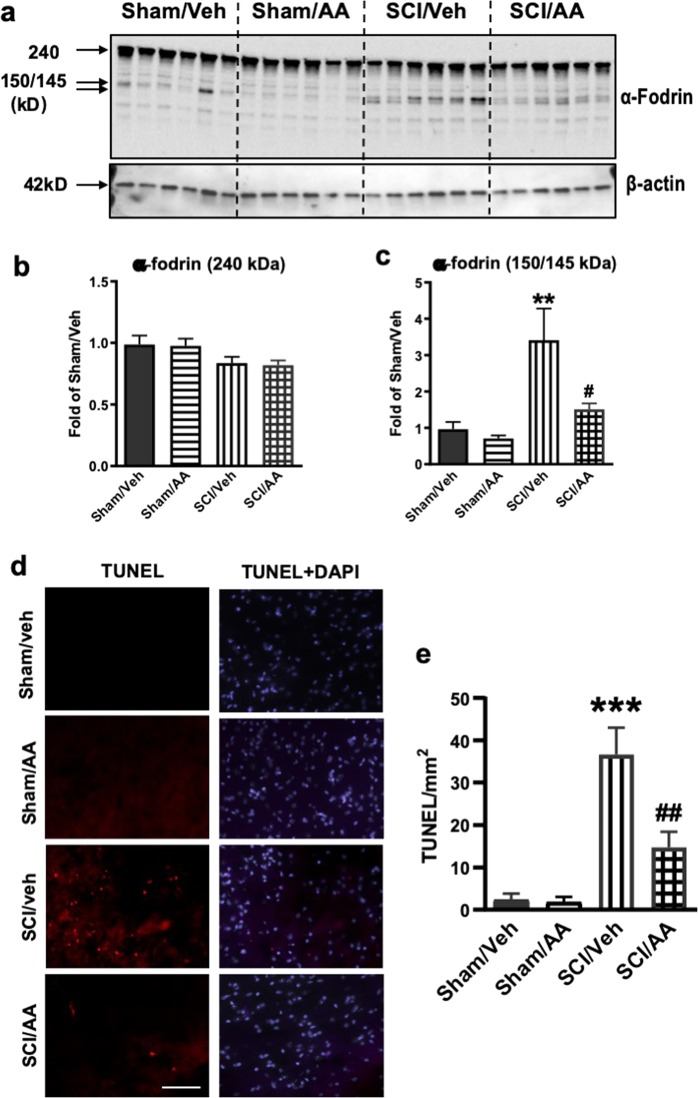
The autophagy-lysosomal pathway plays an essential role in cellular homeostasis as well as a protective function against a variety of diseases including neurodegeneration. Conversely, inhibition of autophagy, for example due to lysosomal dysfunction, can lead to pathological accumulation of dysfunctional autophagosomes and consequent neuronal cell death. We previously reported that autophagy is inhibited and contributes to neuronal cell death following spinal cord injury (SCI). In this study, we examined lysosomal function and explored the mechanism of lysosomal defects following SCI. Our data demonstrated that expression levels and processing of the lysosomal enzyme cathepsin D (CTSD) are decreased by 2 h after SCI. Enzymatic activity levels of CTSD and another lysosomal enzyme, N-acetyl-alpha-glucosaminidase, are both decreased 24 h post injury, indicating general lysosomal dysfunction. Subcellular fractionation and immunohistochemistry analysis demonstrated that this dysfunction is due to lysosomal membrane permeabilization and leakage of lysosomal contents into the cytosol. To directly assess extent and mechanisms of damage to lysosomal membranes, we performed mass spectrometry-based lipidomic analysis of lysosomes purified from SCI and control spinal cord. At 2 h post injury our data demonstrated increase in several classes of lysosophospholipids, the products of phospholipases (PLAs), as well as accumulation of PLA activators, ceramides. Phospholipase cPLA2, the main PLA species expressed in the CNS, has been previously implicated in mediation of secondary injury after SCI, but the mechanisms of its involvement remain unclear. Our data demonstrate that cPLA2 is activated within 2 h after SCI preferentially in the lysosomal fraction, where it colocalizes with lysosomal-associated membrane protein 2 in neurons. Inhibition of cPLA2 in vivo decreased lysosomal damage, restored autophagy flux, and reduced neuronal cell damage. Taken together our data implicate lysosomal defects in pathophysiology of SCI and for the first time indicate that cPLA2 activation leads to lysosomal damage causing neuronal autophagosome accumulation associated with neuronal cell death.


Conflict of interest statement

The authors declare that they have no competing financial interests.

Figures

Fig. 1
Fig. 1. SCI causes impaired autophagy flux at the level of lysosomes.
ah Time course of the adapter protein p62 (SQSTM1) expression in the cytosol and at the lysosome-enriched fractions derived from spinal cord tissue surrounding injury site following SCI in mice. Spinal cord samples were collected at indicated time points, fractionated to isolate cytosolic and lysosome-enriched fractions, processed for western blot and blotted with indicated antibodies. Lysosomal membrane protein LAMP1 was used to identify lysosomal fraction and as a loading control. All data are presented as mean ± SEM. Mann–Whitney test (two-tailed). n = 6 from 12 mice/group. *p < 0.05, **p < 0.01 versus Sham. ik Expression of p62 and the autophagosome marker LC3-II at purified lysosomes from sham control and injured spinal cords at 2 and 24 h. All data are presented as mean ± SEM. One-way ANOVA, Tukey post hoc analysis. n = 6 from 12 mice/group. *p < 0.05, ***p < 0.001 versus Sham
Fig. 2
Fig. 2. SCI causes an increase in lysosomal membrane permeability.
a, b Expression of cathepsin D (CTSD) in the purified lysosomes from sham control and injured spinal cords at 2 h. Dissected spinal cord tissue was purified for lysosomes, then processed for western blot. Both full length precursor and cleaved active CTSD are indicated in a. Lysosomal membrane protein LAMP1 was used to identify lysosomal fraction and as a loading control. Quantification of cleavage rate (cleaved/precursor CTSD) is indicated in b. All data are presented as mean ± SEM. Mann–Whitney test (two-tailed). n = 6 mice/group. *p < 0.05 versus Sham. c, d Activity of lysosomal enzymes c CTSD and d N-acetyl-glucosaminidase (NAG) is decreased in purified lysosomes from sham and SCI mouse spinal cord at 24 h. Data are mean ± SEM, Mann–Whitney test (two-tailed), n = 6 mice/group; **p < 0.01, ***p < 0.001 versus Sham. e, f Images (20×) demonstrating diffused soluble lysosomal enzyme cathepsin L (CTSL, green) in spinal cord ventral horn neurons (NeuN, red) at 2 and 24 h after SCI. CTSL staining appeared punctate in sham mouse spinal cord ventral horn neurons. Quantification of neurons with diffused CTSL staining is indicated in f. Data are mean ± SEM, Unpaired t-test between two groups, n = 5 mice (sham, SCI 2 h) and 3 mice (SCI 24 h). *p < 0.05, **p < 0.01 versus Sham. Scale bar = 50 μm
Fig. 3
Fig. 3. SCI alters lysosomal membrane lipid composition.
Results of LC-MS/MS lipid analysis of purified lysosomes from SCI and sham spinal cord membranes at 2 h after injury. a Partial Least Squares-Discriminate Analysis (PLS-DA) plot comparing sham (green) and SCI (red) in positive ion mode UPLC-HDMSE demonstrating separation of sham and SCI data; R2 = 0.88, Q2 = 0.51. Each point represents a data set from an individual animal. The 95% confidence intervals are indicated by elliptical patterns per group. Data were sum normalized, log transformed, and mean centered. b Heatmap displaying the top 100 differential abundance features based on t-test/ANOVA, Euclidean distancing and Ward clustering in positive ion mode UPLC-HDMSE. c Volcano plot highlighting features that had a *p < 0.05 (red), **p < 0.01 (green), and ***p < 0.001 (blue) when comparing Sham to SCI. The x-axis is log2(FC) (FC = fold change) and the y-axis is –log10(p) (p = p-value based on t-test). Plots in ac generated using MetaboAnalyst; n = 4 for sham and n = 3 for SCI. df Altered abundance of specific lipid classes in lysosomal membranes from sham (green) and SCI (red) mice. Statistical significance was determined using t-test. d LPC (lysophosphatidylcholine) abundance. Calculated p-values were 0.0015 (LPC(16:0)), 0.0029 (LPC(18:0)), 0.0246 (LPC(20:1)), and 0.0207 (LPC(22:4)). e LPE (lysophosphatidylethanolamine) abundance. Calculated p-values were 0.0019 (LPE(16:0)), 0.0239 (LPE(18:1)), 0.0301 (LPE(20:4)), and 0.0196 (LPE(22:4)). f Cer (ceramide) abundance. Calculated p-values were 0.0395 (Cer(d18:/16:0)), 0.0240 (Cer(d18:/22:0)), and 0.0247 (Cer(d18:/24:0)). Individual data points and mean ± SEM are indicated. n = 4 for sham and n = 3 for SCI
Fig. 4
Fig. 4. cPLA2 is activated and present at lysosomal membranes after SCI.
af The protein expression of activated (phosphorylated, p-cPLA2) and total cPLA2 in the cytosol and the lysosome-enriched fractions isolated from sham control and injured spinal cords at 2 and 24 h post injury. Each lane represents an individual animal. Quantitative analysis of Western blot for the phosphorylation rate of cPLA2 (i.e., ratio of p-cPLA2/cPLA2) are indicated in b, c, e, and f. Data are mean ± SEM, Mann–Whitney test (two-tailed), n = 6 from 12 mice/group. *p < 0.05, **p < 0.01 versus Sham. g, h Expression of p-cPLA2 and cPLA2 at purified lysosomes from sham control and injured spinal cords at 2 and 24 h. Data are mean ± SEM, One-way ANOVA, Tukey post hoc analysis. n = 6 from 12 mice/group. *p < 0.05 versus Sham. i cPLA2 enzymatic activity assay was performed in the purified lysosomes at 2 and 24 h after SCI. Data are mean ± SEM, One-way ANOVA with Tukey post hoc analysis, n = 6 mice/group; **p < 0.001
Fig. 5
Fig. 5. Activated cPLA2 is present at lysosomal membranes after SCI.
a Images (20×) of neurons (NeuN, pink) in the spinal cord of sham and SCI (2 h) mice stained with antibodies against lysosomal membrane protein Lamp2 (green) and phospho-cPLA2 (red). Scale bar = 50 μm. b Quantification of data from a demonstrating increased levels of phospho-cPLA2 at lysosomes in the injured spinal cord ventral horn neurons as compared with sham. Data are presented as mean ± SEM, n = 8 sham and 3 SCI mice; p = 0.056 (Students’ t-test)
Fig. 6
Fig. 6. Inhibition of cPLA2 attenuates SCI-induced lysosomal membrane damage.
a, b Expression of p-cPLA2 and cPLA2 at purified lysosomes from sham control and injured spinal cords at 2 and 24 h. Quantitative analysis of Western blot for the phosphorylation rate of cPLA2 (ratio of p-cPLA2/cPLA2) is indicated in b. N = 4 mice (Sham groups) and 5 mice (SCI groups). c, d Activity of lysosomal enzymes c CTSD and d N-acetyl-glucosaminidase (NAG) is increased in purified lysosomes from the injured spinal cord of mice treated with AACOCF3 (AA). N = 6 mice/group; e, f IHC analysis demonstrating decreased diffused soluble lysosomal enzyme cathepsin L (CTSL, green) in spinal cord ventral horn neurons (NeuN, red) in SCI/AACOCF3 as compared with SCI/vehicle. e Images (20×) of spinal cord sections from Sham/Veh, Sham/AA, SCI/Veh, and SCI/AA mice stained with antibodies against neuronal marker NeuN (red) and CTSL (green). Scale bar = 50 μm. f Corresponding quantification of cells with diffused (cytosolic) CTSL staining. N = 4 (Sham/Veh), 5 (Sham/AA), 7(SCI/Veh), and 4 (SCI/AA). Data are mean ± SEM, Two-way ANOVA with Bonferroni posttests, *p < 0.05, **p < 0.01, ***p < 0.001 versus Sham/Veh, #p < 0.05, ###p < 0.001 versus SCI/Veh
Fig. 7
Fig. 7. cPLA2 inhibition restores autophagy flux impaired by SCI.
IHC analysis demonstrates decreased SQSTM1 (p62) accumulation in AACOCF3 (AA) treated SCI ventral horn neurons as compared with SCI/Vehicle group. a Images (20×) of spinal cord sections of Sham/Veh, Sham/AA, SCI/Veh, and SCI/AA mice stained with antibodies against neuronal marker NeuN (red) and SQSTM1 (green). Scale bar = 50 μm. b Quantification of SQSTM1 positive cells. Data are mean ± SEM, two-way ANOVA with Bonferroni posttests, n = 4 (Sham/Veh), 5 (Sham/AA), 7(SCI/Veh), and 4 (SCI/AA). ***p < 0.001 versus Sham/Veh, ###p < 0.001 versus SCI/Veh
Fig. 8
Fig. 8. cPLA2 inhibition attenuates spinal cord ventral horn neuronal cell death in mice after SCI.
ac Expression of cleavage (145–150 kDa) and full length (240 kDa) of α-fodrin in sham and injured spinal cords at 24 h after SCI. Western blot data demonstrating decreased cleavage of α-fodrin in AACOCF3 (AA)-treated as compared with vehicle treated SCI mice. N = 6 mice/group. d Images (20×) demonstrating decreased cell death (TUNEL) in spinal cord sections from SCI/AACOCF3 as compared with SCI/Veh. Scale bar = 100 μm. e Quantification of TUNEL positive cells. N = 6 (Sham/Veh), 6 (Sham/AA), 5(SCI/Veh), and 6 (SCI/AA). Data are mean ± SEM, Two-way ANOVA with Bonferroni posttests, **p < 0.01, ***p < 0.001 versus Sham/Veh, #p < 0.05, ##p < 0.01 versus SCI/Veh

References

    1. Beattie MS, Hermann GE, Rogers RC, Bresnahan JC. Cell death in models of spinal cord injury. Prog. Brain Res. 2002;137:37–47. doi: 10.1016/S0079-6123(02)37006-7. - DOI - PubMed
    1. Beattie MS, Farooqui AA, Bresnahan JC. Review of current evidence for apoptosis after spinal cord injury. J. Neurotrauma. 2000;17:915–925. doi: 10.1089/neu.2000.17.915. - DOI - PubMed
    1. Dumont RJ, et al. Acute spinal cord injury, part I: pathophysiologic mechanisms. Clin. Neuropharmacol. 2001;24:254–264. doi: 10.1097/00002826-200109000-00002. - DOI - PubMed
    1. Grossman SD, Rosenberg LJ, Wrathall JR. Temporal-spatial pattern of acute neuronal and glial loss after spinal cord contusion. Exp. Neurol. 2001;168:273–282. doi: 10.1006/exnr.2001.7628. - DOI - PubMed
    1. Medana IM, Esiri MM. Axonal damage: a key predictor of outcome in human CNS diseases. Brain. 2003;126:515–530. doi: 10.1093/brain/awg061. - DOI - PubMed

Publication types

MeSH terms