. 2019 Jul 11;10(1):3071.
doi: 10.1038/s41467-019-10946-y.

Regulation of tumor angiogenesis and mesenchymal-endothelial transition by p38α through TGF-β and JNK signaling

Affiliations

Regulation of tumor angiogenesis and mesenchymal-endothelial transition by p38α through TGF-β and JNK signaling

Raquel Batlle et al. Nat Commun. .

Abstract

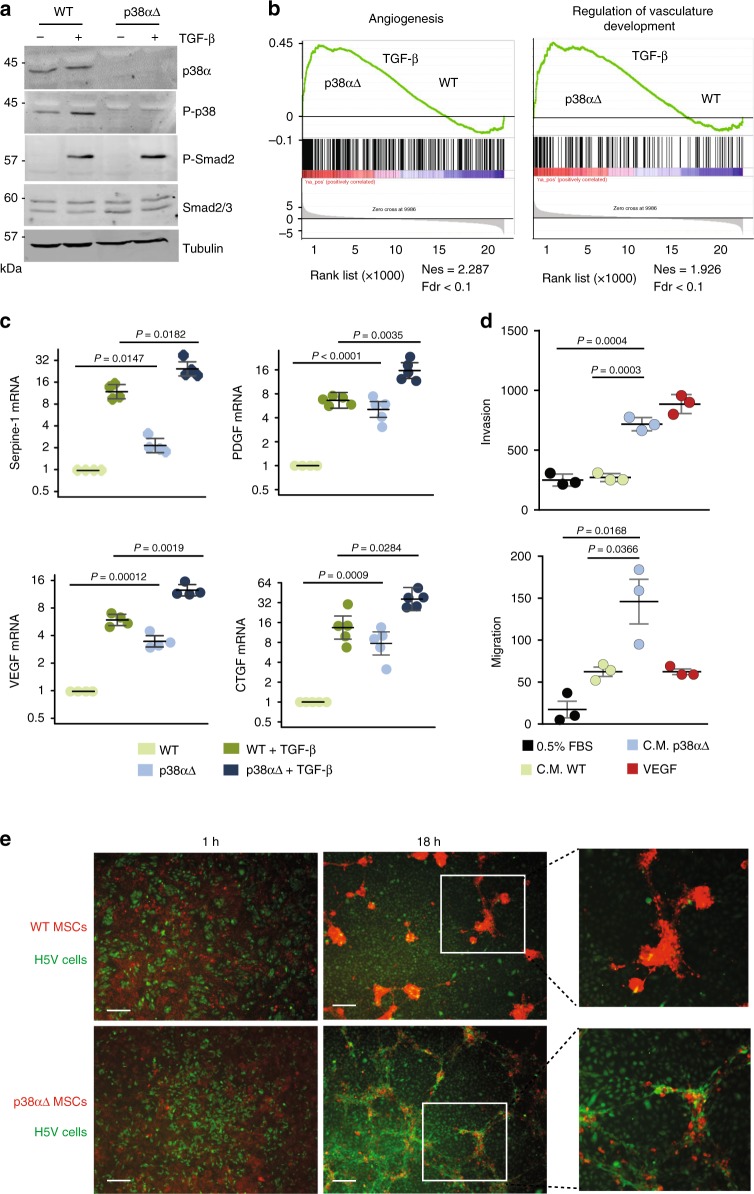
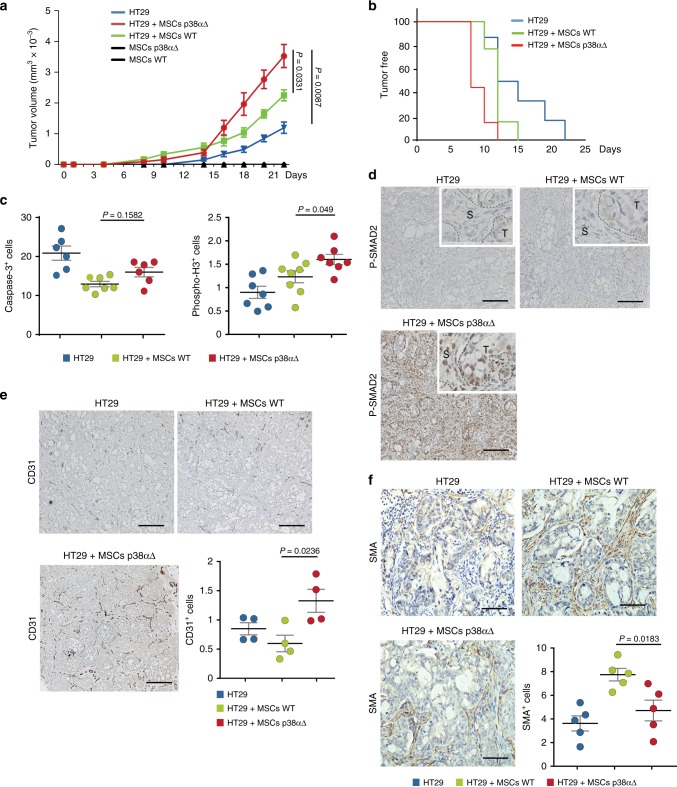
The formation of new blood vessels is essential for normal development, tissue repair and tumor growth. Here we show that inhibition of the kinase p38α enhances angiogenesis in human and mouse colon tumors. Mesenchymal cells can contribute to tumor angiogenesis by regulating proliferation and migration of endothelial cells. We show that p38α negatively regulates an angiogenic program in mesenchymal stem/stromal cells (MSCs), multipotent progenitors found in perivascular locations. This program includes the acquisition of an endothelial phenotype by MSCs mediated by both TGF-β and JNK, and negatively regulated by p38α. Abrogation of p38α in mesenchymal cells increases tumorigenesis, which correlates with enhanced angiogenesis. Using genetic models, we show that p38α regulates the acquisition of an endothelial-like phenotype by mesenchymal cells in colon tumors and damage tissue. Taken together, our results indicate that p38α in mesenchymal cells restrains a TGF-β-induced angiogenesis program including their ability to transdifferentiate into endothelial cells.


Conflict of interest statement

The authors declare no competing interests.

Figures

Fig. 1
Fig. 1
Pharmacological inhibition of p38α induces angiogenesis in human and mouse colon tumors. a Immunostaining analysis of two different human colon PDXs that were treated with the p38α inhibitor PH797804 (PH) or vehicle. The percentages of CD31+, CD105+, and PDGFRB+ cells among the total number of cells per tumor area were determined using ImageJ on pictures from colon tumors. n ≥ 4 images for each condition. Bars, 100 μm. Data represent mean ± SEM (n = 4 tumors). b Immunostaining analysis of colon tumors induced by AOM/DSS in WT or p38αΔUb mice. The percentages of CD31+, CD105+, CD34+, and PDGFRB+ cells among the total number of cells per tumor area were determined using ImageJ on pictures from three colon tumors for each condition. Bars, 100 μm. Data represent mean ± SEM (n = 4 mice). c Colon tumors induced by AOM/DSS in WT and p38αΔUb mice were stained with DAPI (blue) and immunostained for the endothelial marker CD31 (green) and the perivascular markers PDGFRB or CD146 (red). Bars, 100 μm. The lower panels show higher magnifications of the indicated areas
Fig. 2
Fig. 2
p38α negatively regulates TGF-β signaling and the expression of angiogenesis genes in MSCs. a MSCs were obtained from Mapk14lox/lox;UBC-Cre-ERT2 mice, immortalized and then incubated with 4-OHT for 2 days to obtain p38αΔ MSCs. WT MSCs were treated with vehicle. Cells were starved (0.5% FBS) and treated with TGF-β for 20 h, and total protein lysates were analyzed by immunoblotting. b Gene set enrichment analyses (GSEA) of Angiogenesis (GO: 001525) and Regulation of vasculature development (GO: 1901342) comparing WT and p38αΔ MSCs treated or not with TGF-β. Nes normalized enrichment score, Fdr false discovery rate. c Relative levels of the indicated mRNAs in WT and p38αΔ MSCs treated with TGF-β. Values are graphically represented in log2 scale and show the fold change versus WT. Data represent mean ± SEM (n = 4) and CTGF (n = 5). d H5V endothelial cells were used for migration and invasion assays on Boyden chambers in the presence of 0.5% FBS, VEGF (10 ng/ml) or conditioned medium (C.M.) prepared from WT and p38αΔ MSCs after 48 h of culture. Quantifications were performed after 6 h for the migration assays or 16 h for the invasion assays by counting the number of crystal violet-stained cells in different fields. Data are means ± SEM (n = 3). e Co-cultures of H5V endothelial cells and MSCs pre-stained with cell tracker green and red, respectively, in DMEM 10% FBS for the indicated times. Bars, 100 μm. The right panels show higher magnifications of the indicated areas
Fig. 3
Fig. 3
p38α-deficient MSCs adopt an endothelial phenotype ex vivo. a MSCs were seeded in matrigel with 0.5% FBS in the presence or absence of TGF-β (5 ng ml-1) and tube formation was determined 5 h and 16 h later. The histogram shows the quantification of the branch length per field using an ImageJ macro at 5 h. Data are mean ± SEM (n = 3). Bars, 100 μm. b MSCs were starved and then incubated with AcLDL labeled with AlexaFluor488 in 0.2% FBS for 4 h. Green dots show AcLDL internalization in p38αΔ but not WT MSCs. The lower panels show higher magnifications of the indicated areas. The histogram shows the quantification of the mean fluorescence intensity (MFI) determined by scanning all fields with a ScanR inverted microscope. Bars, 500 μm. Data are mean ± SEM (n = 3). c p38αΔ MSCs were stained with Alexa Fluor 488 Phalloidin and cultured in a 3D collagen gel to allow formation of vascular structures with central lumen. The lower panel shows a higher magnification of the indicated area as the orthogonal projections along the vertical axis. Bar, 25 μm. d MSCs were cultured in 0.5% FBS for 7 days in the presence or absence of TGF-β, which was added to the medium every 2 days. Relative mRNA expression levels for the endothelial markers Tie-1, Ve-Cadherin and FLT1 (VEGFR1), and the fibroblast markers, Fibronectin and ACTA2 (SMA) were analyzed by RT-PCR. Values are represented in log2 scale and show the fold change versus WT. Data are mean ± SEM (n = 3) and Tie-1(n = 4). e WT MSCs were incubated in 0.5% FBS and pre-treated with the p38α inhibitors SB203580 (SB), PH787904 (PH) and BIRB0796 (BIRB). The following day, 1 × 104 cells were seeded in matrigel with 0.5% FBS and the inhibitors, and tube formation was quantified 16 h later. The histogram shows the quantification of the branches length per field using ImageJ. Data are mean ± SEM (n = 5 in p38αΔ, n = 4 in WT, WT + PH and WT + Birb, n = 3 in WT + SB). Bars, 100 μm
Fig. 4
Fig. 4
p38α controls TGF-β signaling pathway. a Comparison of TGF-β treated WT and p38α∆ MSCs according to gene expression signatures of endothelial cells (CD31+) and CAFs (FAP+) isolated from human primary CRC tumors. Values are z-scores with standard deviation (SD) from the mean (n = 3). b Gene set enrichment analysis (GSEA) plots showing enrichment of gene expression signatures of endothelial cells (CD31+) and CAFs (FAP+) isolated from human primary colorectal tumors in transcriptomic programs induced by TGF-β in WT and p38α∆ MSCs. Nes, normalized enrichment score; Fdr, false discovery rate. c (right) Relative TGF-β1 mRNA levels in MSCs treated as indicated were analyzed by RT-PCR. Values are represented in log2 scale and show the fold change versus WT. Data are mean ± SEM (n = 4). (left) TGF-β1 protein levels were determined by ELISA in conditioned media (C.M.) from WT and p38αΔ MSCs after 24, 48 and 72 h of culture Data are mean ± SEM (n = 4). d GSEA identified TGF-β Signaling (M5896) as one of the main processes affected in TGF-β-treated p38αΔ MSCs compared with WT MSCs. Nes, normalized enrichment score; Fdr, false discovery rate. e MSCs were co-transfected with the reporter under control of Smad-binding elements (CAGA-LUC) and RNL-TK as a control, and 32 h later were treated with TGF-β for 4 h. Luc activity was normalized to the activity of RNL-TK. Data are mean ± SEM (n = 3). f MSCs were treated with TGF-β and collected at the indicated times followed by immunoblotting analysis. The indicated molecular weights for the P-Smad2, P-Smad3 and P-Smad3-L immunoblots represent pre-stained markers. g Nuclear and cytoplasmic fractions from MSCs either untreated or treated with TGF-β for 20 h were analyzed by immunoblotting with the indicated antibodies, using GAPDH and Lamin A/C as cytoplasmic and nuclear markers, respectively. h Total lysates (80 μg of protein) from non-treated WT and p38αΔ MSCs were analyzed by immunoblotting. The histogram shows the quantification of phospho-Smad3 levels in three independent experiment using ImageJ. Values show the fold change versus WT. Data are mean ± SEM (n = 3)
Fig. 5
Fig. 5
TGF-β signaling controls the conversion of p38α-deficient MSCs to endothelial cells. a MSCs were seeded in 0.5% FBS, and treated with the TGF-β inhibitor LY2157299 (LY, 1 nM) as indicated. Tube formation in matrigel was evaluated 10 h later. The histogram shows the quantification of the branch length per field using ImageJ. Data are mean ± SEM (n = 5 in WT and p38αΔ, n = 6 in p38αΔ + LY). Bars, 100 μm. b Cells were cultured in 0.5% FBS for 5 days in the presence or absence of TGF-β and/or the TGF-β inhibitor LY, which was added to the medium every 2 days. Relative mRNA expression levels for the endothelial markers Tie-1 and PECAM were analyzed by RT-PCR. Values are graphically represented in log2 scale and show the fold change versus WT. Data are mean ± SEM (n = 3). c MSCs were treated with TGF-β 1, 2, 3 antibody (2 μg ml−1) or mouse IgG1, as indicated. Tube formation in matrigel was evaluated 10 h later. The histogram shows the quantification of the branch length per field using ImageJ. Data are mean ± SEM (n = 4) Bars, 100 μm. d Cells were cultured in 0.5% FBS for 5 days in the presence or absence of TGF-β and/or the TGF-β 1, 2, 3 Antibody or mouse IgG1, which was added to the medium every 2 days. Relative mRNA expression levels for the endothelial markers Tie-1, PECAM and Ve-Cadherin were analyzed by RT-PCR. Values are graphically represented in log2 scale and show the fold change versus WT. Data are mean ± SEM (n = 3)
Fig. 6
Fig. 6
p38α regulates the expression of TGF-β target genes though the JNK pathway. a Starved MSCs were pre-treated with the TGF-β inhibitor LY 2157299 (LY, 1 nM) for 2 h and then with TGF-β for 20 h, and total protein lysates were analyzed by immunoblotting with the indicated antibodies. b MSCs were cultured in 0.5% FBS for 24 h, pre-treated with the TAK1 inhibitor (5Z)-7-Oxozeaenol (TAKi, 1 μM) for 2 h and then treated with TGF-β for 4 h. Total cell lysates were analyzed by immunoblotting with the indicated antibodies. c MSCs were cultured in 0.5% FBS for 24 h, pre-treated with the JNK inhibitor BI-78D3 (JNKi, 2 μM) for 2 h and then treated with TGF-β for 4 h more. Total cell lysates were analyzed by immunoblotting with the indicated antibodies. d, MSCs were cultured in 0.5% FBS for 24 h, and then TGF-β and/or BI-78D3 (JNKi, 2 μM) were added to the medium sequentially with a 2 h interval, as shown in the scheme. Relative levels for the indicated mRNAs were determined by qRT-PCR. Values are graphically represented in log2 scale and show the fold change versus WT. Data are mean ± SEM (n = 3). e WT and p38αΔ MSCs, as well as p38αΔ treated with JNK1 and JNK2 siRNAs were incubated in matrigel with 0.5% of FBS and tube formation was analyzed 20 h later. The histogram shows the average branch length per field in each case. Quantifications were performed using ImageJ. Data are mean ± SEM (n = 3). Bars, 100 μm
Fig. 7
Fig. 7
p38α-deficient MSCs enhance tumor formation and angiogenesis by colorectal cancer cells. a Growth kinetics of 2 × 106 HT29 colon cancer cells subcutaneously implanted into nude mice either alone or together with 5 × 105 WT or p38αΔ MSCs. As a control, MSCs were also implanted alone. Values are mean ± SEM (n = 8 tumors). b, Kaplan-Meier curves for the mice in (a). c Quantification of the number of Caspase-3+ cells per field and of the area covered by phospho-Histone 3+ cells (percentage per field) as markers of apoptosis and proliferation, respectively, in tumors obtained as in (a). Data are mean ± SEM (n = 6 or 7 tumors). d Phospho-Smad2 antibody staining of tumors obtained as in a. T, tumor; S, stroma. Bars, 100 μm. e CD31 antibody staining of tumors obtained as in (a). Bars, 100 μm. The percentage of CD31+ cells among the total number of cells per field was quantified using ImageJ. Data are mean ± SEM (n = 4 tumors). f SMA antibody staining of tumors obtained as in (a). Bars, 100 μm. The number of SMA+ cells per field was quantified using ImageJ. Data are mean ± SEM (n = 5)
Fig. 8
Fig. 8
p38α regulates colon tumor angiogenesis and the expression of endothelial markers by PDGFRB+ mesenchymal cells. a Colons from non-treated WT and p38αΔFSP1 Tomato-GFP mice were immunostained with antibodies for GFP (green) and CD31 (red). Co-staining is indicated by white arrowheads. Bars, 100 μm. The right panels show higher magnifications. b PDGFRB+/CD146+ colon perivascular cells were seeded in matrigel in the presence or absence of TGF-β and tube formation was determined 16 h later. The histogram shows the quantification of branch lengths. Bars, 100 μm. Data are mean ± SEM (n = 4 WT, n = 3 p38αΔ). c Tumor sizes and number of tumors larger than 4 mm formed in WT and p38αΔFSP1 mice treated with AOM/DSS. Data represent mean ± SEM (n = 11 WT, n = 21 p38αΔFSP1 mice). d Colon sections from WT and p38αΔFSP1 Tomato-GFP mice were stained for CD31. Bars, 100 μm. The percentage of CD31+ cells in the total number of cells per tumor area was quantified on pictures taken from colon tumors. Data represent mean ± SEM (n = 8 WT, n = 9 p38αΔFSP1 mice). e Quantification by FACS of the percentage of GFP+ cells expressing CD31 in normal colons (Basal) and in tumors. Data are mean ± SEM (n = 4 Basal, n = 7 WT, n = 6 p38αΔFSP1 tumors). f Quantification by FACS of the percentage of cells expressing both GFP and PDGFRB that also express CD31 in normal colons (Basal) and colon tumors from WT and p38αΔFSP1 Tomato-GFP mice. Data are mean ± SEM (n = 4 Basal, n = 7 Tumor). g Colon tumors from WT and p38αΔFSP1 Tomato-GFP mice were immunostained for GFP and CD31. Co-staining is indicated by a white arrowhead. Bars, 100 μm. The right panel shows a higher magnification of the indicated area. h Quantification by FACS of the percentage of colon cells expressing GFP and CD146 that also express CD31. PDGFRB-Cre-ERT2/ Tomato-GFP mice were treated with 4-OHT and then either with the p38α inhibitor PH797804 (PH) or vehicle followed by DSS for 5 days, as indicated. Data are mean ± SEM (n = 6)
Fig. 9
Fig. 9
Schematic illustration of the interplay between p38α and TGF-β/JNK signaling that regulates angiogenic cues and cell fate decision of mesenchymal/perivascular cells in injured tissues and tumors. See main text for details

References

    1. Psaltis PJ, Simari RD. Vascular wall progenitor cells in health and disease. Circ. Res. 2015;116:1392–1412. doi: 10.1161/CIRCRESAHA.116.305368. - DOI - PubMed
    1. Crisan M. A perivascular origin for mesenchymal stem cells in multiple human organs. Cell Stem Cell. 2008;3:301–313. doi: 10.1016/j.stem.2008.07.003. - DOI - PubMed
    1. Kramann R, et al. Perivascular Gli1 + progenitors are key contributors to injury-induced organ fibrosis. Cell Stem Cell. 2015;16:51–66. doi: 10.1016/j.stem.2014.11.004. - DOI - PMC - PubMed
    1. Guimaraes-Camboa N, et al. Pericytes of multiple organs do not behave as mesenchymal stem cells in vivo. Cell Stem Cell. 2017;20:345–359. doi: 10.1016/j.stem.2016.12.006. - DOI - PMC - PubMed
    1. Quante M, et al. Bone marrow-derived myofibroblasts contribute to the mesenchymal stem cell niche and promote tumor growth. Cancer Cell. 2011;19:257–272. doi: 10.1016/j.ccr.2011.01.020. - DOI - PMC - PubMed

Publication types

MeSH terms

Substances