. 2019 Jul 11;9(1):10067.
doi: 10.1038/s41598-019-46136-5.

Genomic diversity and novel genome-wide association with fruit morphology in Capsicum, from 746k polymorphic sites

Affiliations

Genomic diversity and novel genome-wide association with fruit morphology in Capsicum, from 746k polymorphic sites

Vincenza Colonna et al. Sci Rep. .

Abstract

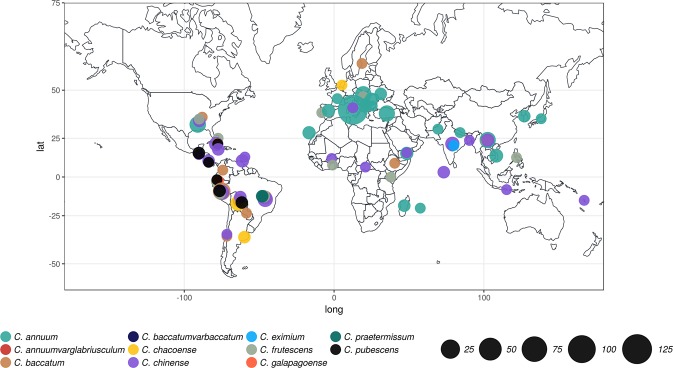
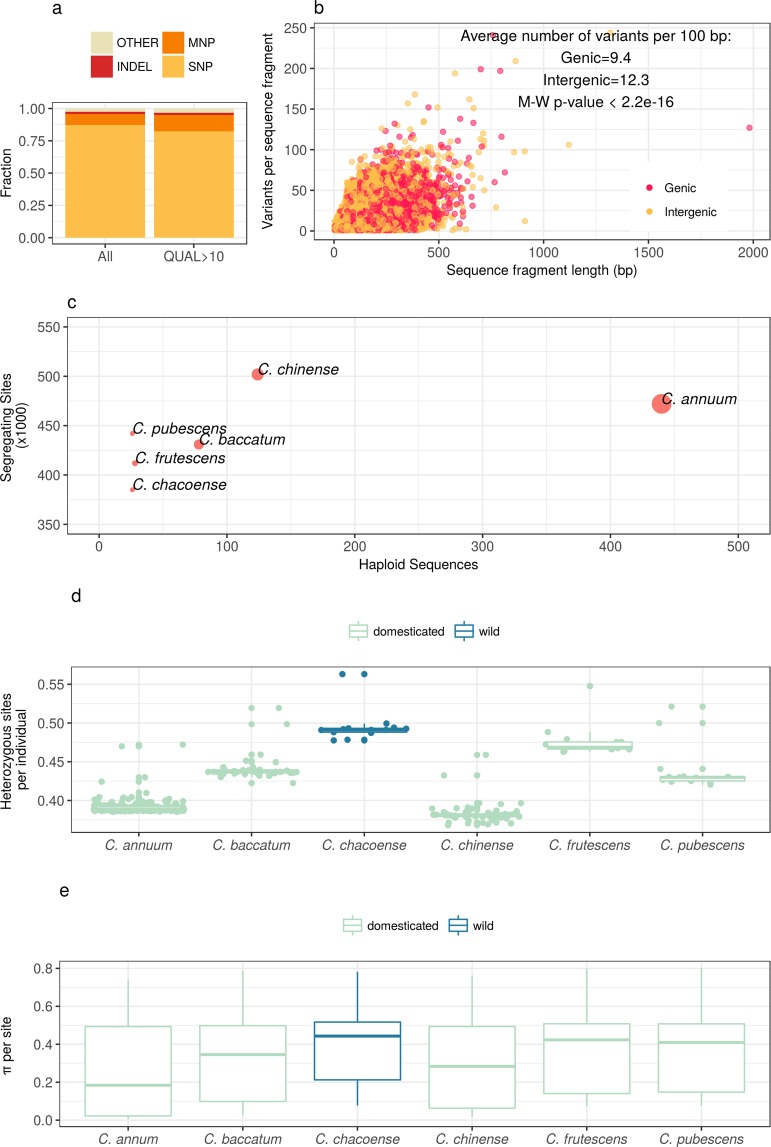
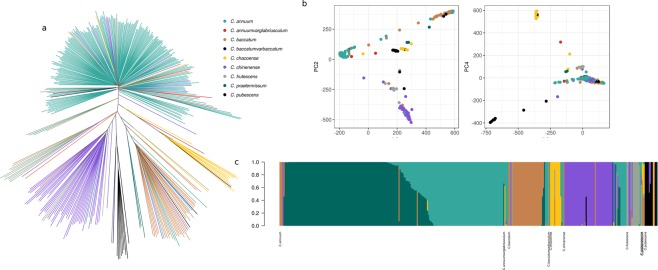
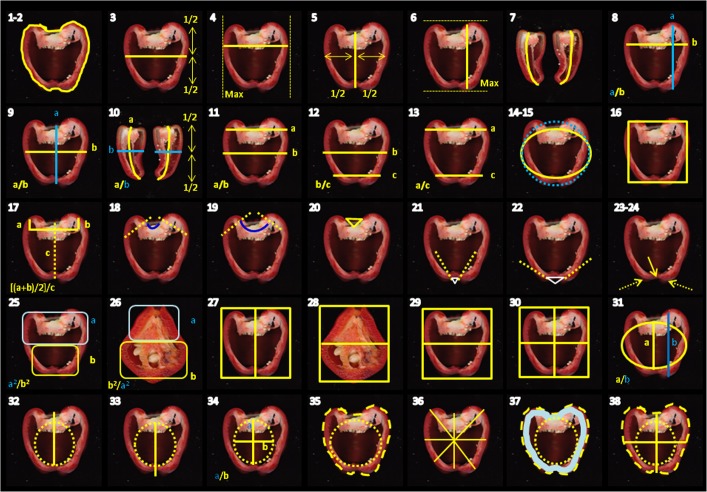
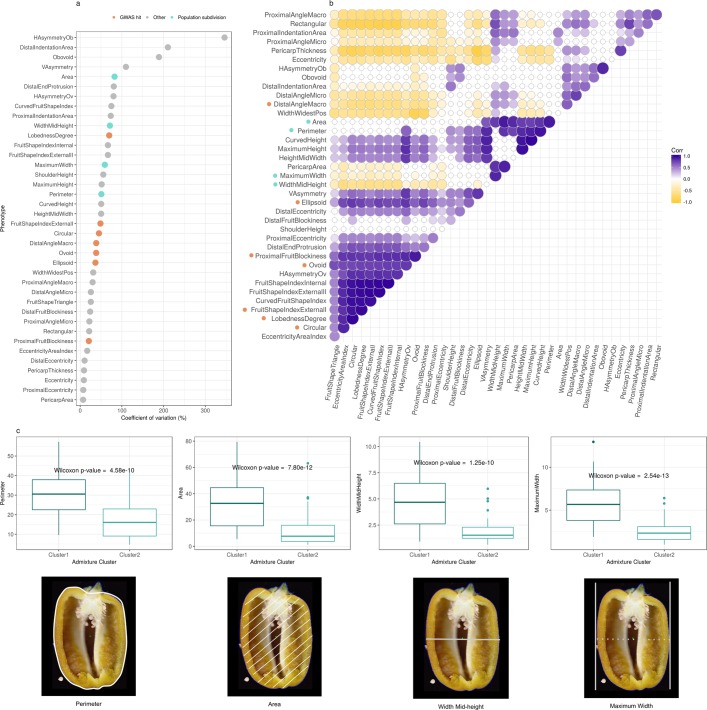
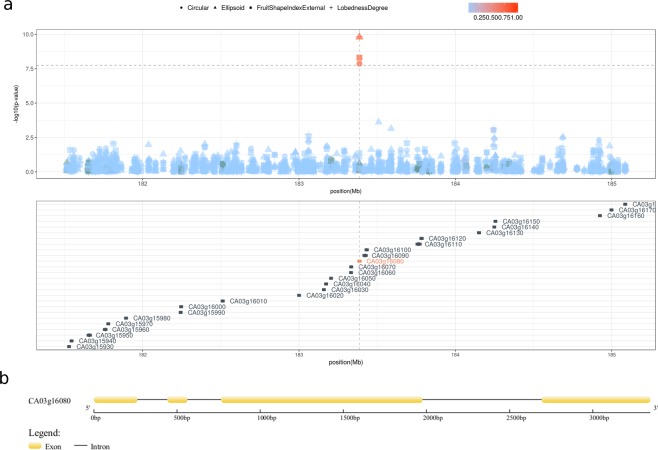
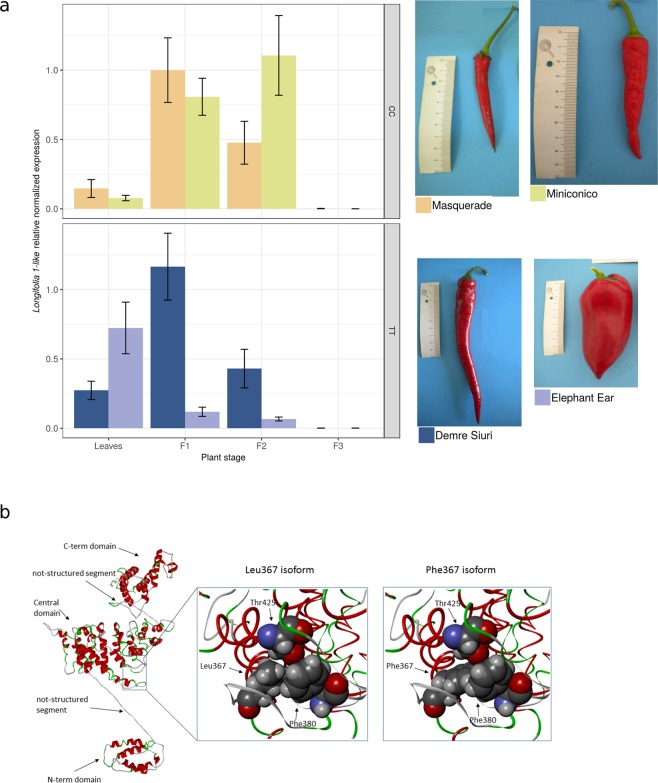
Capsicum is one of the major vegetable crops grown worldwide. Current subdivision in clades and species is based on morphological traits and coarse sets of genetic markers. Broad variability of fruits has been driven by breeding programs and has been mainly studied by linkage analysis. We discovered 746k variable sites by sequencing 1.8% of the genome in a collection of 373 accessions belonging to 11 Capsicum species from 51 countries. We describe genomic variation at population-level, confirm major subdivision in clades and species, and show that the known major subdivision of C. annuum separates large and bulky fruits from small ones. In C. annuum, we identify four novel loci associated with phenotypes determining the fruit shape, including a non-synonymous mutation in the gene Longifolia 1-like (CA03g16080). Our collection covers all the economically important species of Capsicum widely used in breeding programs and represent the widest and largest study so far in terms of the number of species and number of genetic variants analyzed. We identified a large set of markers that can be used for population genetic studies and genetic association analyses. Our results provide a comprehensive and precise perspective on genomic variability in Capsicum at population-level and suggest that future fine genetic association studies will yield useful results for breeding.


Conflict of interest statement

The authors declare no competing interests.

Figures

Figure 1
Figure 1
Geographical origin of the Capsicum accessions presented in this study with the exception of 48 accessions deriving from germplasm bank for which the origin is unknown. Circle colors define species while their size is proportional to sample size.
Figure 2
Figure 2
Genomic diversity in Capsicum. (a) Types and abundance of variant types. The majority of variants are single nucleotide polymorphisms (SNP), followed multi-nucleotide polymorphisms (MNP) and insertions/deletion (INDEL). A very small fraction of variants are complex combinations of SNP, MNP, and INDEL. QUAL > 10 refers to Phred-scaled quality scores. (b) The number of variants per sequence fragment normalized by the fragment length. Intergenic sequences have a higher number of variants, suggesting that intergenic regions are less constrained on variation. Each circle is a sequence fragments and colors distinguish genic from intergenic ones. (c) An average number of segregating sites per species is 440.6k. The number of segregating sites per species is roughly proportional to sample size with the exception of C. annuum for which there are fewer variable sites than expected given the number of accessions, most likely because of intensive domestication. (d) The proportion of heterozygous sites per accession. Species that underwent extensive domestication (C. annuum and C. chinense) have very low heterozygosity, while the wild species C. chacoense has the highest variability. (e) Nucleotide diversity per site (π) follows the same trend as the heterozygosity.
Figure 3
Figure 3
Population structure of the Capsicum species derived form 746k genomic variants. (a) Phylogenetic reconstruction of the relationships between the accessions. With a few exceptions, clusters correspond to species. (b) Principal component analysis. The first two components separate the three main domesticated species. Clustering within the first two components is not complete, and a number of accessions are positioned in between clusters. The third and the fourth components separate C. pubescens and C. chacoense between them and from the cluster of domesticated species. (c) Model-based admixture analysis in the hypothesis of seven clusters. With the exceptions of few admixed or misplaced individuals, clusters correspond to species and within C. annuum is possible to observe two groups with distinct genetic features.
Figure 4
Figure 4
Graphic representation of the phenotypes measured. The numbers refer to Table S3.
Figure 5
Figure 5
Analyses of thirty-eight quantitative traits related to fruit shape and size. Description of phenotypes is available in Supplementary Table S3. (a) Coefficients of variation (CVs) show that very often the standard deviation exceeds the mean value of the trait, suggesting a great variability of the traits. (b) Spearman’s rank correlation coefficients between pairs of phenotypes. Only correlation coefficients with p-value < 10e-7 are shown. In (a) and (b) green dots mark phenotypes that are significantly different between clusters of C. annuum identified in the admixture analysis, while orange dots mark phenotypes showing significant association with genetic markers in genome-wide association tests. (c) Traits that significantly differs between the two subgroups of C. annuum identified from genetic clustering analysis. Cluster 1 contains bulkier and larger fruits compared to Cluster2.
Figure 6
Figure 6
Results of the genome-wide association analysis. (a) We identified eight variants at four loci on three chromosomes, significantly associated with seven traits. Circles represent the association between one genetic variant and one trait. On chromosome 10, variants are adjacent. Colors distinguish phenotypes. (b) The cluster of phenotypes determining whether fruits are pointed or squared. (c) The cluster of phenotypes determining if fruits are circular or elongated, with a significant association with a variant causing a non-synonymous mutation in the gene Longifolia 1-like on chromosome 3.
Figure 7
Figure 7
The Longifolia 1-like gene region. (a) Locus zoom plot in a region of ±2 Mb surrounding the non-synonymous mutation (3:183386147) in the gene Longifolia 1-like (CA03g16080) showing that the 3:183386147 variant is the only one reaching a genome-wide significant threshold for genetic association in a region containing twenty-six genes. Color gradient indicate linkage disequilibrium measured ad r2. No other variants are in significant linkage with 3:183386147. (b) The predicted genic structure of Longifolia 1-like (CA03g16080).
Figure 8
Figure 8
Gene expression of Longifolia 1-like and protein conformations associated with the non-synonymous change at the locus 3:183386147. (a) Relative gene expression level of Longifolia 1-like in leaves and fruits at different developmental stages in four C. annuum accessions. The average and confidence interval of three replicates is reported for each accession. L = leaf; F1 = fruit set (7 days post anthesis); F2 = immature fruit (35 days post anthesis); F3 = mature fruit (fully developed fruits, over 60 days post anthesis). (b) Predicted protein structure for Longifolia 1-like. The whole model of the protein is represented by a backbone ribbon with helices in red and turns in green. Arrows indicate the structural regions, i.e. N-terminal domain, not structured connection segment, central domain, not structured connection segment, C-terminal domain. The region of the central domain including the residue number 367 (containing the 3:183386147 T → C variant) and the closer side chains (Phe380 and Thr425) is enlarged in spacefill representation in two versions, with the leucine and the phenylalanine residues. The representation with the leucine highlights the compactness of the interactions between Leu367, Phe380 and Thr42).

References

    1. Carrizo García C, et al. Phylogenetic relationships, diversification and expansion of chili peppers (capsicum, solanaceae) Annals Bot. 2016;118:35–51. doi: 10.1093/aob/mcw079. - DOI - PMC - PubMed
    1. Nicolaï M, Cantet M, Lefebvre V, Sage-Palloix A-M, Palloix A. Genotyping a large collection of pepper (Capsicum spp.) with ssr loci brings new evidence for the wild origin of cultivated C. annuum and the structuring of genetic diversity by human selection of cultivar types. Genet. Resour. Crop. Evol. 2013;60:2375–2390. doi: 10.1007/s10722-013-0006-0. - DOI
    1. Lee H-Y, et al. Genetic diversity and population structure analysis to construct a core collection from a large capsicum germplasm. BMC Genet. 2016;17:142. doi: 10.1186/s12863-016-0452-8. - DOI - PMC - PubMed
    1. Paran I, Van Der Knaap E. Genetic and molecular regulation of fruit and plant domestication traits in tomato and pepper. J. Exp. Bot. 2007;58:3841–3852. doi: 10.1093/jxb/erm257. - DOI - PubMed
    1. Tanksley SD. The genetic, developmental, and molecular bases of fruit size and shape variation in tomato. The plant cell. 2004;16:S181–S189. doi: 10.1105/tpc.018119. - DOI - PMC - PubMed

Publication types

Substances