. 2019 Jul 11;9(1):10052.
doi: 10.1038/s41598-019-46489-x.

Fast stimulated Raman and second harmonic generation imaging for intraoperative gastro-intestinal cancer detection

Affiliations

Fast stimulated Raman and second harmonic generation imaging for intraoperative gastro-intestinal cancer detection

Barbara Sarri et al. Sci Rep. .

Abstract

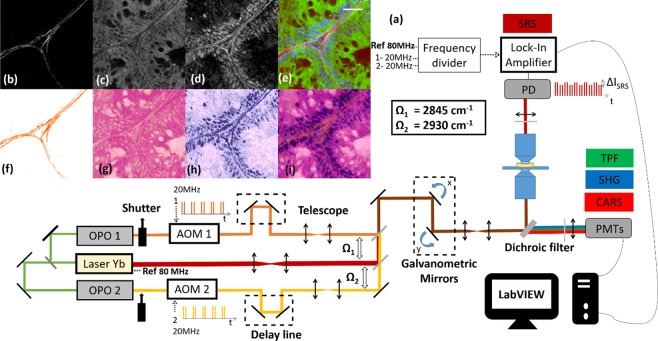
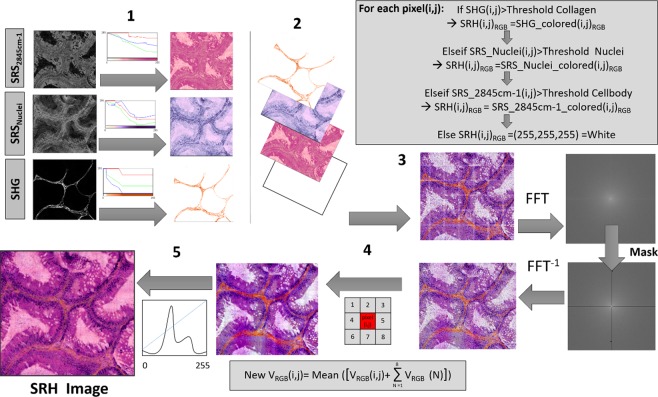
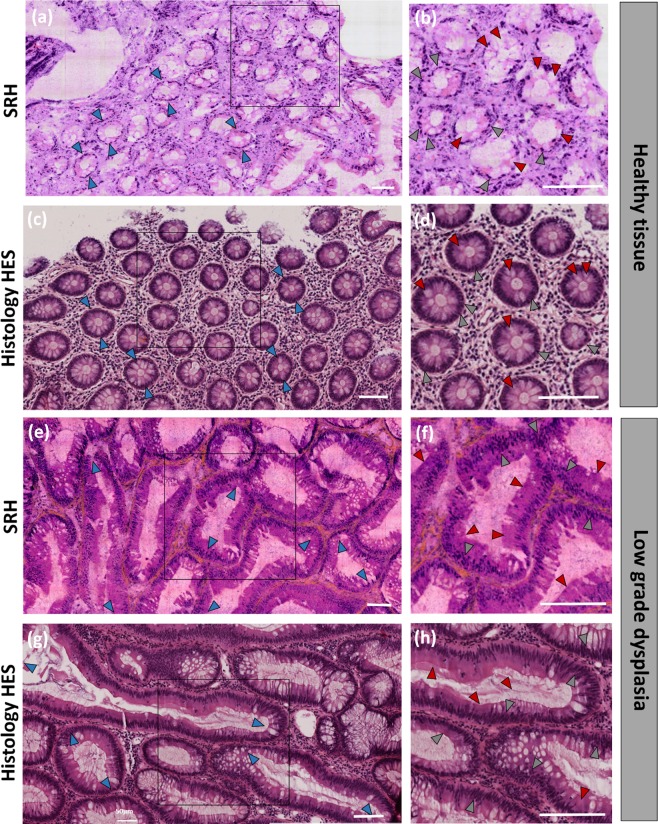
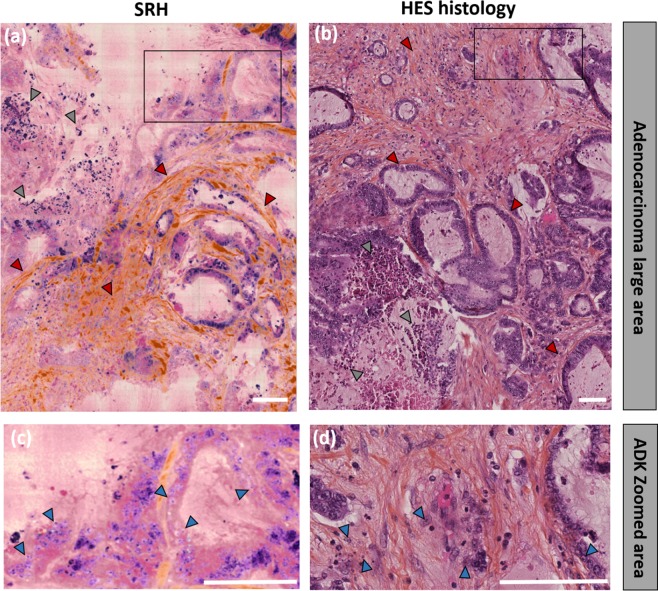
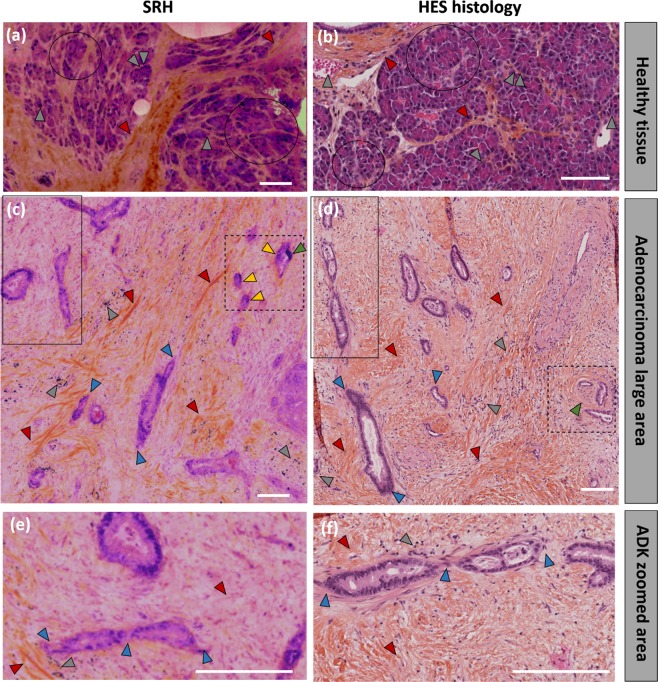
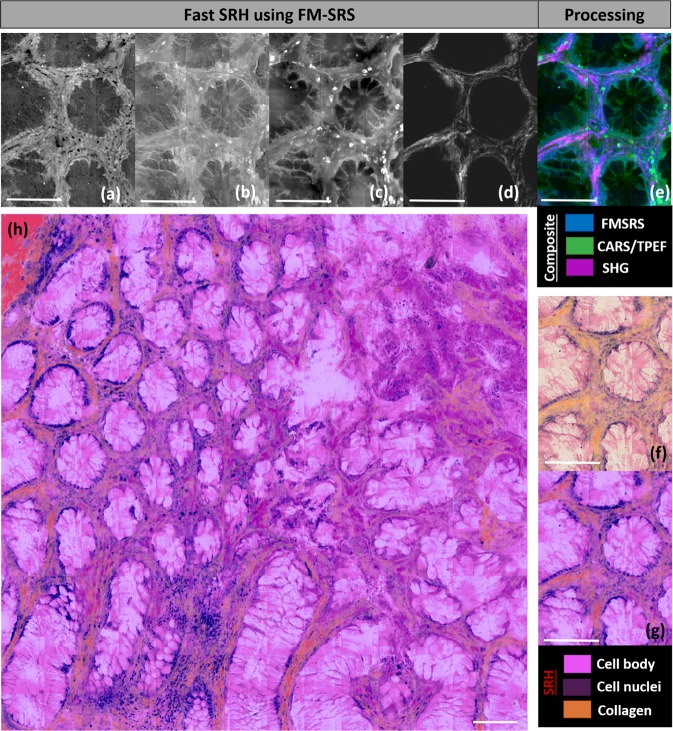
Conventional haematoxylin, eosin and saffron (HES) histopathology, currently the 'gold-standard' for pathological diagnosis of cancer, requires extensive sample preparations that are achieved within time scales that are not compatible with intra-operative situations where quick decisions must be taken. Providing to pathologists a close to real-time technology revealing tissue structures at the cellular level with HES histologic quality would provide an invaluable tool for surgery guidance with evident clinical benefit. Here, we specifically develop a stimulated Raman imaging based framework that demonstrates gastro-intestinal (GI) cancer detection of unprocessed human surgical specimens. The generated stimulated Raman histology (SRH) images combine chemical and collagen information to mimic conventional HES histopathology staining. We report excellent agreements between SRH and HES images acquire on the same patients for healthy, pre-cancerous and cancerous colon and pancreas tissue sections. We also develop a novel fast SRH imaging modality that captures at the pixel level all the information necessary to provide instantaneous SRH images. These developments pave the way for instantaneous label free GI histology in an intra-operative context.


Conflict of interest statement

The authors declare no competing interests.

Figures

Figure 1
Figure 1
Performing stimulated Raman histology (SRH) on cryogenic and fresh samples. (a) Schematic diagram of the set-up allowing to probe simultaneously the CH21 = 2845 cm−1) and CH32 = 2930 cm−1) chemical bonds: OPO: optical parametric oscillator, AOM: acousto-optic modulator, PD: photodiode, TPEF: two-photon excited fluorescence, SHG: second harmonic generation, CARS: anti-Stokes Raman scattering, SRS: Stimulated Raman Scattering. Built-in mechanical shutters in OPO1 and OPO2 allow to perform the λ-switch modality, 180° phase shift between AOM1 and AOM2 enables the FM-SRS modality. (be) Data acquisition on a human colon tissue: (b) SHG signal reveals the collagen, (c) SRS signal at Ω1 = 2845 cm−1 (SRS2845cm1) shows the cell bodies, (d) subtracting the SRS signals at Ω2 = 2930 cm−1 and Ω1 = 2845 cm−1 allows to highlight the nuclei distribution. (e) Composite image built from (bd) SHG (magenta), SRS2845cm1 (green), SRS2930cm1 − SRS2845cm1 (blue). (fi) HES virtual coloring: Applying specific look up tables (LUTs) to (b,c,d) mimics HES staining: orange (SHG) to mimic the saffron, pink (SRS2845cm1) to mimic the eosin, dark purple (SRS2930cm1 − SRS2845cm1) to mimic hematoxylin allow to build a label-free SRH (Stimulated Raman Histology) histological-like image (i) that can be readily interpreted by the histo-pathologist. Scale bar is 30 µm.
Figure 2
Figure 2
Data processing protocol to perform virtual HES coloring.
Figure 3
Figure 3
Comparing stimulated Raman histology (SRH) with haematoxylin, eosin and saffron (HES) on human colon tissue. (a) SRH image of a millimeter-scale area of healthy tissue, the daisy field is well defined. (b) Zoomed image on the region of interest (ROI) defined in (a). (c,d) HES images from the same region as (a,b) (within of a few mm3). Both SRH and HES images reveal key features of normal colon tissue such as homogeneous crypts diameters (blue arrows), regularly spaced nuclei around the glands (grey arrows), vacuoles uniformly present within the crypts (red arrows). (e) SRH image of a millimeter-scale area showing low grade dysplasia. (f) Zoomed image on ROI defined in (e). (g,h) HES images from the same region as (e,f) (within of a few mm3). Both SRH and HES images reveal key features of low grade dysplasia tissue such as larger gland with irregular and inhomogeneous shapes (blue arrows), nuclear pseudo stratification (grey arrows) and reduction of the vacuoles within the glands (red arrows). Scale bar is 100 μm.
Figure 4
Figure 4
Human colon adenocarcinoma imaging. (a) SRH and (b) HES images from the same region (within of a few mm3). On both SRH and HES images signs of malignancy are present: a strong stroma-fibrosis around the glands (red arrows) as well as necrotic tumor cells (grey arrows) can be visualized. (c,d) are zoomed on the ROIs defined in (a,b), respectively in which large number of nucleoli can be evidenced (blue arrows). Scale bar 100 μm.
Figure 5
Figure 5
Adenocarcinoma diagnosis on human pancreas using Stimulated Raman Histology (SRH). (a) SRH picture of healthy (ie non-cancerous) pancreas tissue. (b) HES staining of the same of the region (a few mm3) of the same patient. In both images acinar cells in group (black circles) surrounded with thin collagen fibers (red arrows) can be visualized. (c) SRH picture of a millimeter-scale region of a cancerous pancreatic tissue, (d) HES picture of a larger zone of the same patient in the same region (a few mm3). In both cases, strong stroma fibrosis (red arrows), large angulated glands (blue arrows) can be observed. In the SRH image, a gland demonstrating both a nucleolus (yellow arrow) and an hyperchromatic cell (green arrow) in the same gland allowed to diagnose for adenocarcinoma while a nerve ‘encapsulating’ 2 glands in the HES picture (green arrow) lead to the same diagnostic. (e,f) are zoomed on the solid line ROIs defined in (c,d) respectively in which the same features are highlighted. Scale bar 100 μm.
Figure 6
Figure 6
Fast SRH using the FM-SRS modality. (a) FM-SRS (SRSnuclei = SRS2930cm1 − SRS2845cm1): nuclei distribution, (b) CARS, and (c) TPEF: cell body distribution and (d) SHG: collagen distribution are acquired simultaneously. Combining (ad), a composite image can be built: FMSRS (blue), TPEF (green) and SHG (magenta). Applying the LUTs described in the Materials and Methods section a SRH image can be built (f-g-h). (f) SRH from raw data, (g) image smoothed and color adjusted from (f). (h) SRH on a large millimeter-scale region on healthy (i.e. non-cancerous) human colon tissue. Acquisition time 25 minutes. Scale bar 100 μm.

References

    1. Ngamruengphong S, Canto MI. Screening for Pancreatic Cancer. The Surgical clinics of North America. 2016;96(6):1223–1233. doi: 10.1016/j.suc.2016.07.016. - DOI - PMC - PubMed
    1. Siegel RL, Miller KD, Jemal A. Cancer Statistics, 2017. CA: a cancer journal for clinicians. 2017;67(1):7–30. - PubMed
    1. Thorburn CM, et al. Gastrin and colorectal cancer: a prospective study. Gastroenterology. 1998;115(2):275–280. doi: 10.1016/S0016-5085(98)70193-3. - DOI - PubMed
    1. Fischer AH, Jacobson KA, Rose J. Zeller R. Hematoxylin and Eosin Staining of Tissue and Cell Sections. Cold Spring Harbor Protocols. 2008;2008(5):pdb.prot4986. - PubMed
    1. Sridharan G, Shankar AA. Toluidine blue: A review of its chemistry and clinical utility. Journal of oral and maxillofacial pathology: JOMFP. 2012;16(2):251–255. doi: 10.4103/0973-029X.99081. - DOI - PMC - PubMed

Publication types

MeSH terms