. 2019 Jul 11;9(1):10040.
doi: 10.1038/s41598-019-46463-7.

Evidence for potassium transport activity of Arabidopsis KEA1-KEA6

Affiliations

Evidence for potassium transport activity of Arabidopsis KEA1-KEA6

Masaru Tsujii et al. Sci Rep. .

Abstract

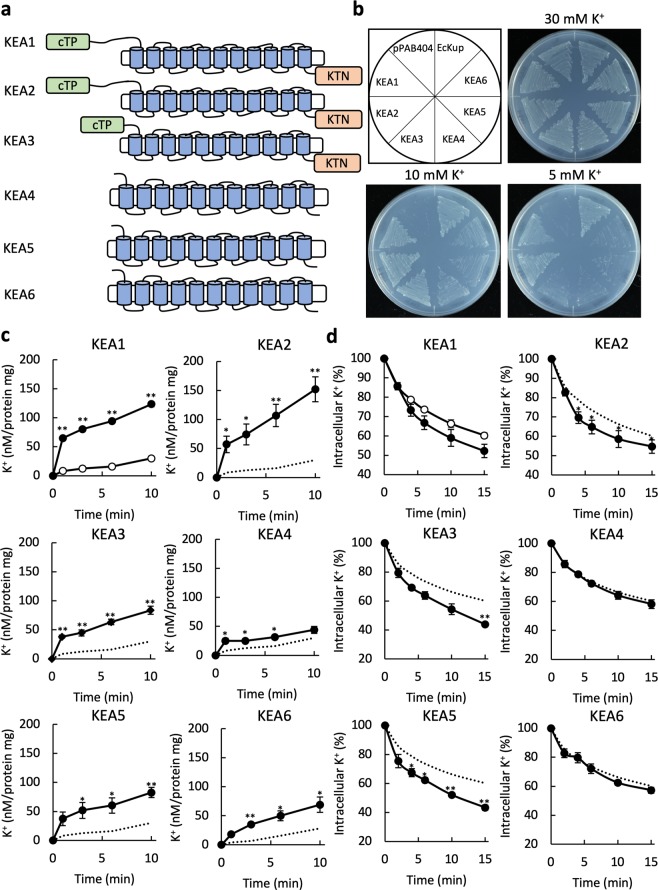
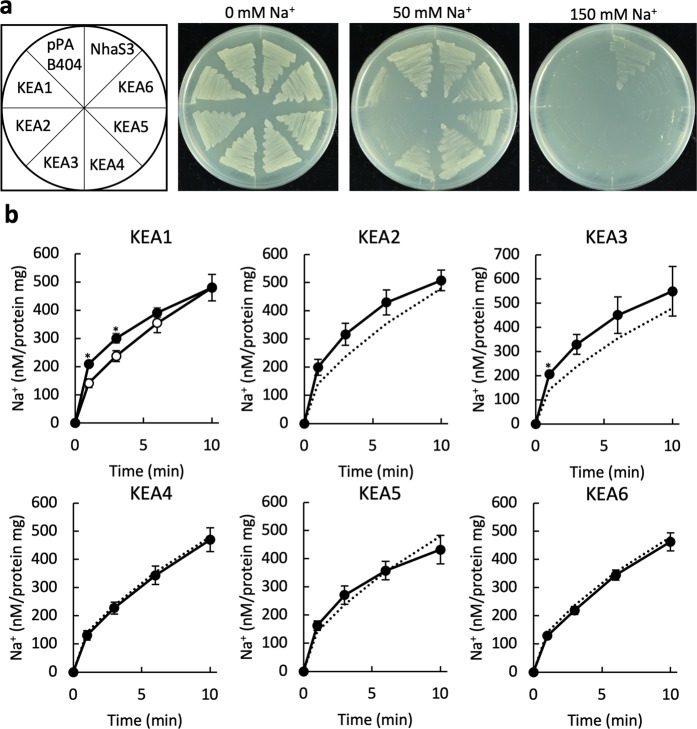
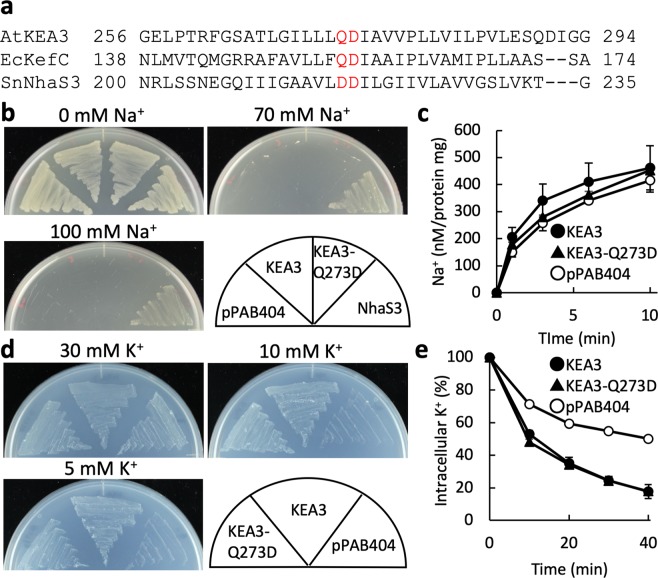
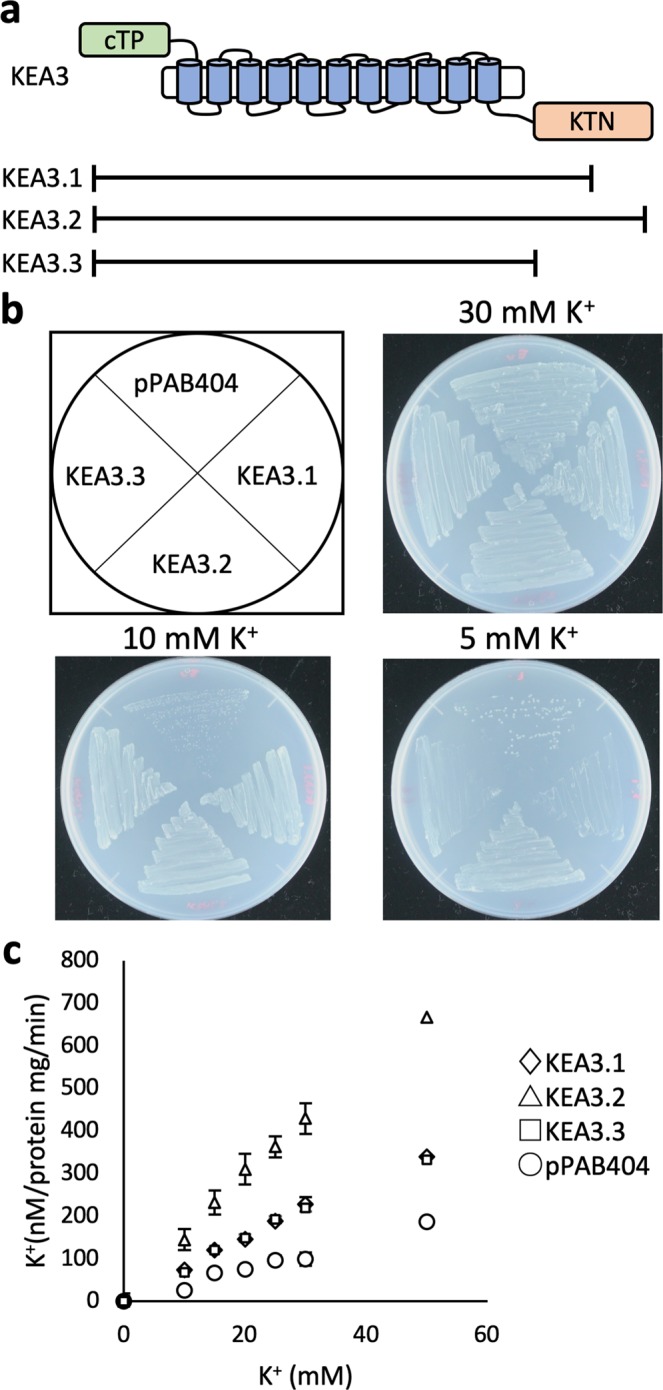
Arabidopsis thaliana contains the putative K+ efflux transporters KEA1-KEA6, similar to KefB and KefC of Escherichia coli. KEA1-KEA3 are involved in the regulation of photosynthetic electron transport and chloroplast development. KEA4-KEA6 mediate pH regulation of the endomembrane network during salinity stress. However, the ion transport activities of KEA1-KEA6 have not been directly characterized. In this study, we used an E. coli expression system to examine KEA activity. KEA1-KEA3 and KEA5 showed bi-directional K+ transport activity, whereas KEA4 and KEA6 functioned as a K+ uptake system. The thylakoid membrane-localized Na+/H+ antiporter NhaS3 from the model cyanobacterium Synechocystis is the closest homolog of KEA3. Changing the putative Na+/H+ selective site of KEA3 (Gln-Asp) to that of NhaS3 (Asp-Asp) did not alter the ion selectivity without loss of K+ transport activity. The first residue in the conserved motif was not a determinant for K+ or Na+ selectivity. Deletion of the possible nucleotide-binding KTN domain from KEA3 lowered K+ transport activity, indicating that the KTN domain was important for this function. The KEA3-G422R mutation discovered in the Arabidopsis dpgr mutant increased K+ transport activity, consistent with the mutant phenotype. These results indicate that Arabidopsis KEA1-KEA6 act as K+ transport systems, and support the interpretation that KEA3 promotes dissipation of ΔpH in the thylakoid membrane.


Conflict of interest statement

The authors declare no competing interests.

Figures

Figure 1
Figure 1
K+ transport activity of KEA1-KEA6. (a) Predicted membrane topology of KEA1-KEA6. KEA1-KEA3, are localized in chloroplasts of Arabidopsis thaliana and possess a chloroplast transit peptide (cTP) at their N-terminus and a K+ transport nucleotide binding (KTN) domain at their C-terminus. KEA4-KEA6 may not be localized in chloroplasts. Prediction programs used were ChloroP 1.1 (http://www.cbs.dtu.dk/services/ChloroP/) for chloroplast transit peptide and SOSUI (http://harrier.nagahama-i-bio.ac.jp/sosui/) for transmembrane domains. (b) Growth complementation assay of an E. coli K+ uptake deficient mutant (LB2003) expressing KEA1-KEA6. Transformants were grown on synthetic medium supplemented with 5, 10 or 30 mM KCl at 30 °C for 24 h. Cells transformed with E. coli Kup (EcKup) or the empty vector were included as positive and negative control, respectively. (c) K+ uptake activity into LB2003 containing KEA1-KEA6 (closed symbols) or the empty vector pPAB404 as negative control (open symbols in the KEA1 graph or broken lines in the rest). The data for the control shown in each graph is the same. For the assay, KCl was added to a final concentration of 10 mM to the cells suspended in 200 mM HEPES-NaOH (pH 8.0). Error bars indicate SD (**p < 0.01, 0.01 < *p < 0.05, n = 3). (d) K+ efflux rate from the same transformants as in (c). Cells (16 μL) were added to 200 μL of a solution containing 0.4 M NaCl and 20 mM HEPES-NaOH (pH 8.0) at t = 0. Error bars indicate SD (**p < 0.01, 0.01 < *p < 0.05, n = 3). The symbols are the same as in (c).
Figure 2
Figure 2
Na+ transport activity of KEA1-KEA6. (a) Complementation assay of E. coli TO114 containing plasmids encoding KEA1-KEA6 or the empty vector pPAB404. Transformants were grown on medium supplemented with 0, 50 or 150 mM NaCl at 30 °C for 24 h. NhaS3, a Synechocystis sp. PCC 6803 Na+/H+ antiporter, was used as a positive control. (b) Na+ uptake by E. coli TO114 containing KEA1-KEA6 (closed symbols) or pPAB404 (open symbols) as a negative control. The broken lines represent the data obtained with pPAB404 shown in the graph on the left. NaCl was added to a final concertation of 10 mM to the cells suspended in 200 mM HEPES-TEA (pH 8.0). Error bars indicate SD (**p < 0.01, 0.01 < *p < 0.05, n = 3).
Figure 3
Figure 3
K+/H+ and Na+/H+ antiporter activity of KEA1-KEA6. (a) Representative profile of K+/H+ antiporter activity of KEA1-KEA6 in E. coli membrane vesicles. The percentage of fluorescence dequenching elicited by the addition of 8 mM KCl (closed triangle) was plotted relative to that of NH4Cl-induced dequenching (open triangle). Solid lines represent the results of KEA1-KEA6 and dashed lines indicate the data obtained with the negative control (empty vector) under the same conditions. (b) Representative profile of Na+/H+ antiporter activity of KEA1-KEA6 and NhaS3. The assay was performed as for (a) except that NaCl was added instead of KCl. (c) Model summarizing the cellular localization and function of KEA1-KEA6. (d) pH dependency of KEA3-mediated K+ efflux by E. coli TO114 cells. The measurement was performed in the same way as in Fig. 1(d) but with different buffers; 10 mM MES-NaOH (pH 6.0) or 20 mM HEPES-NaOH (pH 7.0 and pH 8.0). Closed symbols, KEA3; open symbols, pPAB404. Error bars indicate SD (n = 3).
Figure 4
Figure 4
Ion transport activity of KEA3-Q273D. (a) Amino acid alignment of Arabidopsis KEA3, E. coli KefC (EcKefC) and Synechocystis NhaS3. The residues that may determine selectivity of K+ and Na+ are shown in red. (b) Salinity tolerance of E. coli TO114 containing KEA3-Q273D, KEA3, NhaS3 or pPAB404 on media supplemented with 0, 70 or 100 mM NaCl at 30 °C for 24 h. (c) Na+ uptake activity of E. coli TO114 containing KEA3, KEA3-Q273D or the empty vector. Na+ influx was initiated by addition of 10 mM NaCl (final concentration) into the buffer at t = 0. Error bars indicate SD (n = 3). (d) Growth assay of E. coli LB2003 containing KEA3-Q273D, KEA3 or pPAB404. Cells were grown on synthetic medium supplemented with 5, 10 or 30 mM KCl at 30 °C for 24 h. (e) K+ efflux rate from the same E. coli TO114 transformants as in (c). Cells (16 μL) were added into 200 μL of a solution containing 0.4 M NaCl and 20 mM HEPES-NaOH (pH 8.0) at t = 0. Error bars indicate SD (n = 3).
Figure 5
Figure 5
K+ uptake activities of KEA3 splice variants. (a) Diagram depicting the three splice variants KEA3.1, KEA3.2 and KEA3.3. cTP, chloroplast transit peptide; KTN, K+ transport nucleotide binding domain. (b) Growth of E. coli LB2003 containing FLAG-KEA3.1, 3.2, 3.3 or the empty vector on synthetic medium supplemented with 5, 10 or 30 mM KCl at 30 °C for 24 h. (c) K+ content of the same transformants as in (b) incubated in 200 mM HEPES-NaOH (pH 8.0) with varying concentrations of KCl. Aliquots were taken after incubation for 1 min. Error bars indicate SD (n = 3).
Figure 6
Figure 6
K+ transport activities of KEA3 variants lacking the KTN domain. (a) Growth of E. coli LB2003 containing KEA3, KEA3∆509-777 or the empty vector pTrcHis2B on synthetic medium supplemented with 5, 10 or 30 mM KCl at 30 °C for 24 h. (b) K+ uptake activity by the same E. coli LB2003 transformants. KCl was added to the cell suspension to a final concentration of 10 mM in 200 mM HEPES-NaOH (pH 8.0). Error bars indicate SD (**p < 0.01, 0.01 < *p < 0.05, n = 3). (c) K+ efflux from E. coli TO114 containing pTrcHis2B-KEA3, pTrcHis2B-KEA3∆509-777 or pTrcHis2B. The cells (16 μL) were added to 200 μL of 0.4 M NaCl and 20 mM HEPES-NaOH (pH 8.0) at t = 0. Error bars indicate SD (*p < 0.05, n = 3).
Figure 7
Figure 7
Assessment of KEA3-G422R variant function. (a) Position of the Arabidopsis dpgr point mutation (G422R) in the 10th transmembrane domain in KEA3 (top) and amino acid sequence alignment showing the corresponding region of E. coli NhaA, Synechocystis NhaS3 and Arabidopsis KEA3 (bottom). The conserved Gly (G422 in KEA3) and the Lys that is involved in ion transport are marked in red and blue, respectively. (b) K+ efflux measurement of E. coli TO114 containing KEA3-His-tag, KEA3-G422R-His-tag or the empty vector pTrcHis2B. Cells (16 μL) were mixed with 200 μL of 0.4 M NaCl in 20 mM HEPES-NaOH (pH 8.0) at t = 0. Error bars indicate SD (*p < 0.05, n = 3). The broken line represents the same data for E. coli containing the empty vector pTrcHis2B shown in Fig. 6c for comparison (left). Representative profile of immunoblot detection of KEA3-His-tag and KEA3-G422R-His-tag proteins. Membrane fractions corresponding to 7 μg of protein per lane were loaded onto the gel. Quantification of bands was conducted with ImageJ. Full images of representative data are indicated in Supplemental Fig. S3. The arrow is pointing at the KEA3/KEA3-G422R band (center). Relative K+ efflux activity of KEA3-G422R-His-tag with respect to KEA3-His-tag was calculated from the data at 15 min in the left panel (**p < 0.01, n = 3) (right). (c) K+ uptake by E. coli LB2003 containing KEA3-His-tag, KEA3-G422R-His-tag or pTrcHis2B. KCl was added to the cells to a final concentration of 20 mM (pH 8.0). Error bars indicate SD (n = 3). The broken line represents the same data for E. coli containing pTrcHis2B shown in Fig. 6b for comparison (left). Representative profile of immunoblot detection of KEA3-His-tag and KEA3-G422R-His-tag. Membrane fractions corresponding to 7 μg of protein were loaded onto the gel. Quantification of proteins was conducted with ImageJ (center). Full images of representative data are indicated in Supplemental Fig. S3. Relative K+ uptake activity of KEA3-G422R-His-tag with respect to KEA3-His-tag was calculated from the data at 10 minutes in the left panel. Error bars indicate SD (n = 3) (right).

References

    1. Etherton B., Higinbotham N. Transmembrane Potential Measurements of Cells of Higher Plants as Related to Salt Uptake. Science. 1960;131(3398):409–410. doi: 10.1126/science.131.3398.409. - DOI - PubMed
    1. Cheeseman, J. M. & Hanson, J. B. Mathematical analysis of the dependence of cell potential on external potassium in corn roots. Plant Physiol (1979). - PMC - PubMed
    1. Maathuis, F. J. M. & Sanders, D. Energization of potassium uptake in Arabidopsis thaliana. Planta, 10.1007/BF00195686 (1993).
    1. Matsuda N, et al. Na+-dependent K+ uptake Ktr system from the cyanobacterium Synechocystis sp. PCC 6803 and its role in the early phases of cell adaptation to hyperosmotic shock. J. Biol. Chem. 2004;279:54952–54962. doi: 10.1074/jbc.M407268200. - DOI - PubMed
    1. Nanatani Kei, Shijuku Toshiaki, Takano Yousuke, Zulkifli Lalu, Yamazaki Tomoko, Tominaga Akira, Souma Satoshi, Onai Kiyoshi, Morishita Megumi, Ishiura Masahiro, Hagemann Martin, Suzuki Iwane, Maruyama Hisataka, Arai Fumihito, Uozumi Nobuyuki. Comparative Analysis ofkdpandktrMutants Reveals Distinct Roles of the Potassium Transporters in the Model Cyanobacterium Synechocystis sp. Strain PCC 6803. Journal of Bacteriology. 2014;197(4):676–687. doi: 10.1128/JB.02276-14. - DOI - PMC - PubMed

Publication types

MeSH terms