Comparative Study
. 2019 Jul 11;21(5):87.
doi: 10.1208/s12248-019-0358-2.

Compensated Hydroxyl Radical Protein Footprinting Measures Buffer and Excipient Effects on Conformation and Aggregation in an Adalimumab Biosimilar

Affiliations
Comparative Study

Compensated Hydroxyl Radical Protein Footprinting Measures Buffer and Excipient Effects on Conformation and Aggregation in an Adalimumab Biosimilar

Sandeep K Misra et al. AAPS J. .

Abstract

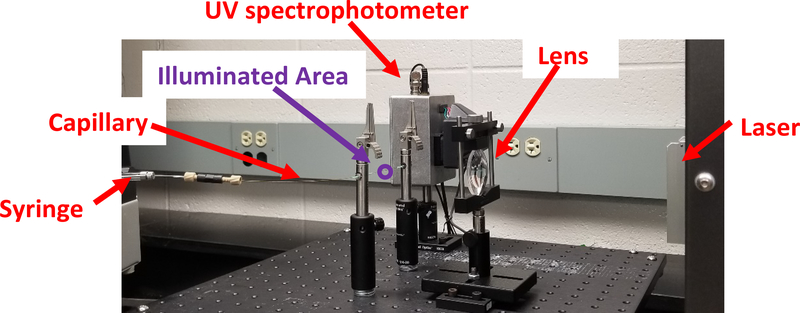
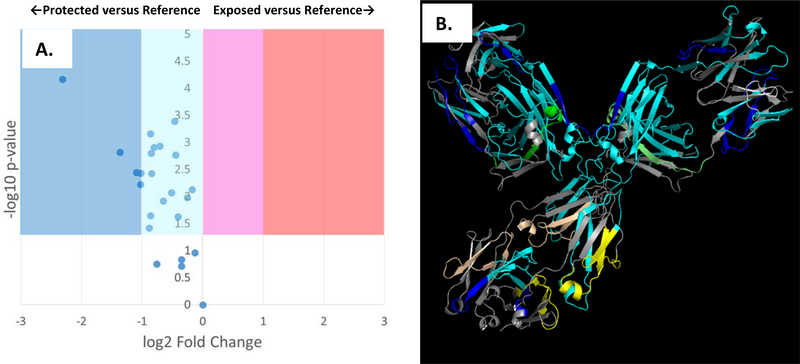
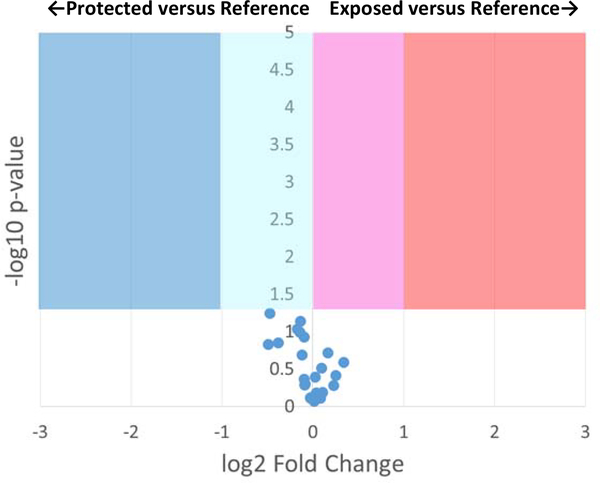
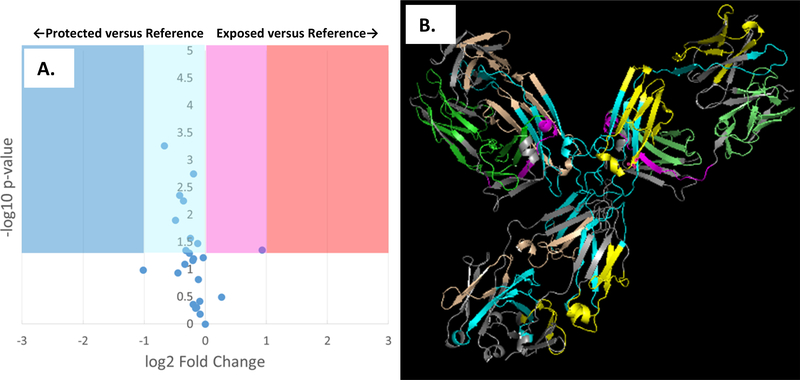
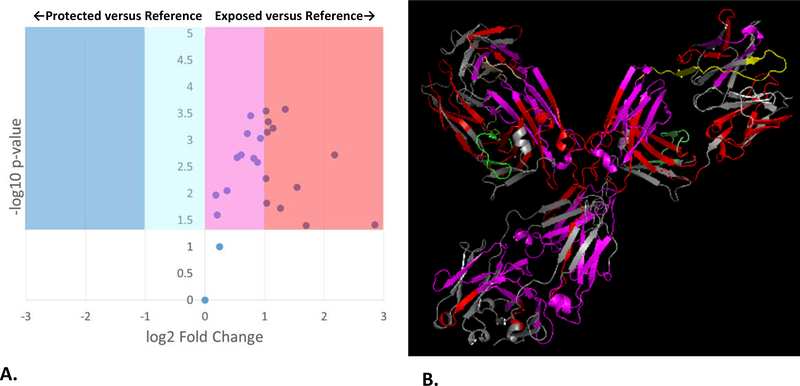
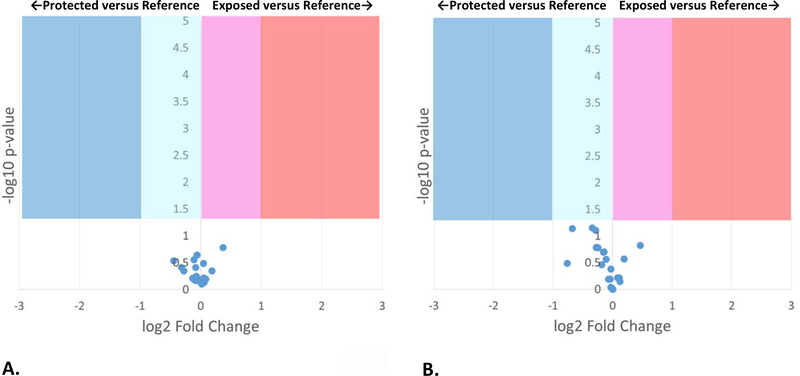
Unlike small molecule drugs, therapeutic proteins must maintain the proper higher-order structure (HOS) in order to maintain safety and efficacy. Due to the sensitivity of many protein systems, even small changes due to differences in protein expression or formulation can alter HOS. Previous work has demonstrated how hydroxyl radical protein footprinting (HRPF) can sensitively detect changes in protein HOS by measuring the average topography of the protein monomers, as well as identify specific regions of the therapeutic protein impacted by the conformational changes. However, HRPF is very sensitive to the radical scavenging capacity of the buffer; addition of organic buffers and/or excipients can dramatically alter the HRPF footprint without affecting protein HOS. By compensating for the radical scavenging effects of different adalimumab biosimilar formulations using real-time adenine dosimetry, we identify that sodium citrate buffer causes a modest decrease in average solvent accessibility compared to sodium phosphate buffer at the same pH. We find that the addition of polysorbate 80 does not alter the conformation of the biosimilar in either buffer, but it does provide substantial protection from protein conformational perturbation during short periods of exposure to high temperature. Compensated HRPF measurements are validated and contextualized by dynamic light scattering (DLS), which suggests that changes in adalimumab biosimilar aggregation are major drivers in measured changes in protein topography. Overall, compensated HRPF accurately measured conformational changes in adalimumab biosimilar that occurred during formulation changes and identified the effect of formulation changes on protection of HOS from temperature extremes.

Keywords: biosimilars; hydroxyl radical protein footprinting; mass spectrometry; protein conformations; therapeutic proteins.


Conflict of interest statement

FINANCIAL CONFLICT OF INTEREST DISCLOSURE

J.S.S., R.O. and S.R.W. disclose a significant financial interest in GenNext Technologies, Inc., an early-stage company seeking to commercialize technologies for protein higher order structure analysis. This manuscript and all data were reviewed by S.K.M., who has no financial conflict of interest, in accordance with University of Mississippi FCOI management practices.

Figures

Figure 1:
Figure 1:. FPOP optical bench for adalimumab biosimilar analysis.
Sample is mixed with H2O2, adenine radical dosimeter and glutamine scavenger and loaded into the syringe. Sample is pushed through the fused silica capillary through the focused beam path of a KrF excimer UV laser. The UV light photolyzes H2O2 into hydroxyl radicals, which oxidizes the protein and adenine dosimeter. The syringe flow pushes the illuminated sample out of the path of the laser prior to the next laser pulse, with an unilluminated exclusion volume between illuminated regions. Immediately after oxidation, the sample is passed through an inline UV spectrophotometer, which measures the UV absorbance of adenine at 265 nm. Sample is then deposited into a quench buffer to eliminate the remaining H2O2 and secondary oxidants.
Figure 2:
Figure 2:. FPOP comparison of adalimumab biosimilar in 50 mM sodium citrate buffer (pH 6.0) after dosimetry-based compensation versus 50 mM sodium phosphate buffer (pH 6.0) as a reference.
FPOP was performed with 15% exclusion volume, 100 mM H2O2, in 100 μm ID capillary, with the radical dosage altered to generate equivalent adenine dosimetry readings. (A.) Volcano plot of FPOP results, using oxidation in sodium phosphate as the reference sample. Each point represents one peptide from the biosimilar, with the X-axis representing the fold change in oxidation amount in citrate buffer as compared to phosphate buffer, and the Y-axis representing the p-value from a two-tailed Student’s t-test. The four shaded regions represent statistically significant changes in oxidation (α = 0.05), with the shade representing the color coding used in the structural visualization. (B.) Structural visualization of the differential FPOP data plotted in the volcano plot. Cyan: <2x decrease in oxidation; Blue: >2x decrease in oxidation; Magenta: <2x increase in oxidation; Red: >2x increase in oxidation; Grey: regions of the protein where no oxidized peptide was detected in any sample. Regions that showed no statistically significant changes in oxidation are colored green (light chain) or yellow (heavy chain).
Figure 3:
Figure 3:. Volcano plot of FPOP comparison of adalimumab biosimilar in 50 mM sodium phosphate buffer, 0.1% polysorbate-80 (pH 6.0) after dosimetry-based compensation versus 50 mM sodium phosphate buffer (pH 6.0) as a reference.
FPOP was performed with 15% exclusion volume, 100 mM H2O2, in 100 μm ID capillary, with the radical dosage altered to generate equivalent adenine dosimetry readings. Each point represents one peptide from the biosimilar, with the X-axis representing the fold change in oxidation amount in citrate buffer as compared to phosphate buffer, and the Y-axis representing the p-value from a two-tailed Student’s t-test. The four shaded regions represent statistically significant changes in oxidation (α = 0.05).
Figure 4:
Figure 4:. FPOP comparison of adalimumab biosimilar in 50 mM sodium phosphate buffer (pH 6.0) after heat shock versus a room temperature reference.
FPOP was performed with 15% exclusion volume, 100 mM H2O2, in 100 μm ID capillary. (A.) Volcano plot of FPOP results, using oxidation at room temperature as the reference sample. Each point represents one peptide from the biosimilar, with the X-axis representing the fold change in oxidation amount after heat shock as compared to the reference, and the Y-axis representing the p-value from a two-tailed Student’s t-test. The four shaded regions represent statistically significant changes in oxidation (α = 0.05), with the shade representing the color coding used in the structural visualization. (B.) Structural visualization of the differential FPOP data plotted in the volcano plot. Cyan: <2x decrease in oxidation; Blue: >2x decrease in oxidation; Magenta: <2x increase in oxidation; Red: >2x increase in oxidation; Grey: regions of the protein where no oxidized peptide was detected in any sample. Regions that showed no statistically significant changes in oxidation are colored green (light chain) or yellow (heavy chain).
Figure 5:
Figure 5:. FPOP comparison of adalimumab biosimilar in 50 mM sodium citratete buffer (pH 6.0) after heat shock versus a room temperature reference.
FPOP was performed with 15% exclusion volume, 100 mM H2O2, in 100 μm ID capillary. (A.) Volcano plot of FPOP results, using oxidation at room temperature as the reference sample. Each point represents one peptide from the biosimilar, with the X-axis representing the fold change in oxidation amount after heat shock as compared to the reference, and the Y-axis representing the p-value from a two-tailed Student’s t-test. The four shaded regions represent statistically significant changes in oxidation (α = 0.05), with the shade representing the color coding used in the structural visualization. (B.) Structural visualization of the differential FPOP data plotted in the volcano plot. Cyan: <2x decrease in oxidation; Blue: >2x decrease in oxidation; Magenta: <2x increase in oxidation; Red: >2x increase in oxidation; Grey: regions of the protein where no oxidized peptide was detected in any sample. Regions that showed no statistically significant changes in oxidation are colored green (light chain) or yellow (heavy chain).
Figure 6:
Figure 6:. FPOP volcano plots of adalimumab biosimilar with 0.1% polysorbate-80 after heat shock versus a room temperature reference.
FPOP was performed with 15% exclusion volume, 100 mM H2O2, in 100 μm ID capillary. Each point represents one peptide from the biosimilar, with the X-axis representing the fold change in oxidation amount after heat shock as compared to the reference, and the Y-axis representing the p-value from a two-tailed Student’s t-test. The four shaded regions represent statistically significant changes in oxidation (α = 0.05). (A.) Adalimumab biosimilar in 50 mM sodium phosphate (pH 6.0); (B.) Adalimumab biosimilar in 50 mM sodium citrate (pH 6.0).

References

    1. Global biopharmaceuticals market growth, trends and forecasts (2016–2021) Current trends in biopharmaceuticals market. Mordor Intelligence: Hyderabad, India; 2016.
    1. Manning MC, Chou DK, Murphy BM, Payne RW, Katayama DS. Stability of protein pharmaceuticals: an update. Pharm Res. 2010;27(4):544–75. doi: 10.1007/s11095-009-0045-6. - DOI - PubMed
    1. Giezen TJ, Mantel-Teeuwisse AK, Strauss S. Safety-related regulatory actions for biologicals approved in the United States and the Europena Union. Journal of the American Medical Society. 2008;300(16):1887–96. - PubMed
    1. Giezen TJ, Schneider CK. Safety assessment of biosimilars in Europe: a regulatory perspective. Generics and Biosimilars Initiative Journal. 2014;September 2014:1–8.
    1. Buxton GV, Greenstock CL, Helman WP, Ross AB. Critical-Review of Rate Constants for Reactions of Hydrated Electrons, Hydrogen-Atoms and Hydroxyl Radicals (.OH/.O-) in Aqueous-Solution. J Phys Chem Ref Data. 1988;17(2):513–886.

Publication types

MeSH terms

LinkOut - more resources