

NMR characterization of solvent accessibility and transient structure in intrinsically disordered proteins
- PMID: 31297688
- PMCID: PMC6692294
- DOI: 10.1007/s10858-019-00248-2
NMR characterization of solvent accessibility and transient structure in intrinsically disordered proteins
Abstract
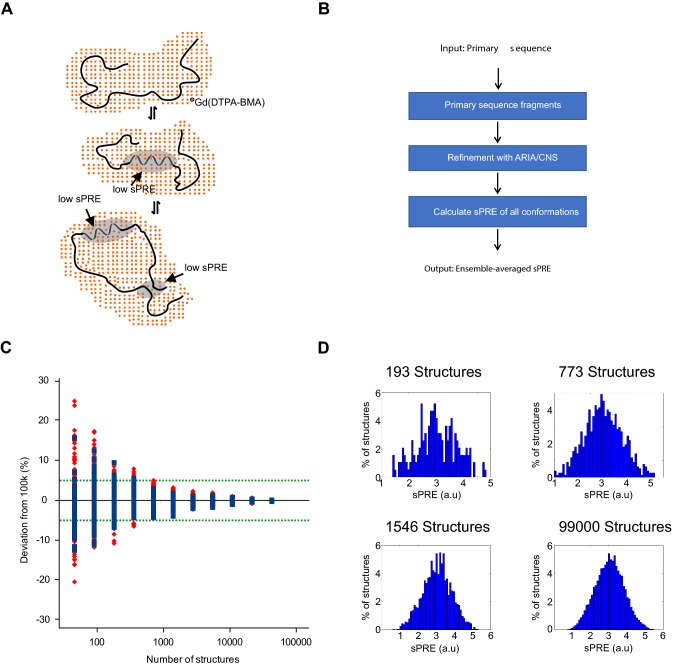
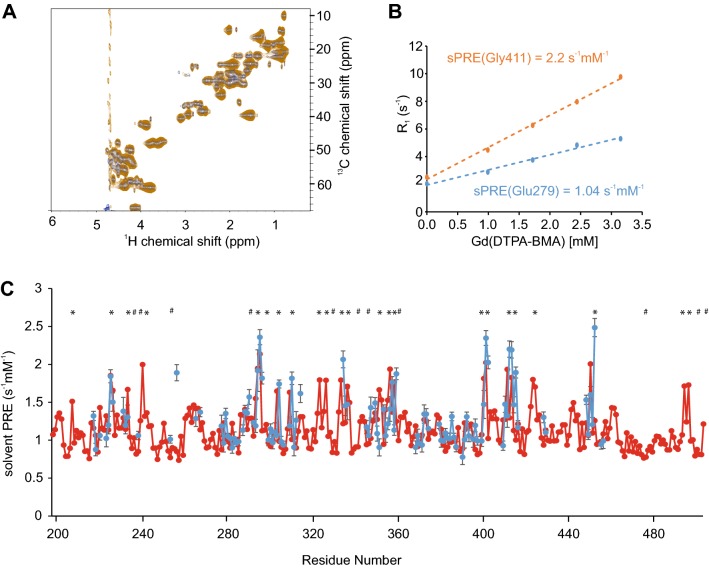
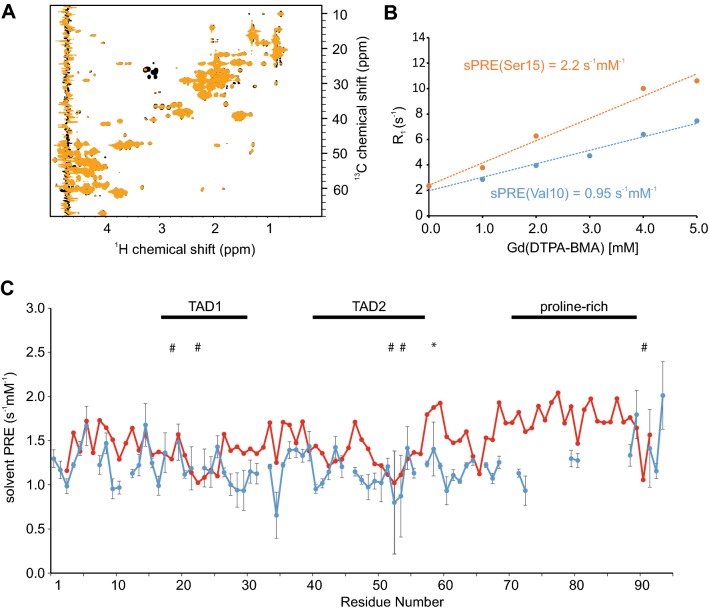
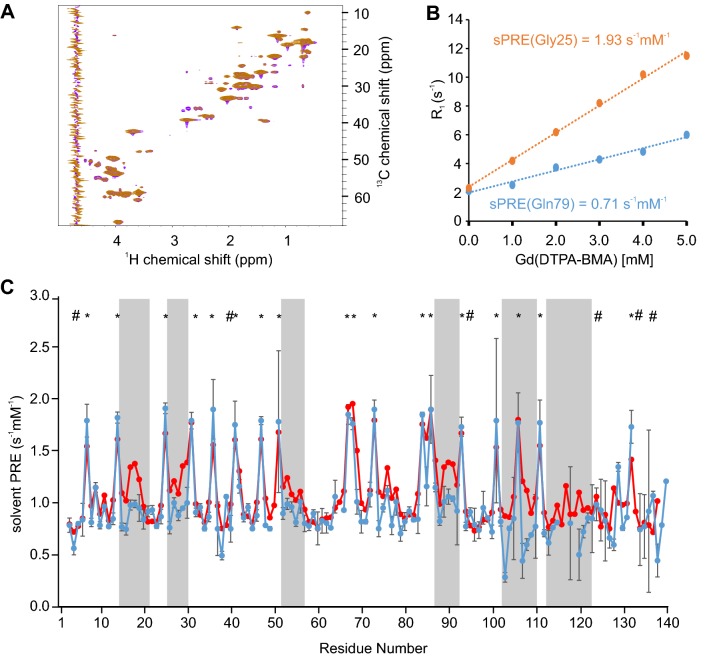
In order to understand the conformational behavior of intrinsically disordered proteins (IDPs) and their biological interaction networks, the detection of residual structure and long-range interactions is required. However, the large number of degrees of conformational freedom of disordered proteins require the integration of extensive sets of experimental data, which are difficult to obtain. Here, we provide a straightforward approach for the detection of residual structure and long-range interactions in IDPs under near-native conditions using solvent paramagnetic relaxation enhancement (sPRE). Our data indicate that for the general case of an unfolded chain, with a local flexibility described by the overwhelming majority of available combinations, sPREs of non-exchangeable protons can be accurately predicted through an ensemble-based fragment approach. We show for the disordered protein α-synuclein and disordered regions of the proteins FOXO4 and p53 that deviation from random coil behavior can be interpreted in terms of intrinsic propensity to populate local structure in interaction sites of these proteins and to adopt transient long-range structure. The presented modification-free approach promises to be applicable to study conformational dynamics of IDPs and other dynamic biomolecules in an integrative approach.
Keywords: FOXO4; Intrinsically disordered proteins; Residual structure; Solvent paramagnetic relaxation enhancement; p53; α-Synuclein.
Figures
Similar articles
-
Probing Surfaces in Dynamic Protein Interactions.J Mol Biol. 2020 Apr 17;432(9):2949-2972. doi: 10.1016/j.jmb.2020.02.032. Epub 2020 Mar 2. J Mol Biol. 2020. PMID: 32135192 Review.
-
Conformational Ensemble of Disordered Proteins Probed by Solvent Paramagnetic Relaxation Enhancement (sPRE).Angew Chem Int Ed Engl. 2018 Oct 8;57(41):13519-13522. doi: 10.1002/anie.201807365. Epub 2018 Sep 12. Angew Chem Int Ed Engl. 2018. PMID: 30125451 Free PMC article.
-
Solvent paramagnetic relaxation enhancement as a versatile method for studying structure and dynamics of biomolecular systems.Prog Nucl Magn Reson Spectrosc. 2022 Oct-Dec;132-133:113-139. doi: 10.1016/j.pnmrs.2022.09.001. Epub 2022 Sep 21. Prog Nucl Magn Reson Spectrosc. 2022. PMID: 36496256 Review.
-
Longitudinal relaxation properties of (1)H(N) and (1)H(α) determined by direct-detected (13)C NMR experiments to study intrinsically disordered proteins (IDPs).J Magn Reson. 2015 May;254:19-26. doi: 10.1016/j.jmr.2015.01.017. Epub 2015 Feb 12. J Magn Reson. 2015. PMID: 25771525
-
Ensemble Calculation for Intrinsically Disordered Proteins Using NMR Parameters.Adv Exp Med Biol. 2015;870:123-47. doi: 10.1007/978-3-319-20164-1_4. Adv Exp Med Biol. 2015. PMID: 26387101 Review.
Cited by
-
FOXO4 interacts with p53 TAD and CRD and inhibits its binding to DNA.Protein Sci. 2022 May;31(5):e4287. doi: 10.1002/pro.4287. Protein Sci. 2022. PMID: 35481640 Free PMC article.
-
Recent Developments in Data-Assisted Modeling of Flexible Proteins.Front Mol Biosci. 2021 Dec 24;8:765562. doi: 10.3389/fmolb.2021.765562. eCollection 2021. Front Mol Biosci. 2021. PMID: 35004845 Free PMC article. Review.
-
Recent Advances in NMR Protein Structure Prediction with ROSETTA.Int J Mol Sci. 2023 Apr 25;24(9):7835. doi: 10.3390/ijms24097835. Int J Mol Sci. 2023. PMID: 37175539 Free PMC article. Review.
-
Observation of pH-Dependent Residual Structure in the Pmel17 Repeat Domain and the Implication for Its Amyloid Formation.Biochemistry. 2023 Nov 21;62(22):3222-3233. doi: 10.1021/acs.biochem.3c00445. Epub 2023 Nov 2. Biochemistry. 2023. PMID: 37917797 Free PMC article.
-
Structural plasticity of the FOXO-DBD:p53-TAD interaction.Nat Commun. 2025 May 27;16(1):4907. doi: 10.1038/s41467-025-59106-5. Nat Commun. 2025. PMID: 40425537 Free PMC article.
References
MeSH terms
Substances
Grants and funding
LinkOut - more resources
Full Text Sources
Research Materials
Miscellaneous
