. 2019 Aug;9(8):e01341.
doi: 10.1002/brb3.1341. Epub 2019 Jul 11.

Combining Prospective Acquisition CorrEction (PACE) with retrospective correction to reduce motion artifacts in resting state fMRI data

Affiliations

Combining Prospective Acquisition CorrEction (PACE) with retrospective correction to reduce motion artifacts in resting state fMRI data

Pradyumna Lanka et al. Brain Behav. 2019 Aug.

Abstract

Background: Head movement in the scanner causes spurious signal changes in the blood-oxygen-level-dependent (BOLD) signal, confounding resting state functional connectivity (RSFC) estimates obtained from functional magnetic resonance imaging (fMRI). We examined the effectiveness of Prospective Acquisition CorrEction (PACE) in reducing motion artifacts in BOLD data.

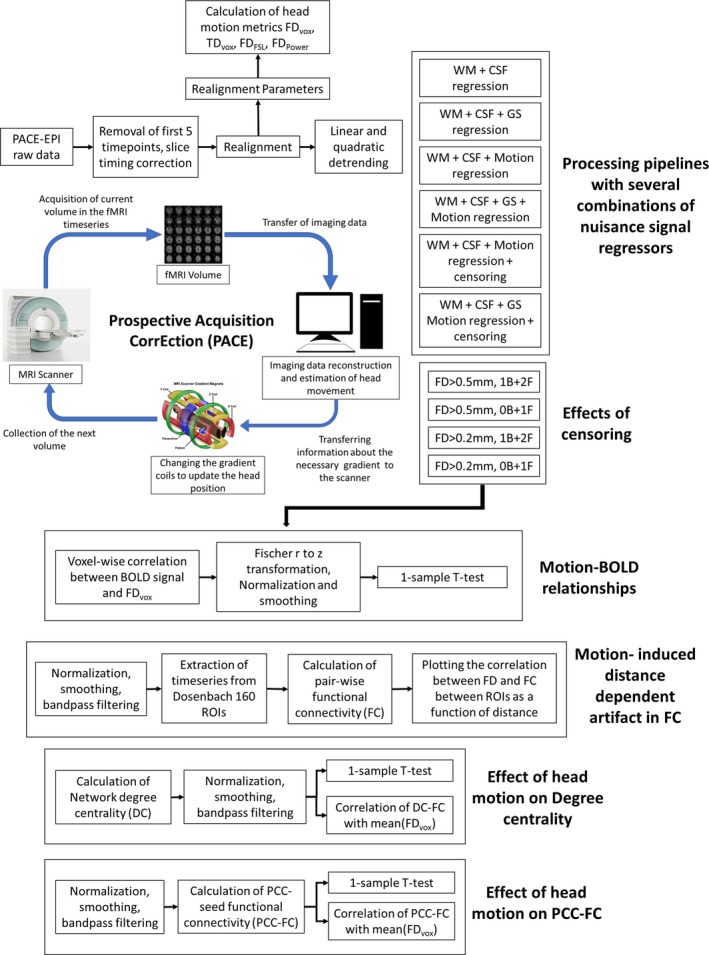
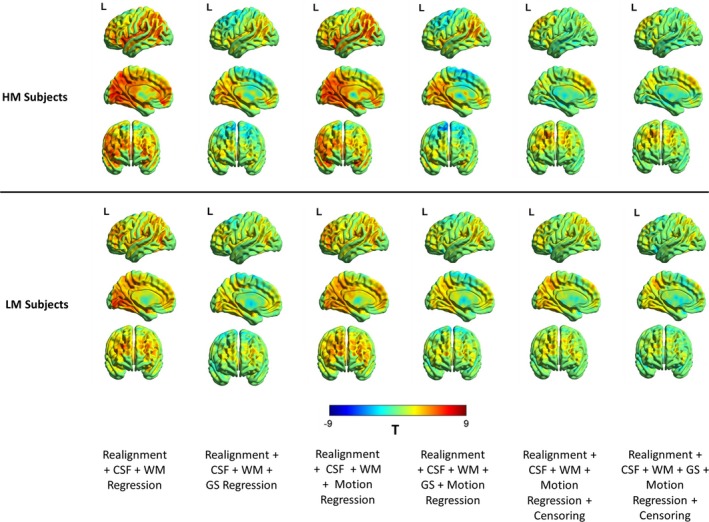
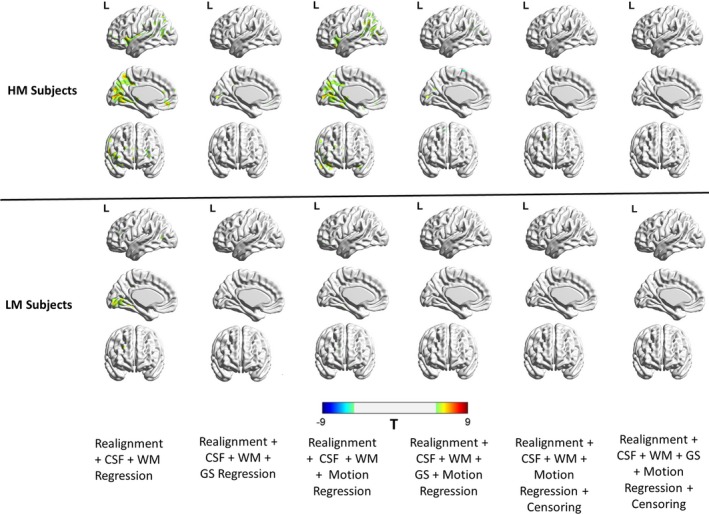
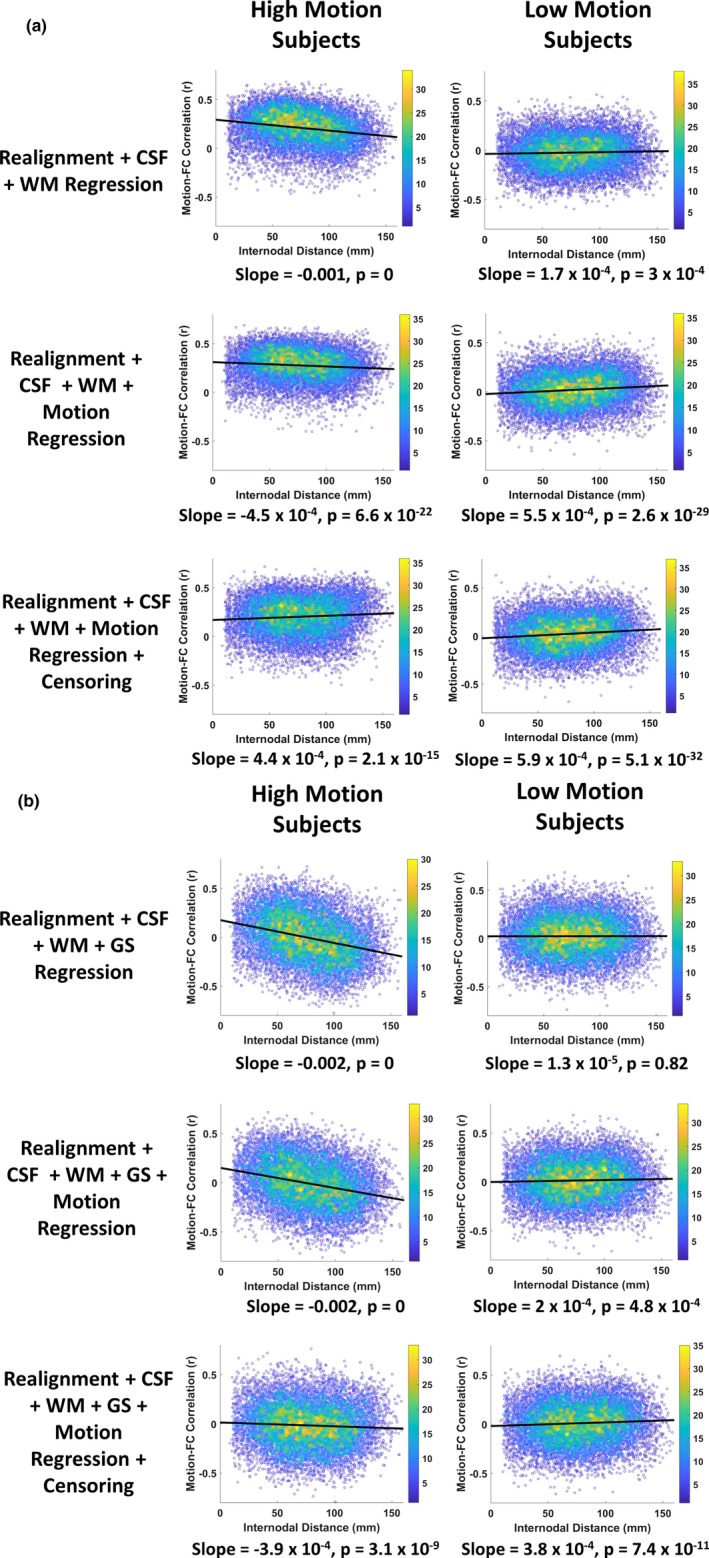
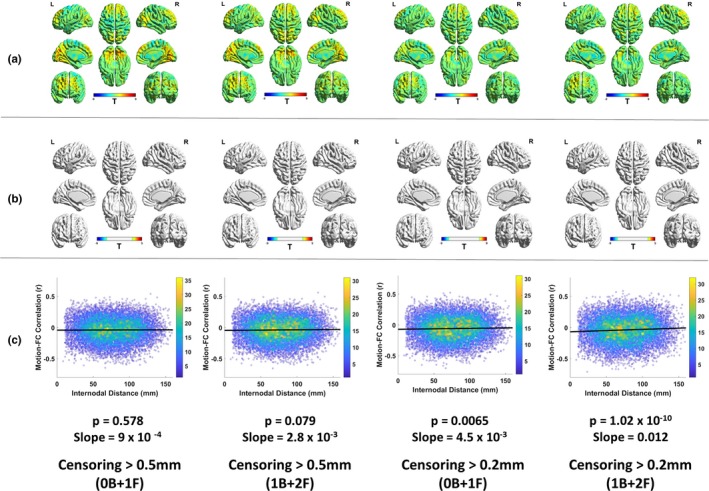
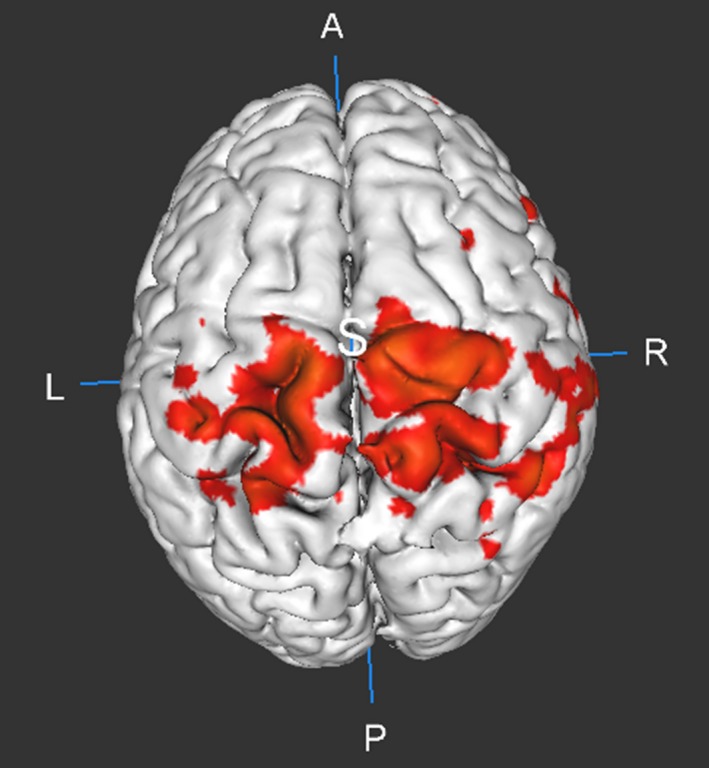
Methods: Using PACE-corrected RS-fMRI data obtained from 44 subjects and subdividing them into low- and high-motion cohorts, we investigated voxel-wise motion-BOLD relationships, the distance-dependent functional connectivity artifact and the correlation between head motion and connectivity metrics such as posterior cingulate seed-based connectivity and network degree centrality.

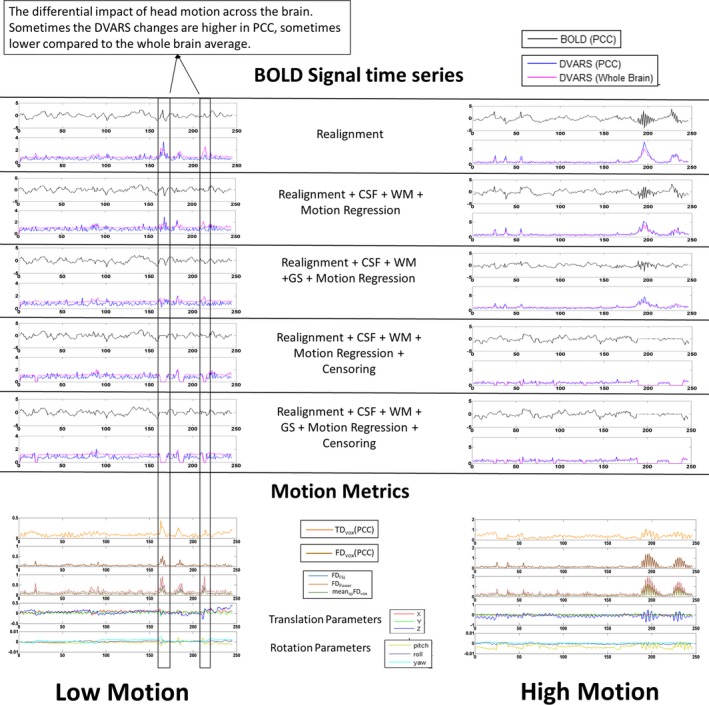
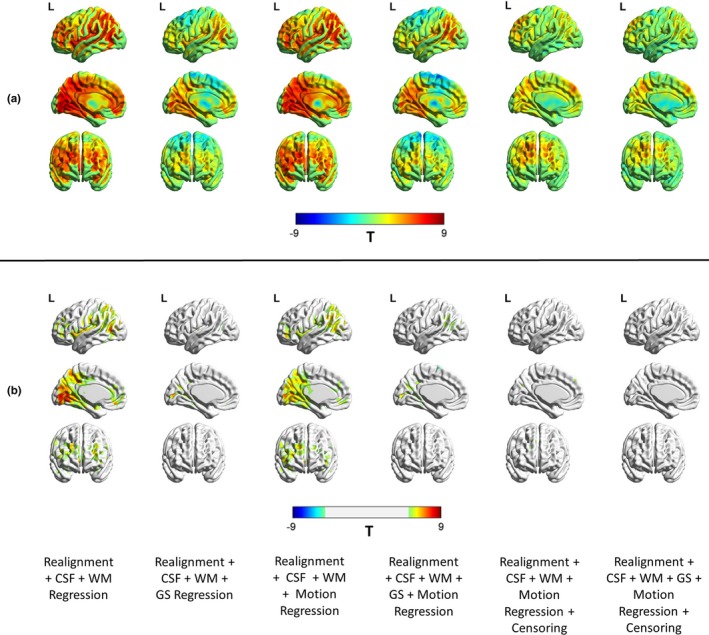
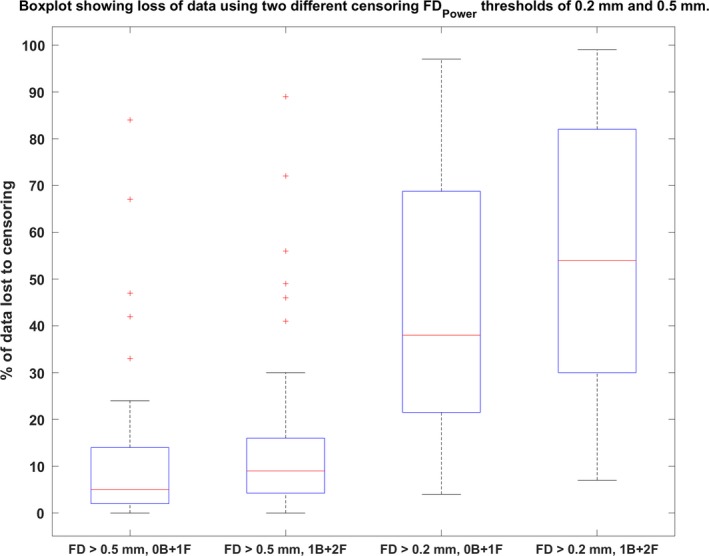
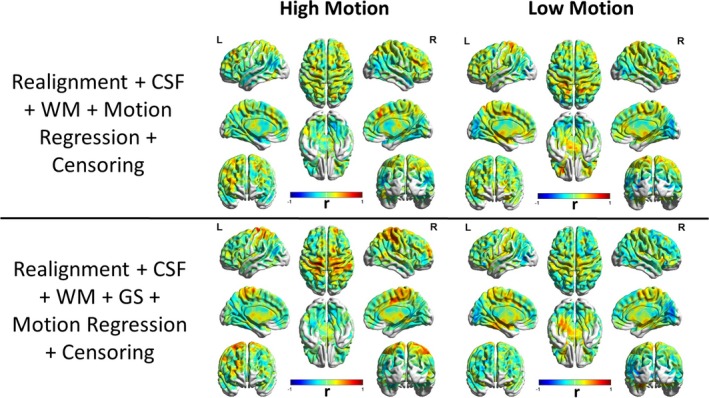
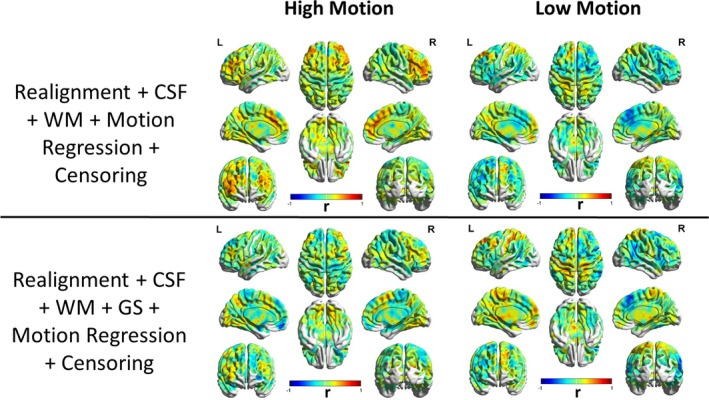
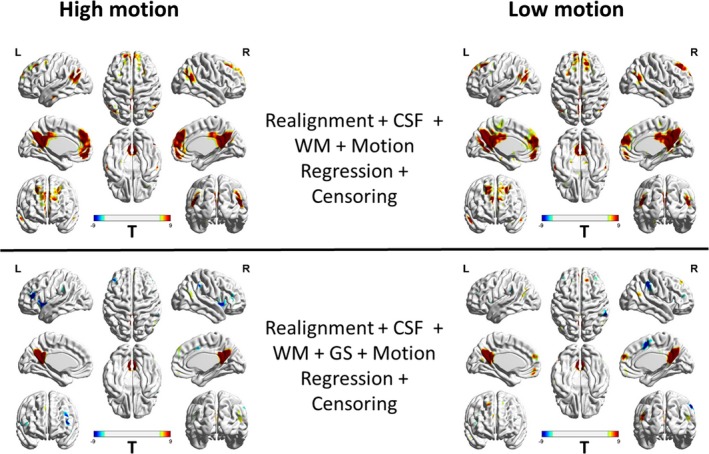
Results: Our results indicate that, when PACE is used in combination with standard retrospective motion correction strategies, it provides two principal advantages over conventional echo-planar imaging (EPI) RS-fMRI data: (a) PACE was effective in eliminating significant negative motion-BOLD relationships, shown to be associated with signal dropouts caused by head motion, and (b) Censoring with a lower threshold (framewise displacement >0.5 mm) and a smaller window around the motion corrupted time point provided qualitatively equivalent reductions in the motion artifact with PACE when compared to a more conservative threshold of 0.2 mm required with conventional EPI data.

Conclusions: PACE when used in conjunction with retrospective motion correction methods including nuisance signal and motion parameter regression, and censoring, did prove effective in almost eliminating head motion artifacts, even with a lower censoring threshold. Use of a lower censoring threshold could provide substantial savings in data that would otherwise be lost to censoring. Three-dimensional PACE has negligible overhead in terms of scan time, sequence modifications or additional and hence presents an attractive option for head motion correction in high-throughput resting-state BOLD imaging.

Keywords: functional connectivity; head motion; motion artifacts; prospective motion correction; resting state fMRI.


Conflict of interest statement

The authors declare that there is no conflict of interest.

Figures

Figure 1
Figure 1
Flowchart summarizing our processing pipeline. Picture of the gradient coil taken from MRI: A Guided Tour, 2018 (Coyne, 2012). Reproduced with permission from the author. B, number of backward frames from the motion corrupted time points removed due to censoring; BOLD, blood‐oxygen‐level‐dependent signal; CSF, cerebrospinal fluid signal; EPI, echo‐planar imaging; F, number of forward frames from the motion corrupted time points removed due to censoring; FD, framewise displacement; GS, global signal; PCC, posterior cingulate cortex; TD, total displacement; WM, white matter signal
Figure 2
Figure 2
The PACE‐corrected time‐series extracted from the posterior cingulate cortex (PCC 0, −53, 26; 10 mm diameter sphere) at every step in the preprocessing pipeline for a representative subject in the high‐motion (right) and low‐motion (left) subgroups. Please note that the range of the y‐axis for both the groups is the same for blood‐oxygen‐level‐dependent (BOLD) time series and range from −5 to 5. However, for the motion metrics plots the range on the y‐axes are different in the left and right panels in order to better visualize the type of motion in low‐motion subjects. Large changes in the head position are associated with large changes in the BOLD signal. Regression of nuisance variables was not successful in eliminating large spikes in head motion in the high‐motion subject, but they were relatively successful in the low‐motion subject. The head motion can sometimes only selectively affect PCC, but not the whole brain. DVARS: Derivative of root mean squared variance over voxels. CSF, cerebrospinal fluid signal; FD, framewise displacement; FDFSL, FD calculated as described in Jenkinson et al. (2002); FDPower, FD calculated according to Power et al., (2012); FDvox, voxel‐specific framewise displacement calculated as detailed in Yan et al. (2013); GS, global signal; TDvox, voxel‐specific total displacement; WM, white matter signal
Figure 3
Figure 3
The average BOLD signal variance (adjusted R 2) explained by the 24 regressors used in the Friston‐24 motion regression model (a) and the six realignment parameters (b). Figures (a and b) are similar, except for that fact that 24 motion regressors (a) explain far more variance across the brain compared to using just six motion parameters (b). These motion regressors explain a modest amount of variance in the brain, with more variance explained in the frontal regions and less variance explained in other (especially posterior) regions. This is to be expected given that frontal regions experience more displacement than other regions of the brain Yan et al., (2013). BOLD, blood‐oxygen‐level‐dependent; L, left view; R, right view
Figure 4
Figure 4
Illustration of the reduction in the relationship between motion and PACE‐corrected BOLD data for different nuisance variable regressors. The unthresholded T‐maps are shown in (a) and the thresholded (p < 0.05, FDR corrected) maps are shown in (b). The results indicate that motion regression did not remove motion‐BOLD relationships visibly. However, GS regression did seem to reduce these relationships, with some regions now showing a negative correlation. (b) After the nuisance variance regressions, some regions did exhibit significant positive relationships with the BOLD signal, though no negative relationships remained. With censoring, both positive and negative relationships are almost absent. BOLD, blood‐oxygen‐level‐dependent; CSF, cerebrospinal fluid signal; GS, global signal; L, left view; PACE, Prospective Acquisition CorrEction; WM, white matter signal
Figure 5
Figure 5
The unthresholded T‐maps illustrating the relationship between the PACE‐corrected BOLD signal and voxel‐specific framewise displacement for the high‐motion and the low‐motion subgroups. Cerebrospinal fluid, white matter, and motion regression are relatively ineffective in reducing the motion‐BOLD relationships both in high‐motion and low‐motion subjects. Large motion‐BOLD relationships are comparatively fewer in low‐motion subjects, as expected. Global signal regression significantly increased negative motion‐BOLD relationships in high‐motion subgroup, but not by much in the low‐motion subgroup. With motion censoring, GSR has a relatively negligible effect on the motion‐BOLD relationships in both the subgroups. BOLD, blood‐oxygen‐level‐dependent; CSF, cerebrospinal fluid signal; GS, global signal; HM, high‐motion cohort; L, left view; LM, low‐motion cohort; PACE, Prospective Acquisition CorrEction; WM, white matter signal
Figure 6
Figure 6
Thresholded correlation maps between the PACE‐corrected BOLD signal and voxel‐specific framewise displacement across the brain. The figure shows the relative absence of significant (p < 0.05, FDR corrected) motion‐BOLD relationships in low‐motion subjects compared to the high‐motion subjects. The reduction in motion‐BOLD relationships after GS and motion regression in high‐motion subjects is stark, although residual correlations in the visual cortex are only eliminated after motion censoring. BOLD, blood‐oxygen‐level‐dependent; CSF, cerebrospinal fluid signal; GS, global signal; HM, high‐motion cohort; L, left view; LM, low‐motion cohort; PACE, Prospective Acquisition CorrEction; WM, white matter signal
Figure 7
Figure 7
The figure shows the framewise displacement–resting state functional connectivity (FD‐RSFC) correlations for subjects in the high‐ and low‐motion subgroups (a) without global signal regression (GSR), and (b) with GSR. The motion‐induced distance‐dependent RSFC artifact is almost absent in the low‐motion subgroup for all stages and all combinations of nuisance signal regression. The color bar on the right indicates the density of points. The high‐motion subgroup does show the artifact which is only reduced after motion censoring. GSR distorts the FD‐RSFC relationships significantly, especially in the high‐motion subgroup, though after motion censoring, the data are relatively free from the artifact in both the subgroups, with and without GSR. CSF, cerebrospinal fluid signal; GS, global signal; WM, white matter signal
Figure 8
Figure 8
A boxplot shows the percent loss of data for four different censoring scenarios with framewise displacement (FDPower) used to quantify head motion. In the four scenarios a head motion threshold (FDPower either >0.2 mm or >0.5 mm) was used to mark time points corrupted with head motion, and the time point, along with either one forward (0B + 1F) or two forward and one backward (1B + 2F), were also removed with the motion corrupted time points. The boxplot indicates a large loss of data, with data from many subjects completely unusable when using a stricter censoring threshold (FDPower >0.2 mm), compared to a more lenient threshold (FDPower >0.5 mm).
Figure 9
Figure 9
The absence of motion artifacts for the four cases of motion censoring. (a) The motion‐BOLD relationships indicate very small positive motion‐BOLD relationships in the visual cortex, which are removed by censoring the volumes at a lower (more stringent) threshold. (b) Thresholded motion‐BOLD relationships for the figures shown in (a). It must be noted that none of the volumes exhibited significant correlations for all the four scenarios of censoring. (c) The framewise displacement—resting state functional connectivity correlations, which can be used to detect the presence of the motion‐induced distance‐dependent functional connectivity artifact, shows that for all the cases of censoring, the artifact was absent. The color bar on the right indicates the density of points. A stricter threshold for censoring or a larger censoring window does not seem to have a detectable improvement in data quality. When taken in light of findings from the Figure 8, it appears that PACE, when combined with retrospective motion correction allows us to obtain same quality data with a more liberal threshold, thereby saving data. B, number of backward frames from the motion corrupted time points removed due to censoring; BOLD, blood‐oxygen‐level‐dependent; F, number of forward frames from the motion corrupted time points removed due to censoring; L, left view; R, right view
Figure 10
Figure 10
Unthresholded spatial map of the Pearson's correlation coefficient between the degree centrality obtained from PACE‐corrected BOLD data and residual head motion as captured by mean voxel‐wise framewise displacement across subjects, shown for subjects in high‐motion (left) and low‐motion (right) groups separately. Large positive correlations were observed in the sensorimotor cortex in the low‐motion subgroup as well as in the high‐motion subgroup with nuisance variable regression and censoring. This illustrates that some changes in functional connectivity might have a neural origin and it could be confounded with changes due to motion artifact as even motion artifact causes changes in functional connectivity. BOLD, blood‐oxygen‐level‐dependent; CSF, cerebrospinal fluid signal; GS, global signal; L, left view; PACE, Prospective Acquisition CorrEction; R, right view; WM, white matter signal;
Figure 11
Figure 11
Figure showing the thresholded (p < 0.05) correlation (R) map of network degree centrality (DC) with head motion of the brain after nuisance variable regression including CSF, white matter signal, Friston‐24 motion regression and motion censoring in all the subjects. Significant positive correlations can be observed between residual head motion in PACE‐corrected data and DC in the sensorimotor cortex. This shows that DC in the sensorimotor could possibly be attributed to neural processes responsible for head motion. A, anterior; CSF, cerebrospinal fluid signal; L, left; P, posterior; PACE, Prospective Acquisition CorrEction; R, right; S, superior
Figure 12
Figure 12
Correlation between seed‐based functional connectivity of posterior cingulate cortex and head motion (as captured by mean voxel‐wise framewise displacement across subjects) shown for subjects with high head motion (left) and low head motion (right) groups separately. Large correlations were observed across the brain in both low‐ and high‐motion subgroups. With motion censoring and global signal regression, the correlations in the high‐motion group were reduced. This illustrates their relative effectiveness in reducing motion artifacts particularly in subjects with high head motion. CSF, cerebrospinal fluid signal; GS, global signal; L, left view; R, right view; WM, white matter signal
Figure 13
Figure 13
A comparison of regions with significant correlations (p < 0.05, FDR corrected) with posterior cingulate cortex (PCC: 0, −53, 26; 10 mm diameter sphere) as the seed region PCC‐functional connectivity. This figure is shown for both high‐motion (left) and low‐motion subjects (rights). With the addition of global signal regression (GSR), anticorrelated networks were observed. In high‐motion subjects with GSR, the correlation between medial prefrontal cortex and PCC was reduced to chance levels, while it was still present in the low‐motion subjects. This illustrates that GSR is also likely removing neural components along with motion‐induced noise signal. CSF, cerebrospinal fluid signal; GS, global signal; L, left view; R, right view; WM, white matter signal

Similar articles

Cited by

References

    1. Beall, E. B. , & Lowe, M. J. (2014). SimPACE: Generating simulated motion corrupted BOLD data with synthetic‐navigated acquisition for the development and evaluation of SLOMOCO: A new, highly effective slicewise motion correction. NeuroImage, 101, 21–34. 10.1016/j.neuroimage.2014.06.038 - DOI - PMC - PubMed
    1. Bright, M. G. , & Murphy, K. (2013). Removing motion and physiological artifacts from intrinsic BOLD fluctuations using short echo data. NeuroImage, 64(1), 526–537. 10.1016/j.neuroimage.2012.09.043 - DOI - PMC - PubMed
    1. Buckner, R. L. , Andrews‐Hanna, J. R. , & Schacter, D. L. (2008). The brain's default network: Anatomy, function, and relevance to disease. Annals of the New York Academy of Sciences, 1124, 1–38. 10.1196/annals.1440.011 - DOI - PubMed
    1. Coyne, K. (2012). MRI: A guided tour. Retrieved from https://nationalmaglab.org/education/magnet-academy/learn-the-basics/sto.... May 19, 2019.
    1. Dosenbach, N. U. F. , Nardos, B. , Cohen, A. L. , Fair, D. A. , Power, J. D. , Church, J. A. , … Schlaggar, B. L. (2010). Prediction of individual brain maturity using fMRI. Science, 329(5997), 1358–1361. 10.1126/science.1194144 - DOI - PMC - PubMed