

Validation of a real-time bladder sensation meter during oral hydration in healthy adults: Repeatability and effects of fill rate and ultrasound probe pressure
- PMID: 31298501
- PMCID: PMC6983922
- DOI: 10.1111/luts.12275
Validation of a real-time bladder sensation meter during oral hydration in healthy adults: Repeatability and effects of fill rate and ultrasound probe pressure
Abstract
Objectives: A non-invasive protocol was previously developed using three-dimensional ultrasound and a sensation meter to characterize real-time bladder sensation. This study the protocol by measuring the effects of fill rateand ultrasound probe pressure during oral hydration.
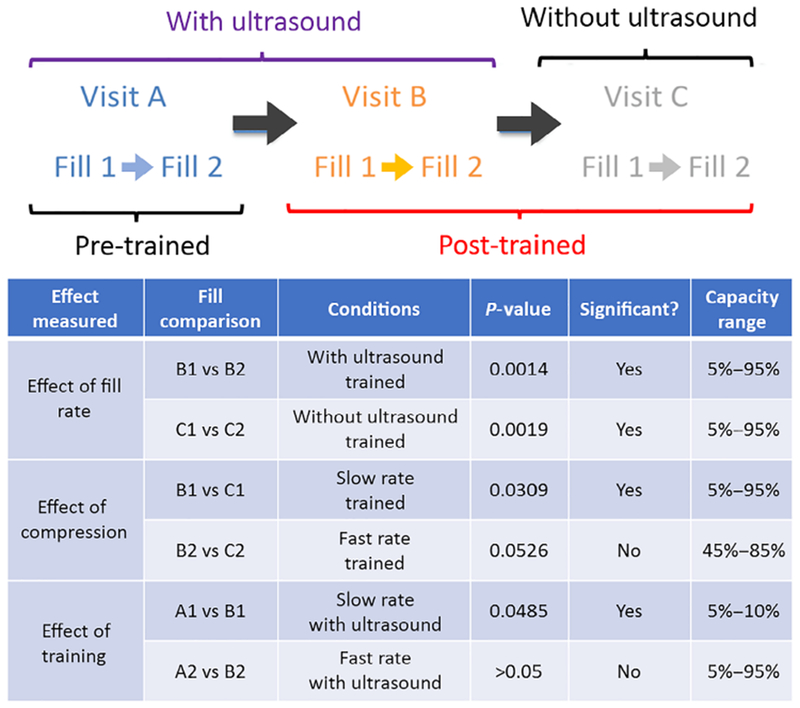
Methods: Healthy volunteers with no urinary symptoms (based on International Consultation on Incontinence Questionnaire on Overactive Bladder surveys) were recruited into an oral hydration study. Throughout two complete fill-void cycles, participants drank 2 L Gatorade G2 (The Gatorade Company, Inc., Chicago, Illinois) and used a touch-screen sensation meter to record real-time bladder sensation (0%-100%). The study was repeated three times, once per week (Visits A, B, and C). In Visits A and B, ultrasound was used to measure bladder volume every 5 minutes. Ultrasound was not used in Visit C except at 100% capacity. Volume data from Visit B were used to estimate volumes throughout the fills in Visit C. Sensation-capacity curves were generated for each fill for comparative analysis.
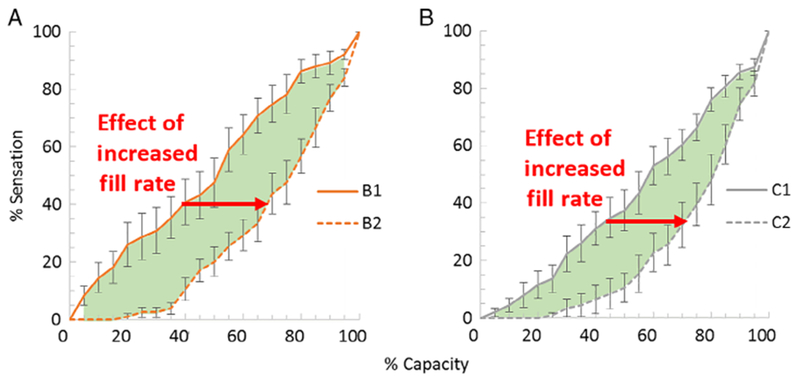
Results: Ten participants completed three visits (60 total fills). Increased fill rate led to decreased sensation throughout filling, andultrasound probe pressure led to increased sensation. Participants reported higher sensation at low volumes during Fill 1 of Visit A before training with the sensation meter. Sensation curves with intermittent ultrasound showed repeatability for Fill 2 in Visits A and B. Fill rate and ultrasound probe pressure affect real-time bladder sensation during oral hydration.
Conclusions: This study demonstrated repeatability of real-time bladder sensation during a two-fill oral hydration protocol with ultrasound.
Keywords: bladder; micturition; overactive bladder; ultrasound; urodynamics.
© 2019 John Wiley & Sons Australia, Ltd.
Figures


Similar articles
-
Influence of visual and auditory cues about bladder volume on real-time filling sensation in healthy volunteers.Am J Clin Exp Urol. 2022 Feb 15;10(1):44-51. eCollection 2022. Am J Clin Exp Urol. 2022. PMID: 35291416 Free PMC article.
-
Non-invasive characterization of real-time bladder sensation using accelerated hydration and a novel sensation meter: An initial experience.Neurourol Urodyn. 2017 Jun;36(5):1417-1426. doi: 10.1002/nau.23137. Epub 2016 Sep 21. Neurourol Urodyn. 2017. PMID: 27654469 Free PMC article.
-
An innovative, non-invasive sensation meter allows for a more comprehensive understanding of bladder sensation events: A prospective study in participants with normal bladder function.Neurourol Urodyn. 2019 Jan;38(1):208-214. doi: 10.1002/nau.23831. Epub 2018 Oct 12. Neurourol Urodyn. 2019. PMID: 30311679 Free PMC article.
-
Imaging bladder sensations.Neurourol Urodyn. 2007 Oct;26(6 Suppl):899-903. doi: 10.1002/nau.20488. Neurourol Urodyn. 2007. PMID: 17654564 Review.
-
Traces: making sense of urodynamics testing--Part 8: Evaluating sensations of bladder filling.Urol Nurs. 2011 Nov-Dec;31(6):369-74. Urol Nurs. 2011. PMID: 22268249 Review.
Cited by
-
Acute Cortical Brain Neuroexcitation Can Be Detected With Sacral Neuromodulation.Urogynecology (Phila). 2025 Apr 1;31(4):344-351. doi: 10.1097/SPV.0000000000001657. Urogynecology (Phila). 2025. PMID: 40105787
-
Bladder wall micromotion measured by non-invasive ultrasound: initial results in women with and without overactive bladder.Am J Clin Exp Urol. 2021 Feb 15;9(1):44-52. eCollection 2021. Am J Clin Exp Urol. 2021. PMID: 33816693 Free PMC article.
-
A stepwise approach for functional near infrared spectroscopy measurement during natural bladder filling.Transl Androl Urol. 2023 Oct 31;12(10):1477-1486. doi: 10.21037/tau-23-275. Epub 2023 Oct 24. Transl Androl Urol. 2023. PMID: 37969775 Free PMC article.
-
Influence of visual and auditory cues about bladder volume on real-time filling sensation in healthy volunteers.Am J Clin Exp Urol. 2022 Feb 15;10(1):44-51. eCollection 2022. Am J Clin Exp Urol. 2022. PMID: 35291416 Free PMC article.
-
Irregular bladder shapes identified in women with overactive bladder: an ultrasound nomogram.Am J Clin Exp Urol. 2021 Oct 15;9(5):367-377. eCollection 2021. Am J Clin Exp Urol. 2021. PMID: 34796252 Free PMC article.
References
-
- Coyne KS, Sexton CC, Vats V, Thompson C, Kopp ZS, Milsom I. National community prevalence of overactive bladder in the United States stratified by sex and age. Urology. 2011;77:1081–1087. - PubMed
-
- Winters JC, Dmochowski RR, Goldman HB, et al. AUA/SUFU guidelines: urodynamics. http://www.auanet.org/education/guidelines/adult-urodynamics.cfm. Published 2012. Accessed 22 February 2019.
-
- Gupta A, Defreitas G, Lemack GE. The reproducibility of urodynamic findings in healthy female volunteers: results of repeated studies in the same setting and after short-term follow-up. Neurourol Urodyn. 2004;23:311–316. - PubMed
MeSH terms
Grants and funding
LinkOut - more resources
Full Text Sources
