. 2019 Sep;29(9):1209-1219.
doi: 10.1089/thy.2019.0237. Epub 2019 Aug 9.

Effects of Short-Term Fasting and Different Overfeeding Diets on Thyroid Hormones in Healthy Humans

Affiliations

Effects of Short-Term Fasting and Different Overfeeding Diets on Thyroid Hormones in Healthy Humans

Alessio Basolo et al. Thyroid. 2019 Sep.

Abstract

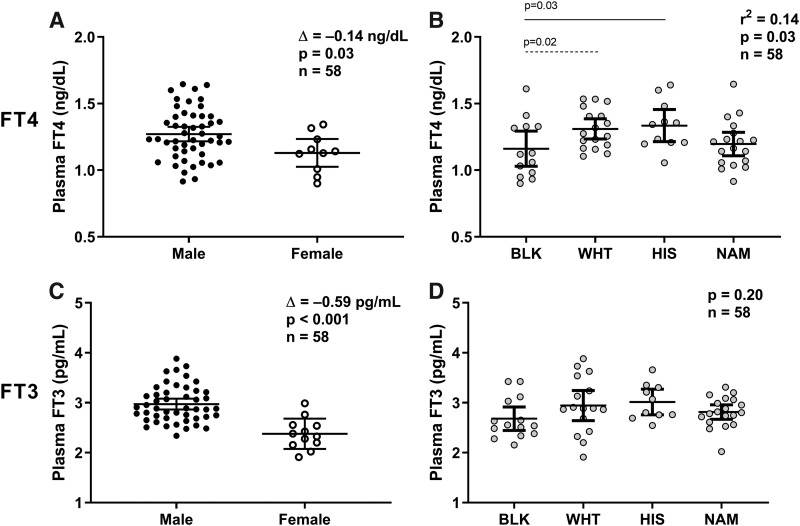
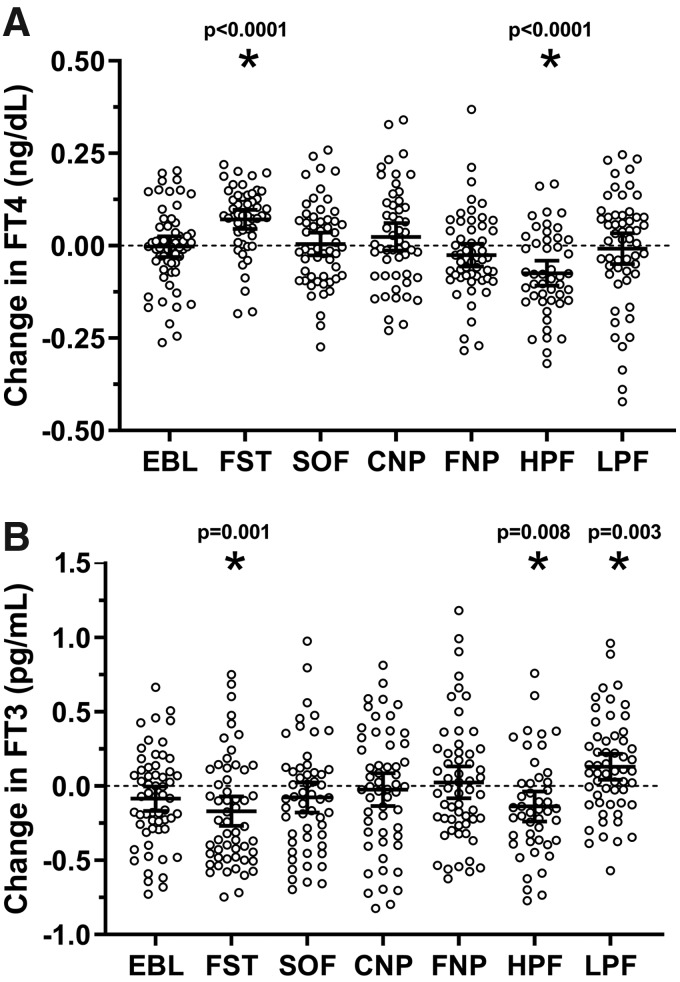
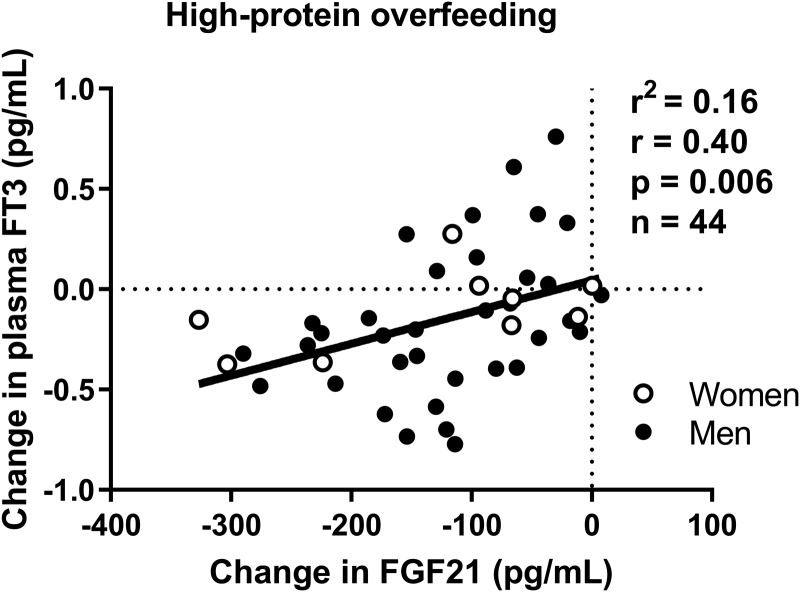
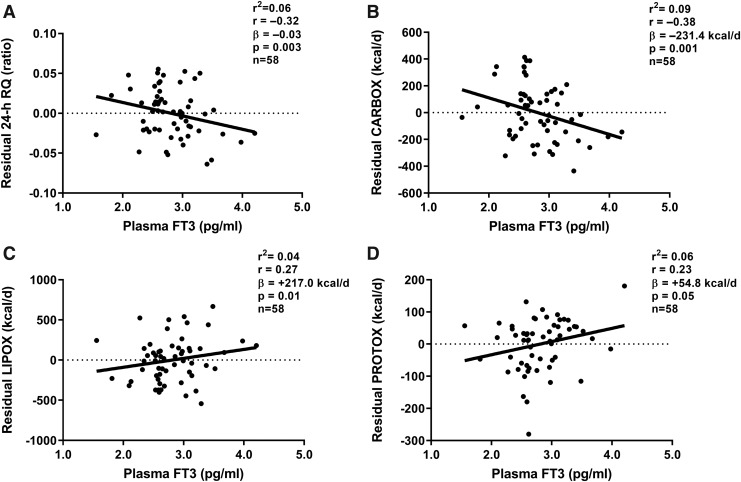
Background: A greater decrease in 24-hour energy expenditure (EE) during fasting and a smaller increase in 24-hour EE during low-protein overfeeding (metabolic "thrifty" phenotype) predict weight gain. As thyroid hormones (TH) are implicated in energy intake and metabolism, we assessed whether: (i) TH concentrations are altered by 24-hour fasting or overfeeding diets with varying protein content and (ii) diet-related changes in TH correlate with concomitant changes in EE. Methods: Fifty-eight euthyroid healthy subjects with normal glucose regulation underwent 24-hour dietary interventions including fasting, eucaloric feeding, and five overfeeding diets in a crossover design within a whole-room indirect calorimeter to measure the 24-hour EE. Overfeeding diets (200% of energy requirements) included three diets with 20% protein, one diet with 3% protein (low-protein overfeeding diet [LPF]: 46% fat), and one diet with 30% protein (high-protein overfeeding diet [HPF]: 44% fat, n = 51). Plasma free thyroxine (fT4), free triiodothyronine (fT3), and fibroblast growth factor 21 (FGF21) concentrations were measured after overnight fast the morning of and after each diet. Results: On average, fT4 increased by 8% (+0.10 ng/dL, 95% confidence interval [CI 0.07-0.13], p < 0.0001) and fT3 decreased by 6% (-0.17 pg/mL [CI -0.27 to -0.07], p = 0.001) after 24-hour fasting, whereas both fT4 and fT3 decreased by 5% (-0.07 ng/dL [CI -0.11 to -0.04], p < 0.0001) and 4% (-0.14 pg/mL [CI -0.24 to -0.04], p = 0.008) following HPF, respectively. Greater decreases in fT3 after HPF are associated with larger decreases in FGF21 (r = 0.40, p = 0.005). Following LPF, the mean fT3 increased by 6% (+0.14 pg/mL [CI 0.05-0.2], p = 0.003) with no change in fT4 (p = 0.7). No changes in TH were observed after normal-protein overfeeding diets (all p > 0.1). No associations were observed between TH concentrations and diet-related changes in 24-hour EE during any diet (all p > 0.07). Conclusions: Acute (200%) short-term (24 hours) changes in food intake induce small changes in TH concentrations only after diets with low (0% fasting and 3% protein overfeeding) or high (30% protein overfeeding) protein content. The fT3-FGF21 association after high-protein overfeeding suggests a role for TH in inhibiting FGF21 secretion by the liver during protein excess. These results indicate that TH are involved in protein metabolism; however, they do not mediate the short-term EE response to diets that characterize the metabolic phenotypes and determine the individual susceptibility to weight gain.

Keywords: FGF21; energy expenditure; fasting; high-protein overfeeding; low-protein overfeeding; substrate oxidation; thyroid hormones.


Conflict of interest statement

No competing financial interests exist.

Figures

<b>FIG. 1.</b>
FIG. 1.
Sex and race/ethnic differences on plasma fT4 and fT3 concentrations. (A, B) The average of plasma fT4 concentrations measured after an overnight fast and before each dietary intervention is reported for each subject on the y-axis as raw values. Plasma fT4 concentration differences by sex (A) were evaluated by unpaired Student's t-test, whereas differences among race/ethnicity (B) were assessed using ANOVA with Tukey–Kramer post hoc adjustment of the least square means for multiple comparisons (the continuous line represents adjusted p = 0.02 and the intermittent line represents adjusted p = 0.03). The Δ in (A) represents the average difference in fT4 concentrations between males and females tested via Student's t-test. (C, D) The average of plasma fT3 concentrations measured after an overnight fast and before each dietary intervention is reported for each subject on the y-axis as raw values. Plasma fT3 concentration differences by sex (C) were evaluated by unpaired Student's t-test, whereas differences among race/ethnicity (D) were assessed using ANOVA. The Δ in (C) represents the average difference in fT3 concentration between males and females tested via Student's t-test. Error bars represent mean ± 95% CI. ANOVA, analysis of variance; BLK, black; CI, confidence interval; fT3, free triiodothyronine; fT4, free thyroxin; HIS, Hispanic; NAM, Native American; WHT, Caucasian.
<b>FIG. 2.</b>
FIG. 2.
Changes in plasma fT4 and fT3 concentrations after each 24-hour dietary intervention. (A, B) The individual change in hormone concentrations on the y-axis was calculated as the difference between the post-diet minus the pre-diet absolute values. Error bars represent mean ± 95% CI. Asterisks represent the changes in plasma fT4 and fT3 concentrations with a p < 0.05 by Student's t-test. The diets with significant changes for fT4 or fT3 were also significant when considering the Bonferroni-corrected threshold for significance equal to 0.0083 obtained by dividing the nominal threshold for significance (0.05) by the number of dietary interventions (6 = fasting +5 overfeeding diets). Diets composition: EBL (eucaloric diet, 50% carbohydrate, 30% fat, 20% protein), FST, SOF (50% carbohydrate, 30% fat, 20% protein), CNP (75% carbohydrate, 5% fat, 20% protein), FNP (20% carbohydrate, 60% fat, 20% protein), HPF (26% carbohydrate, 44% fat, 30% protein), and LPF (51% carbohydrate, 46% fat, 3% protein). CNP, high-carbohydrate overfeeding; EBL, energy balance; FNP, high-fat overfeeding; FST, 24-hour fasting; HPF, high-protein overfeeding diet; LPF, low-protein overfeeding diet; SOF, standard overfeeding.
<b>FIG. 3.</b>
FIG. 3.
Relationships between the change in fasting plasma fT3 concentration and the change in FGF21 concentration after 24-hour high-protein, FNP diet. The individual change in hormone concentrations on each axis was calculated as the difference between the post-diet minus the pre-diet absolute values. The strength of association was quantified by the Pearson correlation index (r) and the coefficient of determination (R2). Diet composition of high-protein, FNP diet (200% daily energy requirements): 26% carbohydrate, 44% fat, 30% protein. The sample size includes 44 subjects (35 men and 9 women) with available measurements of FGF21 and fT3before and after 24-hour HPF. FGF21, fibroblast growth factor 21.
<b>FIG. 4.</b>
FIG. 4.
Relationships between fasting plasma fT3 concentration and 24-hour RQ and macronutrient oxidation rates during energy balance. Linear regression analysis was used to calculate residuals of 24-hour RQ, CARBOX, LIPOX, and PROTOX after adjustment for known covariates (age, sex, race/ethnicity, fat free mass, fat mass, and chamber temperature). Residuals of 24-hour RQ and macronutrient oxidation rates are shown on the y-axis of each panel. (A, B) Inverse relationships between fasting plasma fT3 and residual 24-hour RQ (A) and residual CARBOX (B) during energy balance and eucaloric feeding inside the metabolic chamber. (C, D) Direct relationships between fasting plasma fT3 and residual LIPOX (C) and residual PROTOX (D) during energy balance and eucaloric feeding inside the metabolic chamber. The strength of association was quantified by the Pearson correlation index (r) and the coefficient of determination (R2). The β coefficient was calculated via linear regression analysis and represents the average effect of 1 pg/mL difference in plasma fT3 concentration on residual 24-hour RQ (A), CARBOX (B), LIPOX (C), and PROTOX (D). CARBOX, carbohydrate oxidation; LIPOX, lipid oxidation; PROTOX, protein oxidation; RQ, respiratory quotient.

References

    1. Ng M, Fleming T, Robinson M, Thomson B, Graetz N, Margono C, Mullany EC, Biryukov S, Abbafati C, Abera SF. 2014. Global, regional, and national prevalence of overweight and obesity in children and adults during 1980–2013: a systematic analysis for the Global Burden of Disease Study 2013. Lancet 384:766–781 - PMC - PubMed
    1. Stock MJ. 1999. Gluttony and thermogenesis revisited. Int J Obes 23:1105 - PubMed
    1. Piaggi P. 2019. Metabolic determinants of weight gain in humans. Obesity 27:691–699 - PMC - PubMed
    1. Piaggi P, Vinales KL, Basolo A, Santini F, Krakoff J. 2018. Energy expenditure in the etiology of human obesity: spendthrift and thrifty metabolic phenotypes and energy-sensing mechanisms. J Endocrinol Invest 41:83–89 - PMC - PubMed
    1. Dulloo A, Jacquet J. 1999. Low-protein overfeeding: a tool to unmask susceptibility to obesity in humans. Int J Obes 23:1118 - PubMed

Publication types