

Mammographic Density Change and Risk of Breast Cancer
- PMID: 31298705
- PMCID: PMC7156933
- DOI: 10.1093/jnci/djz149
Mammographic Density Change and Risk of Breast Cancer
Abstract
Background: We examined the association between annual mammographic density change (MDC) and breast cancer (BC) risk, and how annual MDC influences the association between baseline mammographic density (MD) and BC risk.
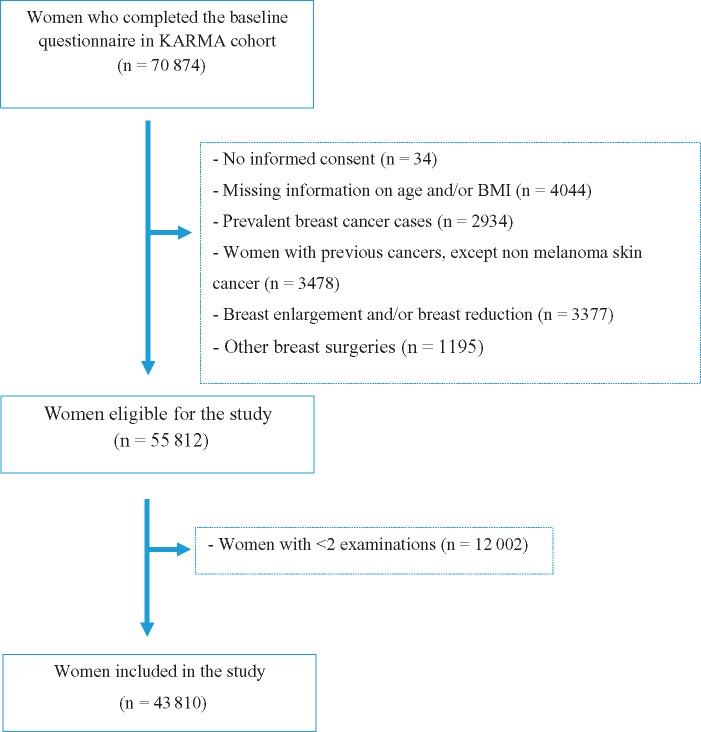
Methods: We used the Karolinska Mammography Project for Risk Prediction of Breast Cancer cohort of Swedish women (N = 43 810) aged 30-79 years with full access to BC risk factors and mammograms. MD was measured as dense area (cm2) and percent MD using the STRATUS method. We used the contralateral mammogram for women with BC and randomly selected a mammogram from either left or right breast for healthy women. We calculated relative area MDC between repeated examinations. Relative area MDC was categorized as decreased (>10% decrease per year), stable (no change), or increased (>10% increase per year). We used Cox proportional hazards regression to estimate the association of BC with MDC and interaction analysis to investigate how MDC modified the association between baseline MD and BC risk. All tests of statistical significance were two-sided.
Results: In all, 563 women were diagnosed with BC. Compared with women with a decreased MD over time, no statistically significant difference in BC risk was seen for women with either stable MD or increasing MD (hazard ratio = 1.01, 95% confidence interval = 0.82 to 1.23, P = .90; and hazard ratio = 0.98, 95% confidence interval = 0.80 to 1.22, P = .90, respectively). Categorizing baseline MD and subsequently adding MDC did not seem to influence the association between baseline MD and BC risk.
Conclusions: Our results suggest that annual MDC does not influence BC risk. Furthermore, MDC does not seem to influence the association between baseline MD and BC risk.
© The Author(s) 2019. Published by Oxford University Press. All rights reserved. For permissions, please email: journals.permissions@oup.com.
Figures
References
-
- McCormack VA, dos Santos Silva I.. Breast density and parenchymal patterns as markers of breast cancer risk: a meta-analysis. Cancer Epidemiol Biomarkers Prev. 2006;15(6):1159–1169. - PubMed
-
- Boyd NF, Guo H, Martin LJ, et al. Mammographic density and the risk and detection of breast cancer. N Engl J Med. 2007;356(3):227–236. - PubMed
-
- Wolfe JN. Breast patterns as an index of risk for developing breast cancer. AJR Am J Roentgenol. 1976;126(6):1130–1137. - PubMed
Publication types
MeSH terms
LinkOut - more resources
Full Text Sources
Medical
