. 2019 Sep;86(3):368-383.
doi: 10.1002/ana.25550. Epub 2019 Jul 31.

SSBP1 mutations in dominant optic atrophy with variable retinal degeneration

Affiliations

SSBP1 mutations in dominant optic atrophy with variable retinal degeneration

Neringa Jurkute et al. Ann Neurol. 2019 Sep.

Abstract

Objective: Autosomal dominant optic atrophy (ADOA) starts in early childhood with loss of visual acuity and color vision deficits. OPA1 mutations are responsible for the majority of cases, but in a portion of patients with a clinical diagnosis of ADOA, the cause remains unknown. This study aimed to identify novel ADOA-associated genes and explore their causality.

Methods: Linkage analysis and sequencing were performed in multigeneration families and unrelated patients to identify disease-causing variants. Functional consequences were investigated in silico and confirmed experimentally using the zebrafish model.

Results: We defined a new ADOA locus on 7q33-q35 and identified 3 different missense variants in SSBP1 (NM_001256510.1; c.113G>A [p.(Arg38Gln)], c.320G>A [p.(Arg107Gln)] and c.422G>A [p.(Ser141Asn)]) in affected individuals from 2 families and 2 singletons with ADOA and variable retinal degeneration. The mutated arginine residues are part of a basic patch that is essential for single-strand DNA binding. The loss of a positive charge at these positions is very likely to lower the affinity of SSBP1 for single-strand DNA. Antisense-mediated knockdown of endogenous ssbp1 messenger RNA (mRNA) in zebrafish resulted in compromised differentiation of retinal ganglion cells. A similar effect was achieved when mutated mRNAs were administered. These findings point toward an essential role of ssbp1 in retinal development and the dominant-negative nature of the identified human variants, which is consistent with the segregation pattern observed in 2 multigeneration families studied.

Interpretation: SSBP1 is an essential protein for mitochondrial DNA replication and maintenance. Our data have established pathogenic variants in SSBP1 as a cause of ADOA and variable retinal degeneration. ANN NEUROL 2019;86:368-383.


Conflict of interest statement

Conflicts of Interest

No conflicts to report.

Figures

FIGURE 1:
FIGURE 1:
Mapping of a new ADOA locus. (A) Pedigrees of four families with ADOA of previously unknown underlying genetic cause. An asterisk indicates family members from whom DNA was available. (B) Schematic representation of genome-wide LOD score calculations after 10K array SNP genotyping of 13 samples from family 1 (boxed ID numbers). LOD scores calculated with ALLEGRO are given along the y-axis relative to genomic position in cM (centi Morgan) on the x-axis. Note the highest peak (LOD = 3.61) in a region on chromosome 7.
FIGURE 2:
FIGURE 2:
Colour optic nerve head, fundus, fundus autofluorescence (FAF) and OCT composite of affected members (single eye selected). (A) Colour image of the optic nerve head shows different degrees of optic atrophy. (B, F) OCT B-scan of the disc (top) and circumpapillary area (bottom) showing atrophic optic nerve head and RNFL thinning; (C, F) OCT scans through macula showing thin atrophic retina with focal loss of the outer retina. (D) Fundus colour photographs from the affected family members: various degrees attenuated vessels and pigmentary changes in Family 1: 4-12, 4-14, 4-18, 5-5 Family 2: 2-2, 2-3 and singleton case of Family 3 (E) FAF of the patient 4-12 (F1) showing an area of decreased autofluorescence around the vessels arcades more prominent on the superior part. 4-14 (F1) FAF shows patches of hypoautofluorescence including atrophic areas in posterior pole with hyperautofluorescence area next to optic disc. 4-18 (F1) FAF indicates an increased autofluorescence in fovea. FAF of 5-5 (F1) shows hypofluorescent patchy pattern in midperipheral retina and increased autofluorescence in the fovea. 5-12 (F1) normal FAF. 2-3 (F3) diffuse hyperautofluorescence in posterior pole with hypoautofluorescence around the vessels arcades and in fovea.
FIGURE 3:
FIGURE 3:
Pattern ERG (PERG) and pattern reversal and flash VEP (PVEP; FVEP) recordings for the right eyes of 6 affected individuals, including 8 years after baseline testing in case 5-5 of Family 1. All recordings showed a high degree of inter-ocular symmetry. The age of each individual at the time of recording is indicated. All waveforms are superimposed to demonstrate reproducibility. It was not possible to obtain a PERG recording in case 5-2 due the effects of eye movements. Recordings from a representative control subject are shown for comparison (control). PERG is undetectable (4-12 and 4-14), shows a P50 component of short peak time (5-5 and 5-12) and a reduced N95:P50 ratio (5-5, 5-12 and Family 3 2-3). PVEPs are abnormal in all cases and FVEPs undetectable in one (4-14). See text for details. Full-field ERGs from the right eyes in each of 6 cases that underwent International standard ERG testing, with additional On-Off and S-cone ERGs, and representative control recordings from a healthy subject for comparison (control). Dark-adapted (DA) ERGs are shown for white flashes of 0.01, and 10.0 cd.s.m−2. Light-adapted (LA) ERGs are shown for white flashes of 3.0 cd.s.m−2 (30Hz and 2Hz). Traces are superimposed to demonstrate reproducibility (with exception of On-Off ERG in 5-2). Broken lines replace blink artefacts that occur soon after b-waves in DA10 ERGs and in the On-Off ERGs in Family 3 2-3. All 5 cases show evidence of generalised retinal dysfunction with either similar severity of rod and cone involvement (4-14) or rod-cone dystrophy (4-12; 5-2; 5-5, Family 3 2-3). There is evidence of progression in 5-5 between the ages of 18 and 26 years.
FIGURE 4:
FIGURE 4:
Identification of recombination breakpoints in family 1. Reconstruction of haplotypes was performed using genotype information of 14 STR markers from the linkage region on chromosome 7q33-q35. The disease haplotype is shown in red. Recombination events are visible in individuals 4-3 and 4-18 (boxed marker alleles). They define a ~9.5 Mb critical interval for the disease locus. The flanking markers are GATA30F12 and D7S3044 at the proximal and distal end, respectively. Markers within the critical interval are printed in bold type.
FIGURE 5:
FIGURE 5:
Knock-down of ssbp1 as well as expression of mutant ssbp1 versions result in impaired initiation of retinal ganglion cell (RGC) differentiation and retinal integrity in zebrafish. Expression of the RGC markers Isl1 (A-C) and atho7 (D-F, H, I) was visualized by whole-mount RNA in situ hybridization in eyes of zebrafish embryos injected with either antisense Morpholino-oligonucleotides against ssbp1 (B, C, E, F) or with mRNA of distinct ssbp1 alleles (H, I) as indicated at 30 hours post fertilization (hpf). Arrows in A to C point at isl1 positive RGCs. Insets in E and F show retinas of embryos injected with cognate control Morpholinos outfitted with nucleo-base mismatches at five positions (5mmMO), while the inset in H depicts an atoh7 stained retina of an untreated control embryo. (G) Transmitted light microscopy images of untreated (up), ssbp1-splice-mismatch Morpholino (middle) and ssbp1-splice Morpholino (bottom) injected zebrafish embryos at 30 hpf. All images (A – I) are lateral views with rostral to the left. Immunofluorescences against the pan-neuronal marker Elavl3 (HuC) and the nerve fiber marker acetylated Tubulin (AcTub) on cross sections of eyes of a control- (J, n=3) and a ssbp1-splice morpholino-injected larvae at 72 hpf (K, n=4); white arrows point to the optic nerve, white arrowheads to the inner plexiform layer, grey arrows to the ganglion cell layer and grey arrowheads to the inner nuclear layer. (L – L’’’) Statistical analysis of phenotypic categories as revealed by atoh7 staining after (co-)injection of ssbp1 Morpholinos and mRNAs as indicated. Employed categories are shown right to the chart. Statistical significance was calculated via a χ2-test: not injected (n=47)/plus ssbp1 5mm-ATG-MO (n=72): χ2(1)=1.3952, p=0.2375; plus ssbp1 5mm-ATG-MO (n=72)/plus ssbp1 ATG-MO (n=44) χ2(2)=101.81, p<0.001; plus ssbp1 5mm-splice-MO (n=82)/plus ssbp1 splice-MO (n=52) χ2(2)=123.1, p<0.001; plus ssbp1 splice-MO (n=52)/plus ssbp1 splice-MO and ssbp1 mRNA(wt) (n=101) χ2(2)=31.053, p<0.001; plus ssbp1 mRNA(wt) (n=39)/ plus ssbp1 mRNA(R38Q) (n=40) χ2(2)=32.89, p<0.001; plus ssbp1 mRNA(wt) (n=39)/plus ssbp1 mRNA(R107Q) (n=48) χ2(2)=9.9853, p<0.006787; plus ssbp1 mRNA(wt) (n=39)/plus ssbp1 mRNA(S141N) (n=33) χ2(2)=33.886, p<0.001; equimolar (co-)injections of ssbp1-mRNA alleles into morphants: plus ssbp1 mRNA(wt) (n=62)/plus ssbp1 mRNA (R107Q) (n=42): χ2(2)=68.631, p<0.001; plus ssbp1 mRNA(wt) (n=62)/plus ssbp1 mRNA and ssbp1 mRNA (R38Q) (n=48) χ2(2)=81.027, p<0.001; plus ssbp1 mRNA(wt) (n=62)/plus ssbp1 mRNA and ssbp1 mRNA (R107Q) (n=28) χ2(2)=46.469, p<0.001; plus ssbp1 mRNA(wt) (n=62)/plus ssbp1 mRNA and ssbp1 mRNA (S141N) (n=44) χ2(2)=65.648, p<0.001. Abbreviations: GCL, ganglion cell layer; INL, inner nuclear layer; IPL, inner plexiform layer; ns, not significant.
FIGURE 6:
FIGURE 6:
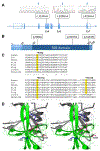
SSBP1 mutations of two ADOA families and two singletons. (A) SSBP1 gene structure with seven exons (boxes). Mutations identified in Family 1 (exon 6), Family 2 (exon 4) and two singletons of Families 3 and 4 (exons 4 and 7, respectively) are indicated above the exons along with Sanger sequencing chromatograms of one patient for each mutation. Open boxes at the beginning and the end of the gene represent untranslated regions (UTRs). (B) SSBP1 protein domain structure (148 amino acids). Domains are indicated by the specified color code. The missense mutations, as inferred from the DNA variants, are indicated above the bar at the corresponding positions. (C) Multiple alignment of human SSBP1 homologous proteins. All mutated sites are strictly conserved in vertebrates. Arg38 is also conserved in insects while Arg107 is even conserved in insects and worms. The alignment was performed with Clustal W. Bird: Gallus gallus; fish: Danio rerio; frog: Xenopus laevis; insect: Drosophila melanogaster; nematode: Caenorhabditis briggsae. (D) Crossed-eye stereo representation of dimeric human SSBP1 X-ray structure (pdb code 1S3O) with the residues of basic patch B (Arg38, Lys104, Arg107 of subunit A, and pseudo-symmetry related Arg28 of subunit B, according to Yang et al., 1997) as well as the mutated Ser141 in stick representation; mutated residues in magenta, the two other basic residues in blue. Schematic representation of subunit A in green and subunit B in gray.
FIGURE 7:
FIGURE 7:
SSBP1 and OPA1 expression in mouse retina. DAB immunohistochemistry of wax sections from 2-month-old mouse eye showing that Ssbp1 is abundant in the retina. OPA1 is primarily expressed in the GCL, IPL, INL, and OPL. Sections were counterstained with haematoxylin (blue). Panel shows a control section (primary antibody omitted). GC= ganglion cell layer, IPL= inner plexiform layer, INL= inner nuclear layer, OPL= outer plexiform layer, ONL= outer nuclear layer, PRL= photoreceptor layer, RPE= retinal pigment epithelium.
FIGURE 8:
FIGURE 8:
Mitochondrial staining in SH-SY5Y cells. (A) Shows a merged fluorescence image of mitochondria labelled with mitotracker red (B) and anti-ssbp1 (C). Arrows indicate the presence of brightly stained green punctuate structures, which may indicate the presence of mitochondrial nucleoids. (D) The merged image of anti-ssbp1 and anti-TFAM shows dots that were co-located and each dot may represent TFAM/mtDNA complex/nucleoid. Immunolabelling using anti-ssbp1 (E) stained in a pattern associating with the mitochondria. Immunolabelling using anti-TFAM (F) showed a granular pattern in the cytoplasm. Scale 25 μm for A-C panels and 20 μm for D – F panels.

Similar articles

Cited by

References

    1. Lenaers G, Hamel C, Delettre C, et al. Dominant optic atrophy. Orphanet J Rare Dis 2012;7:46. - PMC - PubMed
    1. Jurkute N, Majander A, Bowman R, et al. Clinical utility gene card for: inherited optic neuropathies including next-generation sequencing-based approaches [Internet]. Eur. J. Hum. Genet 2018; Available from: http://www.nature.com/articles/s41431-018-0235-y - PMC - PubMed
    1. Falkenberg M, Larsson N-G, Gustafsson CM. DNA Replication and Transcription in Mammalian Mitochondria [Internet]. Annu. Rev. Biochem 2007;76(1):679–699. Available from: 10.1146/annurev.biochem.76.060305.152028 - DOI - PubMed
    1. Bach M, Brigell MG, Hawlina M, et al. ISCEV standard for clinical pattern electroretinography (PERG): 2012 update [Internet]. Doc. Ophthalmol 2013;126(1):1–7.[cited 2018 Apr 19] Available from: 10.1007/s10633-012-9353-y - DOI - PubMed
    1. McCulloch DL, Marmor MF, Brigell MG, et al. ISCEV Standard for full-field clinical electroretinography (2015 update) [Internet]. Doc. Ophthalmol 2015;130(1):1–12.[cited 2018 Feb 25] Available from: 10.1007/s10633-014-9473-7 - DOI - PubMed

Publication types

MeSH terms