Review
. 2019 Oct;20(10):717-740.
doi: 10.1111/tra.12676. Epub 2019 Aug 26.

The structural biology of the dynamin-related proteins: New insights into a diverse, multitalented family

Affiliations
Review

The structural biology of the dynamin-related proteins: New insights into a diverse, multitalented family

Marijn G J Ford et al. Traffic. 2019 Oct.

Abstract

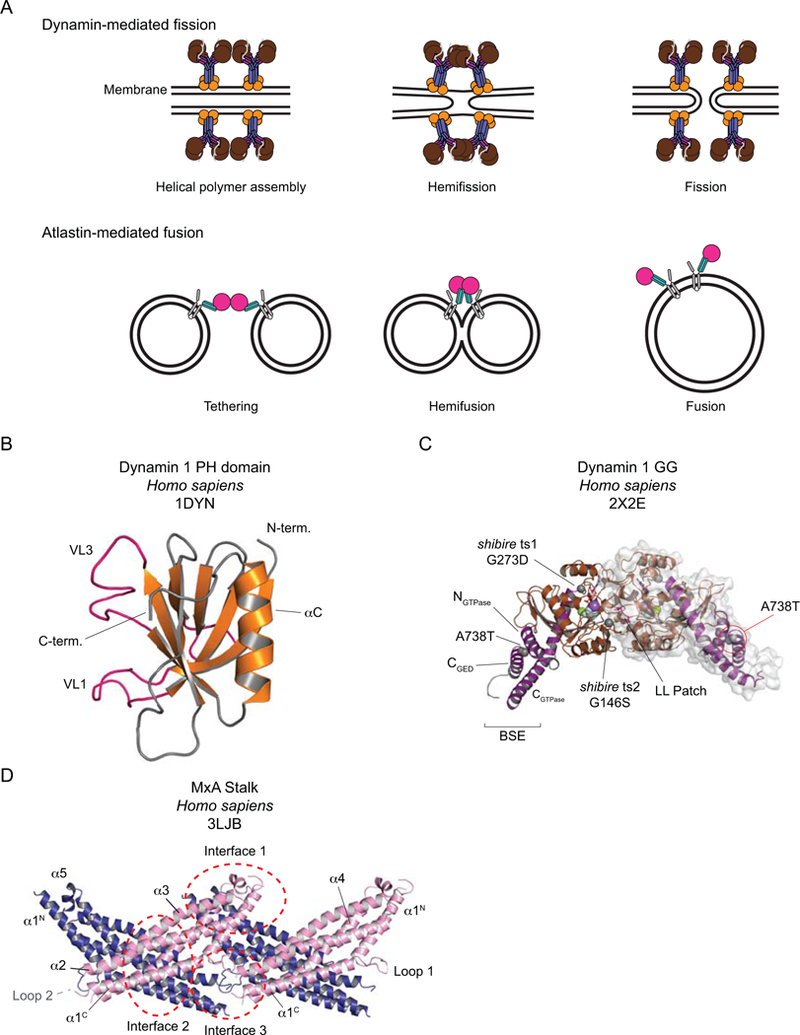
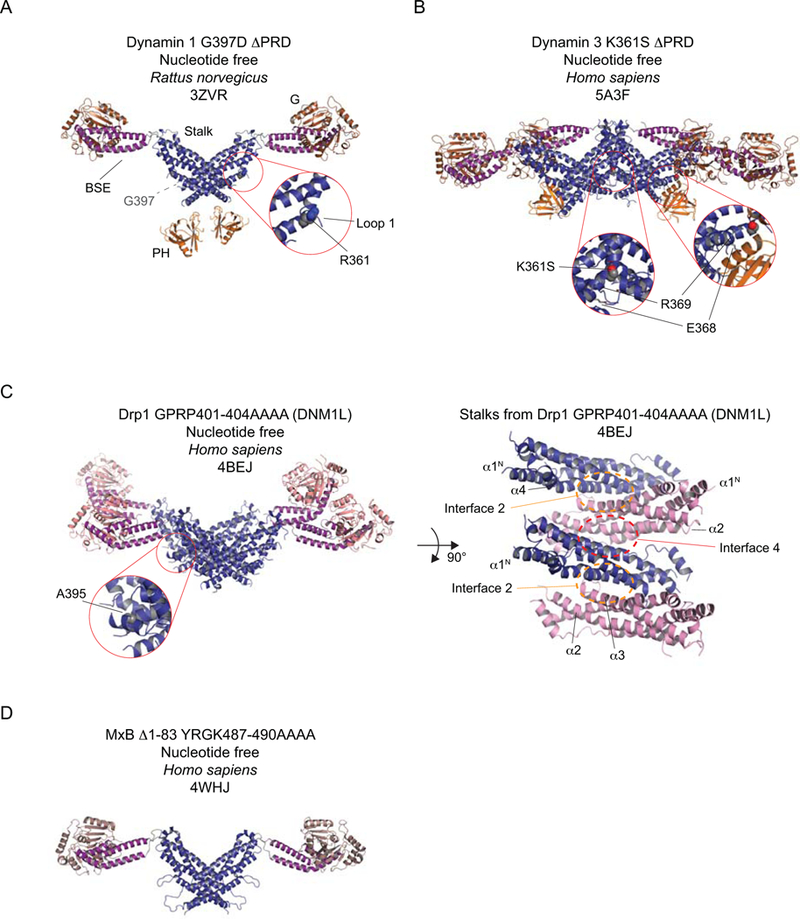
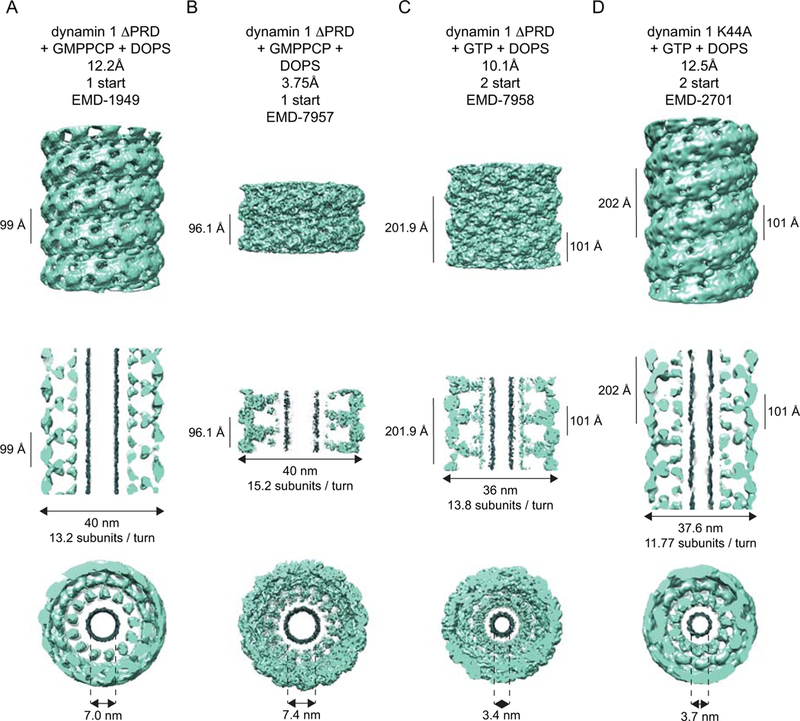
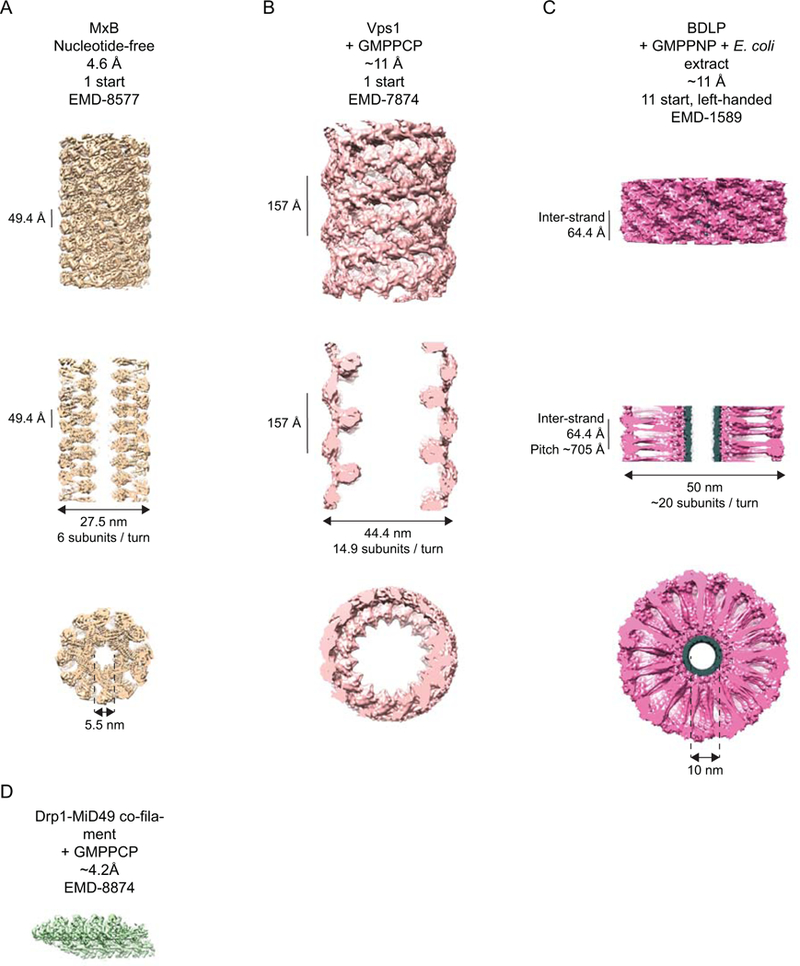
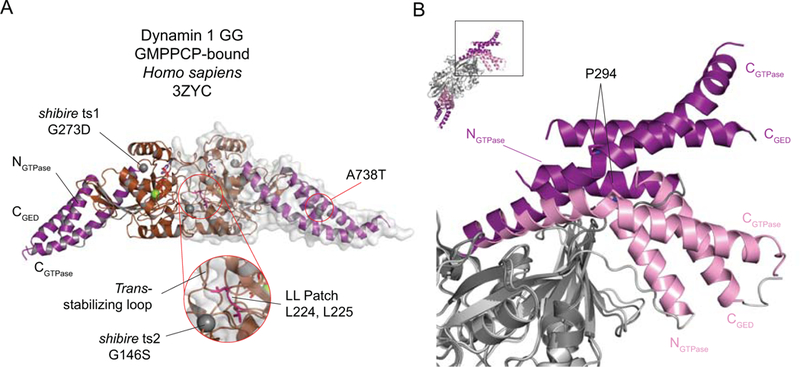
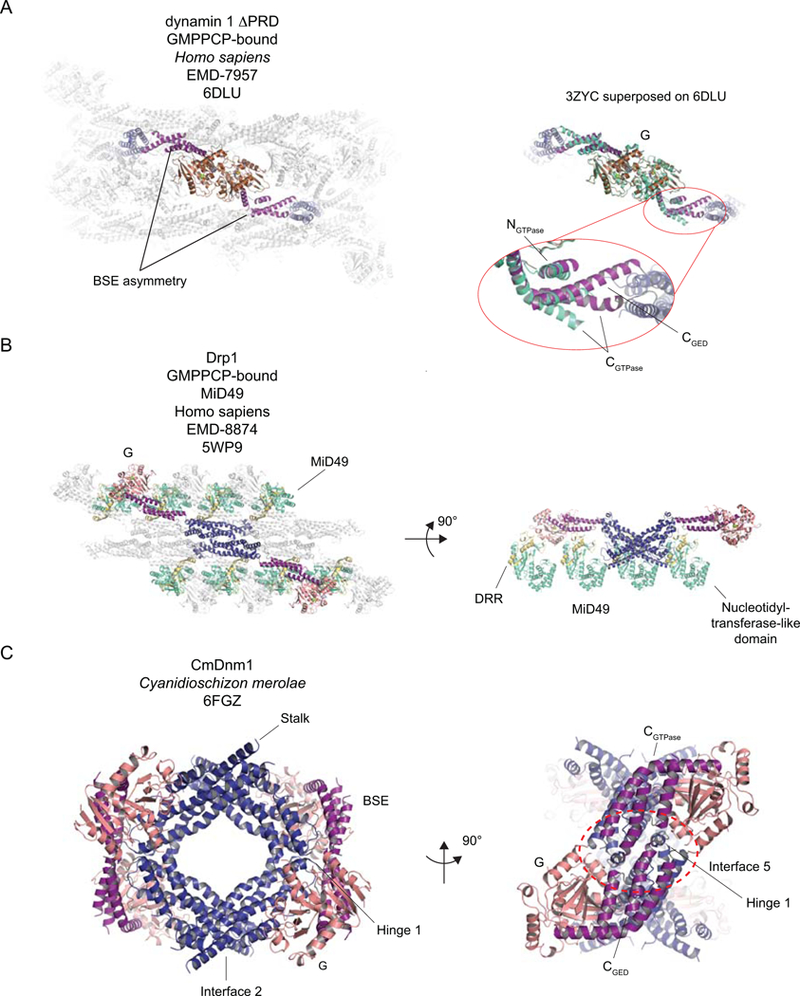
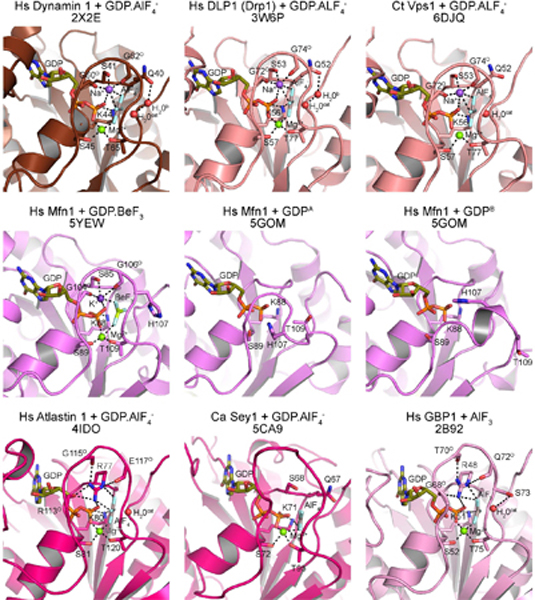
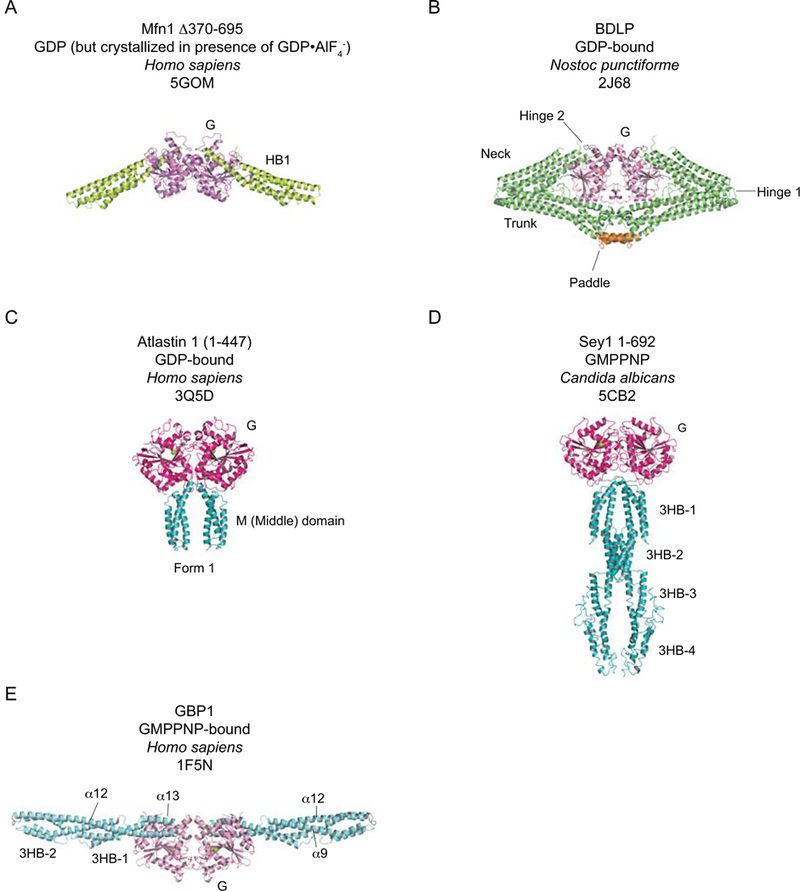
Dynamin-related proteins are multidomain, mechanochemical GTPases that self-assemble and orchestrate a wide array of cellular processes. Over the past decade, structural insights from X-ray crystallography and cryo-electron microscopy have reshaped our mechanistic understanding of these proteins. Here, we provide a historical perspective on these advances that highlights the structural attributes of different dynamin family members and explores how these characteristics affect GTP hydrolysis, conformational coupling and oligomerization. We also discuss a number of lingering challenges remaining in the field that suggest future directions of study.

Keywords: BSE; GTPase; bundle signaling element; dynamin; dynamin-related proteins; helix.


Figures

Figure 1.
Figure 1.
A. Cartoons of the fission and fusion processes catalyzed by dynamin and atlastin respectively. B-D. The DRP building blocks. B. The dynamin 1 PH domain. The Variable Loops (VL) are shown in pink. C. Dynamin 1 GG, bound to the transition state analog GDP. AlF4-. The BSEs are shown in purple and the G domains in brown. GDP is shown in stick representation, AlF4- (light grey and pale blue), Mg2+ (green) and Na+ (purple) in space-fill. Residues that, when mutated as indicated, generate the shibire ts and sushi mutations are shown in space-fill. The LL Patch with its two leucines is shown in pink. One of the dimer partners is shown with its surface representation. D. The MxA Stalk. The asymmetric unit contains two Stalks (one pink, one blue), assembled via Interface 2. Here two adjacent asymmetric units are depicted, highlighting Interfaces 1 and 3.
Figure 2.
Figure 2.
Selected structures of dynamin and its closest homologs, Drp1 and MxB. A-D The Stalks and BSEs in Drp1 (C) and MxB (D) are highly conserved with those in dynamin (A, B) and are therefore depicted in the same color (Stalk – deep blue; BSE – purple). Some functionally significant sequence differences exist in the Drp1 and MxB G domains when compared to that of dynamin. This is reflected in the slightly different hues used for the respective G domains. The PH domains of the dynamins are depicted in gold. A. Rat dynamin 1 G397D ΔPRD. R361, when mutated, is assembly deficient and is shown in space-fill. B. The human dynamin 3 K361S ΔPRD tetramer. K361S is shown in space-fill. E368 and R369 form contacts with the PH and are mutated in some disease-associated alleles of dynamin 2. C. Left. Human Drp1 with a GPRP->AAAA mutation in Stalk Loop 2. A395, which is assembly-defective when mutated to D, is shown in space-fill. Right. The Stalk region from the structure of Drp1. Alternate Stalks are colored in blue and pink to accentuate the Interfaces. The BSEs and G domains are not shown to improve clarity. In A-C, the insets enlarge the indicated regions. D. Human MxB with a deletion of its N-terminal extension (Δ1–83) and a YRGK->AAAA mutation in Stalk Loop 2.
Figure 3.
Figure 3.
Cryo-EM reconstructions of dynamins. A-D depict three views of each of the dynamin reconstructions that are deposited in the EM Databank: a side-on view (top row), a central slice (middle row) and an end-on view (bottom row). The central slice straddles the tube’s maximum diameter. Density ascribed to lipid is colored in grey. A. 12.2 Å reconstruction of human GMPPCP- and DOPS-bound dynamin 1 ΔPRD, contoured at 1.44 σ. B. 3.75 Å reconstruction of human GMPPCP and DOPS-bound dynamin 1 ΔPRD, contoured at 2.51σ with a step size of 4. C. 10.1 Å reconstruction of human GTP- and DOPS-bound dynamin 1 ΔPRD, contoured at 3.01 σ. D. 12.5 Å reconstruction of human GTP- and DOPS-bound dynamin 1, contoured at 1.39 σ. DOPS – di-oleoyl phosphatidylserine.
Figure 4.
Figure 4.
Cryo-EM reconstructions of non-dynamin DRPs that are deposited in the EM Databank. A-C depict three views of the helical reconstructions of MxB (A), Vps1 (B) and BDLP (C): a side-on view (top), a central slice (middle) and an end-on view (bottom). A. The 4.6 Å reconstruction of human MxB, contoured at 2.30s. B. The ~11 Å reconstruction of GMPPCP-bound Chaetomium thermophilum Vps1, contoured at 2.43σ. C. The ~11 Å reconstruction of GMPPNP- and lipid-bound Nostoc punctiforme BDLP, contoured at 1.42 σ. Density ascribed to E. coli lipid is shown in grey. D. The ~4.2 Å reconstruction of the GMPPNP-bound Drp1-MiD49 co-filament, contoured at 2.52 σ with a step size of 4.
Figure 5.
Figure 5.
A. Dynamin 1 GG bound to GMPPCP. The BSEs are shown in purple and the G domains in brown. Green spheres depict Mg2+ ions and GMPPCP is shown in stick representation. The sites of the shibire ts and sushi mutations are shown in space-fill. The LL Patch is shown in pink with the two leucines in stick representation. The inset enlarges the indicated region. One of the dimer partners is shown with its surface representation. B. The BSE conformational change. The different conformations of the BSEs in the GMPPCP-bound (purple) and GDP.AlF4--bound (pink) GG structures. The remainder of the structures are shown in dark grey (GMPPCP) and light grey (GDP.AlF4-). Proline 294, a key pivot point for the CGTPase conformational shift, is shown in stick representation. The inset shows the orientation of the superposed GG structures and the boxed area shows the region depicted in the main panel.
Figure 6.
Figure 6.
A. The BSE asymmetry across the G-G interface in assembled, GMPPCP- and lipid-bound dynamin 1 ΔPRD. Left. The atomic model of the helical reconstruction (EMD-7957 and PDB 6DLU). Two dynamin protomers are shown colored according to the color scheme used in Figure 1: G domain – brown; BSE – purple; Stalk – deep blue; PH – gold. Remaining dynamin protomers are shown in pale grey. The BSE asymmetry is highlighted. Right. To accentuate the BSE asymmetry in the reconstruction of the GMPPCP- and lipid-bound dynamin 1 ΔPRD, the model of the GMPPCP-bound dynamin 1 GG (consisting of G domain and BSE) crystal structure (green-cyan, PDB 3ZYC) is superposed onto the colored G-G dimer shown on the left. The site where the kink in the CGTPase helix is introduced is shown in the detail. B. The model of the human GMPPCP-bound Drp1-MiD49 co-filament. The highlighted Drp1 dimer is colored according to the scheme used in Figure 1: G domain – salmon (to distinguish the structural differences with the dynamin G domain); BSE – purple; Stalk – deep blue. The MiD49 molecules are shown with the nucleotidyltransferase domains colored in green-cyan and the Drp1 Recruitment Region (DRR) in yellow-orange. Right. The full filament viewed from above. The highlighted Drp1 dimer is assembled via Stalk Interface 2. Other Drp1 protomers within the filament are colored in light grey and are rendered partially transparent to permit visualization of the MiD49 molecules. Right. A 90° rotated view of the model. All the transparent Drp1 dimers have been removed for clarity, as have the MiD49 molecules interacting with the “front” of the filament, from this view. This permits the four interaction interfaces MiD49 has with assembled Drp1 to be appreciated. C. Cyanidioschizon merolae Dnm1 (CmDnm1), in closed conformation. The coloration is the same as for Drp1 in B. Left. An overview of the inhibited tetramer with the location of Hinge 1 highlighted. Right. A 90° rotated view to emphasize the inhibitory Interface 5. Where relevant, green spheres depict Mg2+ ions and nucleotides or analogs are shown in stick representation.
Figure 7.
Figure 7.
Active site organization of dynamin family members and related proteins. Structural models of nucleotide bound G domains are shown and labeled with associated PDB codes. Coloring denotes family classification (see text): ‘true dynamin’, chocolate; ‘close relatives’, salmon; ‘Mfns and BDLP’, violet; ‘Atlastin and Sey1’, hot pink. Catalytic residues and main chain carbonyls (superscript ‘O’) in each model are depicted as sticks. Guanine nucleotides are shown as sticks and colored deep olive with magnesium ions shown as green spheres. Where applicable, charge compensating ions are shown as purple spheres and catalytic (H2Ocat) and bridging (H2Ob) waters are shown as red spheres. Both monomers of Hs Mfn1-GDP complex are included to illustrate the alternative conformations of Switch 1. Dashed lines indicate hydrogen bonding interactions.
Figure 8.
Figure 8.
The crystal structures of selected other DRPs. A-B. Mfn1 and BDLP share structural homology and are therefore colored similarly (G domains – pinks; HB1, neck and trunk, as appropriate – greens). A. Human Mfn1 Δ370–695, bound to GDP.AlF4- (only density for GDP is observed). B. GDP-bound Nostoc punctiforme BDLP. The membrane-interacting “paddle” is shown in orange. C-D. Examples of structures from the atlastin/Sey1 subfamily. As these share structural and biochemical features, their G and helical domains are colored similarly (G domains – hot pink; helical domains – teal). C. Human atlastin 1 residues 1–447 bound to GDP. D. Candida albicans Sey1 residues 1–692 bound to GMPPNP. E. Human GBP1 bound to GMPPNP. Significant differences in G domain structural features are noted compared to the dynamin G domain, hence the coloration is distinct. GBPs do not have BSEs but rather have a complex Stalk consisting of two three-helix bundles, sharing a common helix α9, which are connected by a common helix α12 (all colored in aquamarine). Where relevant, green spheres depict Mg2+ ions and nucleotides or analogs are shown in stick representation.

Similar articles

Cited by

References

    1. Praefcke GJ, McMahon HT. The dynamin superfamily: universal membrane tubulation and fission molecules? Nat Rev Mol Cell Biol. 2004;5(2):133–147. - PubMed
    1. Hoppins S, Lackner L, Nunnari J. The machines that divide and fuse mitochondria. Annu Rev Biochem. 2007;76:751–780. - PubMed
    1. Antonny B, Burd C, De Camilli P, et al. Membrane fission by dynamin: what we know and what we need to know. EMBO J. 2016;35(21):2270–2284. - PMC - PubMed
    1. Jimah JR, Hinshaw JE. Structural Insights into the Mechanism of Dynamin Superfamily Proteins. Trends Cell Biol. 2019;29(3):257–273. - PMC - PubMed
    1. Ferguson KM, Lemmon MA, Schlessinger J, Sigler PB. Crystal structure at 2.2 A resolution of the pleckstrin homology domain from human dynamin. Cell. 1994;79(2):199–209. - PubMed

Publication types

LinkOut - more resources