. 2019 Jul 12;17(7):e3000369.
doi: 10.1371/journal.pbio.3000369. eCollection 2019 Jul.

Spectrin-based membrane skeleton supports ciliogenesis

Affiliations

Spectrin-based membrane skeleton supports ciliogenesis

Ru Jia et al. PLoS Biol. .

Abstract

Cilia are remarkable cellular devices that power cell motility and transduce extracellular signals. To assemble a cilium, a cylindrical array of 9 doublet microtubules push out an extension of the plasma membrane. Membrane tension regulates cilium formation; however, molecular pathways that link mechanical stimuli to ciliogenesis are unclear. Using genome editing, we introduced hereditary elliptocytosis (HE)- and spinocerebellar ataxia (SCA)-associated mutations into the Caenorhabditis elegans membrane skeletal protein spectrin. We show that these mutations impair mechanical support for the plasma membrane and change cell shape. RNA sequencing (RNA-seq) analyses of spectrin-mutant animals uncovered a global down-regulation of ciliary gene expression, prompting us to investigate whether spectrin participates in ciliogenesis. Spectrin mutations affect intraflagellar transport (IFT), disrupt axonemal microtubules, and inhibit cilium formation, and the endogenous spectrin periodically distributes along cilia. Mammalian spectrin also localizes in cilia and regulates ciliogenesis. These results define a previously unrecognized yet conserved role of spectrin-based mechanical support for cilium biogenesis.


Conflict of interest statement

The authors have declared that no competing interests exist.

Figures
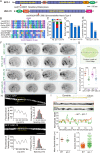
Fig 1
Fig 1. Disease-associated mutations in spectrin impair embryonic elongation and dendrite morphology.
(A) Schematic protein domain structure of the C. elegans alpha-spectrin SPC-1 and beta-spectrin UNC-70. The CRISPR-Cas9–based homologous recombination strategy was used to introduce GFP into the C of SPC-1 or N of UNC-70. Human-diseases–associated mutations (arrows) were introduced into the WT N2 or the GFP KI SPC-1 or UNC-70 animals. Scale bar, 100 amino acids. (B) Alignment of sequences flanking the diseases-associated residue L268P in SPC-1 and an in-frame deletion removing H590-L598 in UNC-70. Both mutations are dominant in human diseases. The heterozygous C. elegans mutant animals harboring either spectrin mutation caused uncoordinated movement, and this study used homozygous animals for all the phenotype analyses. (C–E) Quantification of embryo survival rates (C), the animal body length (D), and locomotion defect (E) in WT (N2), spc-1 (cas971), and unc-70 (cas983) mutant animals from 3 generations. N = 50–100. Error bars are SEM. Comparisons were performed between the WT and mutants, ***p < 0.001. (F–G) Fluorescence inverted images from time-lapse spinning disk confocal movies of SPC-1::GFP, SPC-1 (L260P)::GFP, GFP::UNC-70, and GFP::UNC-70 (SCA5-del) embryos. 0 min, the comma stage; 60 min, the 2-fold stage of WT embryos. The red arrow indicates the deformed dorsal region of the spc-1 mutant embryo. Embryo lengths are the distance from the embryo head to the tail. (G) Scale bar, 5 μm; comparisons were between the WT and mutants, ***p < 0.001. (H) Representative images of SPC-1::GFP (upper) or GFP::UNC-70 (lower) in neuronal processes of motor neurons in live C. elegans at the young-adult stage. The low magnification views are in S2C and S2D Fig. The corresponding fluorescence intensity of the boxed region, left; and the histogram of the spacings between periodic structure, right; N = 100–150. The red line is a Gaussian fit. Scale bar, 1 μm. (I, upper) A model of the dendrite and cilium in a ciliated sensory neuron of the young-adult C. elegans (top). A representative image of the boxed region was visualized using a red fluorescent protein Scarlet tagged with a myristoylation signal in WT (middle) and spc-1 (cas971) mutant (bottom) animals. (Middle) Plots of the normalized width along the representative dendrites within 5 to 30 μm from the ciliary base. (Lower) Quantification of the dendrite width and the width SD at each pixel within 5 to 30 μm from the ciliary base in WT or spc-1 mutant animals. Scale bar, 5 μm. Comparisons were between the WT and mutants, **p < 0.01, ***p < 0.001. Data associated with this figure can be found in S1 Data. a.u, arbitrary unit; C, C terminus; CH3, calponin homology domains type 3; CRISPR-Cas9, clustered regularly interspaced short palindromic repeats-Cas9; EF, EF-hand calcium-binding motifs; Emb, embryo; GFP, green fluorescence protein; KI, knock-in; N, N terminus; PH, Pleckstrin homology domain; SCA-5, spinocerebellar ataxia type 5; SH3, Src homology domain 3; WT, wild type.
Fig 2
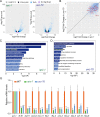
Fig 2. Spectrin promotes ciliary gene expression.
(A) Volcano plot of DEGs between WT and spc-1 or unc-70 mutant animals. Biological replicates: N = 3 for WT, spc-1, and unc-70. (B) Scatter plot of the gene expression reduction in spc-1 and unc-70 mutant animals. Red genes correspond to the significantly down-regulated ciliary genes. (C–D) Gene enrichment analysis for the down-regulated genes in spc-1 or unc-70. Shown are the top 10 most significantly overpresented gene sets. (E) qPCR quantification of the ciliary genes and the control (an actin gene, act-1) transcripts in WT and mutants. Three biological replicates for all the genotypes. ***p < 0.001, **p < 0.01, *p < 0.05; one-way ANOVA (and nonparametric). Averages and SDs are plotted. Error bar, SEM. Data associated with this figure can be found in S1 Data. cGMP, cyclic guanosine monophosphate; DEG, differentially expressed gene; FDR, false discovery rate; LogFC, LogFold Change; qPCR, quantitative polymerase chain reaction; WT, wild type.
Fig 3
Fig 3. Spectrin supports ciliogenesis.
(A) Amphid (top) and phasmid (bottom) cilia in WT, spc-1 (cas971), and unc-70 (cas983) mutants were labeled with IFT80/CHE-2::3×GFP. Arrowheads, the ciliary base and TZ; m.s. or d.s. of sensory cilia. Scale bar, 5 μm. (B, top) Quantifications of the animals showing no staining (red) or weak staining (light red) defects in the dye-filling assay in phasmid cilia from WT and mutant animals (N = 250–350). (Bottom) Cilium length (mean ± SEM). The color code for each genotype is indicated. ***p < 0.001. (C) Kymographs show particle movement along the ciliary m.s. or d.s. of phasmid cilia in WT and mutants. Representative particle traces are marked with magenta and indigo lines. The scale bars represent 5 μm (horizontal) and 5 s (vertical). (D) Summary of the anterograde and retrograde velocities of CHE-2::3×GFP in WT and spectrin-mutant cilia that have the d.s. and m.s. Numbers of IFT particles are shown in the brackets. (E) Histogram of CHE-2::3×GFP velocities. (Left) Anterograde IFT along the middle segments. (Middle) Anterograde IFT along the d.s. (Right) retrograde IFT. Each plot was fit by a Gaussian distribution. Comparisons were between the WT and mutants, **p < 0.01; ***p < 0.001. (F) The anterograde and retrograde IFT movement velocities (mean ± SEM) of CHE-2::3×GFP in individual WT and spectrin-mutant animals. Color codes for genotype are the same as in (B) and (E). Comparisons were between the WT and mutants, *p < 0.05; ***p < 0.001. (G) Anterograde (red) and retrograde (green) IFT frequencies (mean ± SEM) in WT and spectrin-mutant cilia. Numbers of kymographs used for quantification are shown above the genotypes. Comparisons were between the WT and mutants. ***p < 0.001. Data associated with this figure can be found in S1 Data. d.s., distal segment; GFP, green fluorescence protein; IFT, intraflagellar transport; m.s., middle segment; TZ, transition zone; WT, wild type.
Fig 4
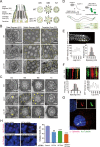
Fig 4. TEM analysis of the ciliary ultrastructure, spectrin localization, and mammalian spectrin in cilia.
(A, left) Schematic of the longitudinal ultrastructure of amphid channel cilia (only 4 cilia shown). The glial socket cell (dark green) and sheath cells (light yellow) are shown. (Right) Schematics summarize the traverse ultrastructural phenotypes of cilia from WT (N2), spc-1 (cas971), and unc-70 (cas983) mutant animals. A red asterisk indicates the area lack of axonemal MTs. Incomplete B subfibers are represented in red. (B) Representative TEM images (cross-sections) of the amphid channel cilia (yellow outlines) DS, MS, and TZ in WT and mutants. Scale bar, 500 nm. (C) High magnification images of amphid channel cilia in WT and mutants. Yellow asterisks indicate areas that lack axonemal MTs. Yellow arrowheads indicate incomplete B subfibers in the axoneme. Scale bar, 100 nm. (D, top) Schematic diagram for spectrin fluorescence signal amplification by tandem 7×GFP11 tag, with the specific illumination in C. elegans ciliated neurons by the split scheme. (Bottom) 7×GFP in ciliated neurons and a zoomed phasmid cilium to show the dendrite and cilium segments used for analyzing spectrin periodic structures in (E–F). (E, top) The representative image of SPC-1::7×GFP in the dendrite of a live C. elegans. (Bottom) Corresponding fluorescence intensity of the boxed region (left) and the histogram of the spacings between periodic structure (right, N = 128 spacings). The red line is a Gaussian fit with a mean of 204.4 nm and an SD of 46.6 nm. Scale bar, 1 μm. (F, top) The representative image of SPC-1::7×GFP (green) and mCherry-tagged OSM-6 (red) in phasmid cilia (left); the magnified image of phasmid cilia (right) and the corresponding SPC-1::7×GFP fluorescence intensity of the boxed region (bottom). Histogram of the spacings between spectrin periodic structure in cilia (N = 75 spacings). The red line is a Gaussian fit with a mean of 214.6 nm and an SD of 24.6 nm. Scale bar, 1 μm. (G) Co-localization of mouse α-spectrin and acetylated tubulin immunofluorescence in cilia of IMCD3 cells. DNA was stained with DAPI in blue. (H) α-spectrin (SPTN1 or SPTAN1) knockdown reduced ciliate cell numbers after 48-h siRNA transfection. The number of the cells: control, N = 569; RNAi of SPTN1, N = 286; SPTAN1, N = 402; and SPTN1 + SPTAN1, N = 325. Values, mean ± SD (n = 3). Student t test: **p < 0.01; ***p < 0.001. Scale bars in (G–H), 5 μm. Data associated with this figure can be found in S1 Data. a.u, arbitrary unit; DS, distal segment; GFP, green fluorescence protein; IMCD3, inner medullary collecting duct; MS, middle segment; MT, microtubule; RNAi, RNA interference; siRNA, small interfering RNA; TEM, transmission electron microscope; TZ, transition zone; WT, wild type.

Similar articles

Cited by

References

    1. Anvarian Z, Mykytyn K, Mukhopadhyay S, Pedersen LB, Christensen ST. Cellular signalling by primary cilia in development, organ function and disease. Nat Rev Nephrol. 2019;15(4):199–219. 10.1038/s41581-019-0116-9 - DOI - PMC - PubMed
    1. Breslow DK, Holland AJ. Mechanism and Regulation of Centriole and Cilium Biogenesis. Annu Rev Biochem. 2019. - PMC - PubMed
    1. Khan S, Scholey JM. Assembly, Functions and Evolution of Archaella, Flagella and Cilia. Curr Biol. 2018;28(6):R278–R92. 10.1016/j.cub.2018.01.085 - DOI - PubMed
    1. Reiter JF, Leroux MR. Genes and molecular pathways underpinning ciliopathies. Nat Rev Mol Cell Biol. 2017;18(9):533–47. 10.1038/nrm.2017.60 - DOI - PMC - PubMed
    1. Ishikawa H, Marshall WF. Mechanobiology of Ciliogenesis. Bioscience. 2014;64(12):1084–91. 10.1093/biosci/biu173 - DOI - PMC - PubMed

Publication types

MeSH terms