. 2019 Oct 25;101(4):704-718.
doi: 10.1093/biolre/ioz113.

Auxin-inducible protein degradation as a novel approach for protein depletion and reverse genetic discoveries in mammalian oocytes†

Affiliations

Auxin-inducible protein degradation as a novel approach for protein depletion and reverse genetic discoveries in mammalian oocytes†

Nicole J Camlin et al. Biol Reprod. .

Abstract

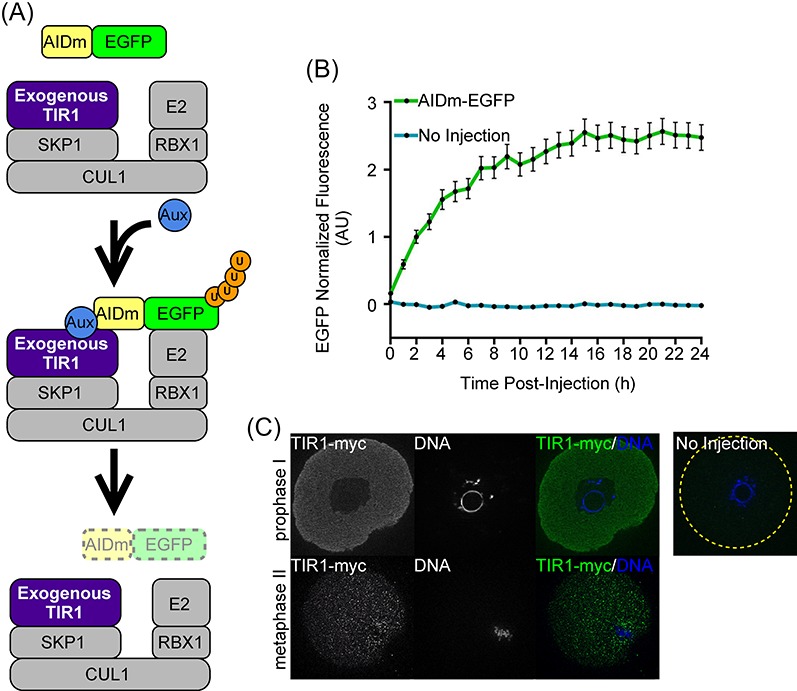
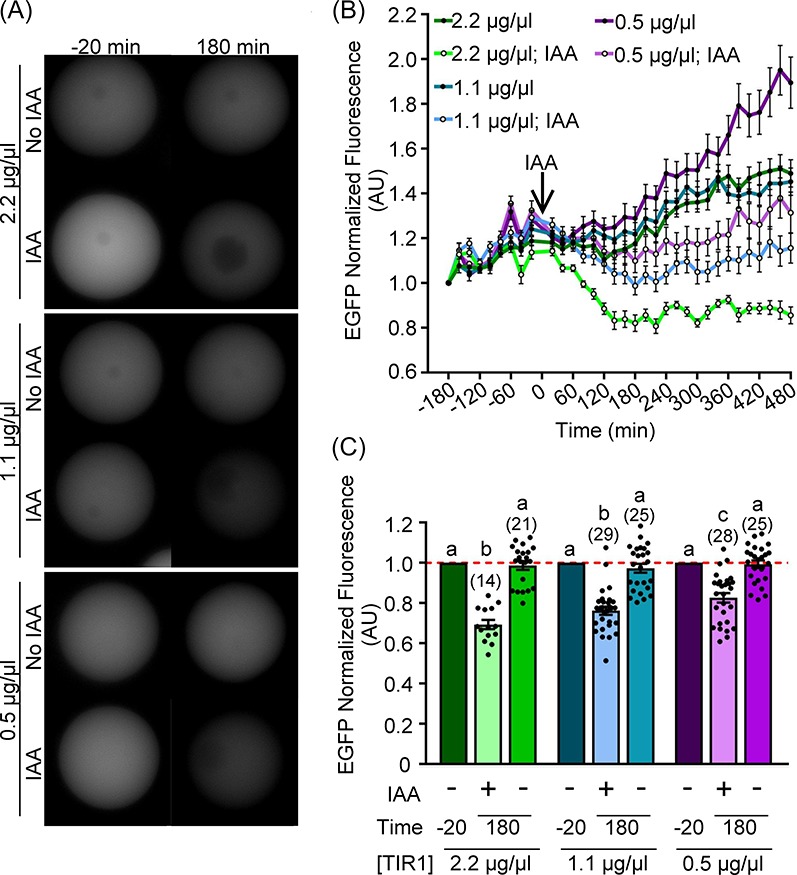
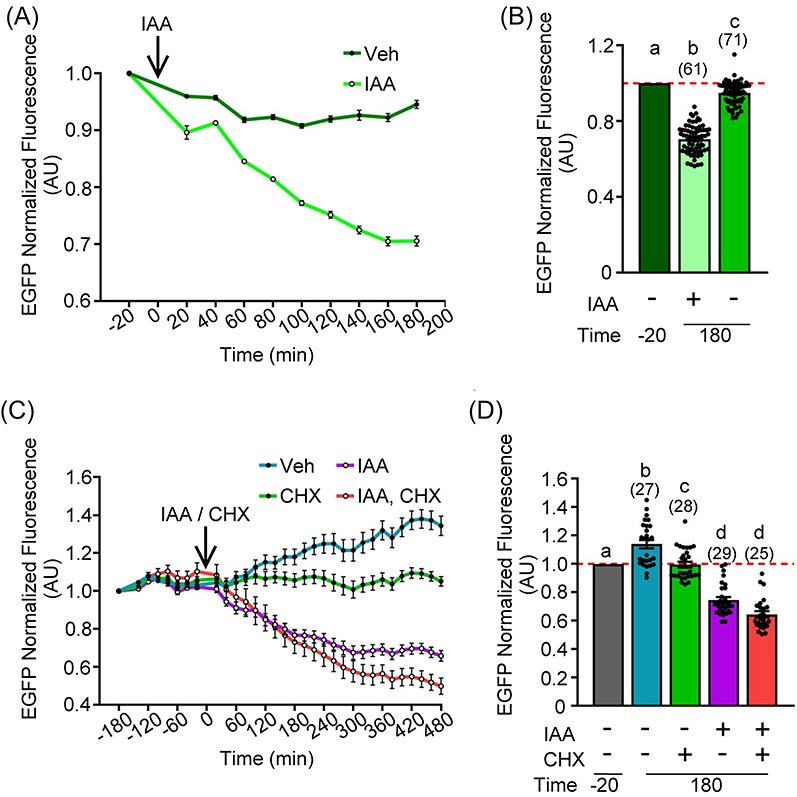
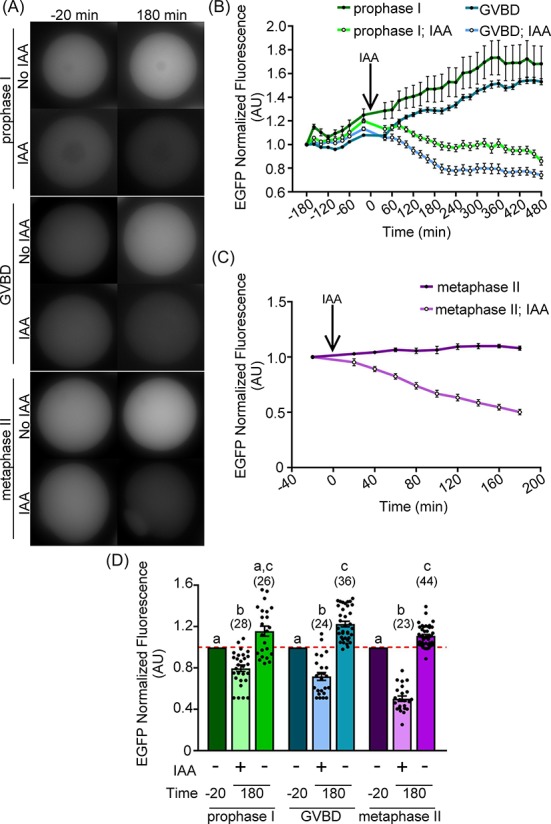
The disruption of protein expression is a major approach used for investigating protein function in mammalian oocytes. This is often achieved with RNAi/morpholino-mediated knockdown or gene knockout, leading to long-term loss of proteins of interest. However, these methods have noteworthy limitations, including (a) slow protein turnover can prohibit use of these approaches; (b) essential roles in early events precludes characterization of functions in subsequent events; (c) extended protein loss can allow time for compensatory mechanisms and other unanticipated events that confound interpretation of results. The work presented here examines the use of auxin-inducible degradation, a powerful new approach that overcomes these limitations through the depletion of one's protein of interest through controllable ubiquitin-mediated degradation. This method has been employed in yeast and mammalian cell lines, and here we demonstrate the utility of auxin-inducible degradation in mouse oocytes at multiple stages of meiosis, through degradation of exogenously expressed EGFP. We also evaluate important parameters for experimental design for use of this system in oocytes. This study thus expands the toolkit of researchers in oocyte biology, establishing the use of this unique and versatile approach for depleting proteins in oocytes, and providing researchers with valuable information to make use of this system.

Keywords: auxin-inducible degradation; meiosis; oocyte; protein depletion.


Figures

Figure 1.
Figure 1.
Overview of the auxin-inducible protein degradation system and exogenous expression of AIDm-EGFP and TIR1-myc in oocytes. (A) Schematic illustration of exogenously expressed TIR1 forming a functional SCF E3 ligase with endogenous SKP1 and CUL1 proteins. When cells are not exposed to auxin (Aux, blue circle), auxin-inducible degron (AIDm) tagged proteins are able to function normally. Addition of Aux leads to interaction of TIR1 with the AIDm, polyubiquitination (U, orange circles) of the AID-tagged protein, and ultimately proteasome-mediated degradation. (B) Graphical representation of EGFP fluorescence intensity over time in oocytes injected with 0.4 μg/μl AIDm-EGFP cRNA. EGFP fluorescence normalized to AIDm-EGFP expression at 2 h. (C) TIR1-myc immunofluorescence in prophase I and MII oocytes injected with 2.2 μg/μl TIR1 cRNA 16–18 h post-injection. Line graph shows mean and SEM of EGFP fluorescence every hour.
Figure 2.
Figure 2.
Range of TIR1-myc cRNA concentrations allows for depletion of exogenously expressed AIDm-EGFP. Prophase I oocytes were microinjected with 0.4 μg/μl AIDm-EGFP and 2.2, 1.1, or 0.5 μg/μl TIR1 cRNA 6 h prior to 500 μM IAA treatment. (A) Live-cell EGFP fluorescence (gray) in prophase I oocytes 20 min prior to (−20 min) and 180 min after IAA addition. (B) Graphical representation of EGFP fluorescence over time. 500 μM IAA was added at 0 min (arrow). EGFP fluorescence normalized to expression at −180 min. (C) Graphical comparison of EGFP fluorescence before (−20 min) and after (180 min) IAA addition. EGFP fluorescence was normalized to expression at −20 min (ANOVA with Tukey's post hoc). n = number of oocytes analyzed (15–29 over 2–3 technical replicates), P ≤ 0.0391. Line graph shows mean and SEM of EGFP fluorescence every 20 min. Bar graph shows mean, SEM, and individual oocyte scatter plot.
Figure 3.
Figure 3.
Increasing cRNA expression time or inhibiting translation with cycloheximide has no impact on loss of exogenously expressed AIDm-EGFP. (A, B) Oocytes were injected with 0.4 μg/μl AIDm-EGFP cRNA and 2.0–2.2 μg/μl TIR1-myc cRNA, and allowed to express cRNA for 16 h prior to 500 μM IAA treatment. (A) Graphical representation of EGFP fluorescence over time. 500 μM IAA was added at 0 min (arrow). EGFP fluorescence normalized to expression at −20 min. (B) Graphical comparison of EGFP fluorescence before (−20 min) and after (180 min) IAA addition. EGFP fluorescence was normalized to expression at −20 min (ANOVA with Tukey's post hoc). n = number of oocytes analyzed (61–71 over two technical replicates), P < 0.0001. (C, D) Oocytes were injected with 0.4 μg/μl AIDm-EGFP cRNA and 2.0 μg/μl TIR1-myc cRNA, and allowed to translate protein from the injected cRNA for 6 h prior to 500 μM IAA and/or CHX treatment. (C) Graphical representation of EGFP fluorescence over time. IAA and/or CHX were added at 0 min (arrow). EGFP fluorescence normalized to expression at −180 min. (D) Graphical comparison of EGFP fluorescence before (−20 min) and after (180 min) IAA and/or CHX addition. EGFP fluorescence normalized to expression at −20 min (Kruskal–Wallis test with Dunn's post hoc). n = number of oocytes analyzed (25–29 over two technical replicates), P ≤ 0.0072. Line graphs show mean and SEM of EGFP fluorescence every 20 min. Bar graphs show mean, SEM, and individual oocyte scatter plots.
Figure 4.
Figure 4.
Auxin-inducible degradation works during meiosis I and at metaphase II (MII) arrest. Oocytes were injected with 0.4 μg/μl AIDm-EGFP cRNA and 2.0–2.2 μg/μl TIR1-myc cRNA, and allowed to express cRNA for 3 h prior to imaging and initiation of meiotic maturation (GVBD oocytes). (A) Live-cell EGFP fluorescence (gray) in oocytes 20 min prior to (−20 min) and 180 min after IAA addition. (B, C) Graphical representation of EGFP fluorescence over time in prophase I, GVBD (B), or MII (C) oocytes. IAA was added at a concentration of 500 μM at t = 0 min (arrow). EGFP fluorescence normalized to expression at −180 min (prophase I and GVBD) or −20 min (MII). (D) Graphical comparison of EGFP fluorescence before (−20 min) and after (180 min) IAA addition. EGFP fluorescence normalized to expression at −20 min (Kruskal–Wallis test with Dunn's post hoc). n = number of oocytes analyzed (23–44 over three technical replicates), P < 0.0001. Line graphs show mean and SEM of EGFP fluorescence every 20 min. Bar graph shows mean, SEM, and individual oocyte scatter plot.
Figure 5.
Figure 5.
Auxin type impacts meiotic maturation with live-cell imaging. Impact of exposure to light and/or auxin (IAA or NAA) on oocyte maturation rate. (A) DIC images of oocytes at 540 min post-milrinone washout. Oocytes were exposed to white light + 470 nm wavelength light every 20 min, and 500 μM IAA or NAA throughout in vitro maturation (IVM). (B) Graphical representation of percentage of oocytes at MII following 16 h of IVM in vehicle, 500 μM IAA, or 500 μM NAA with (+) or without (–) exposure every 20 min to white light and 470 nm wavelength light. n = number of oocytes analyzed (35–79 over three technical replicates), ***P ≤ 0.0001. (C) Graphical representation of percentage of oocytes at MII following 16 h IVM in vehicle or 500 μM IAA with exposure every 20 min at 556 or 640 nm wavelength light. n = number of oocytes analyzed (40–49 over three technical replicates), ***P ≤ 0.0001. Bar graphs show percentage of oocytes that emitted a first polar body (PB).
Figure 6.
Figure 6.
NAA induces auxin-inducible degradation to the same extent as IAA. Oocytes were injected with 0.4 μg/μl AIDm-EGFP cRNA and 2.0 μg/μl TIR1-myc cRNA, and allowed to express cRNA for 6 h prior to 500 μM IAA or NAA treatment. (A) Live-cell EGFP fluorescence (gray) in prophase I oocytes 20 min prior to (−20 min) and 180 min post IAA or NAA addition. (B) Graphical representation of EGFP fluorescence over time in vehicle, IAA, or NAA-exposed oocytes. Auxin was added at a concentration of 500 μM at t = 0 min (arrow). EGFP fluorescence normalized to expression at −180 min. (C) Graphical comparison of EGFP 180 min after auxin addition. EGFP fluorescence normalized to expression at −20 min (Kruskal–Wallis test with Dunn's post hoc). n = number of oocytes analyzed (39–46 over four technical replicates), P < 0.0001. (D, E) Graphical representation of percentage of oocytes at MII following 16 h of IVM and their time spent in meiosis I (D: Fisher's exact test; E: Mann-Whitney test). Bar graphs show mean, SEM, and individual oocyte scatter plot (C) or percentage of oocytes that emitted a first polar body (D). Line graph shows mean and SEM of EGFP fluorescence every 20 min. Scatter plot shows mean and individual oocyte meiosis I timing.
Figure 7.
Figure 7.
Increased auxin concentration has no impact on loss of exogenously expressed AIDm-EGFP. (A, B) Oocytes were injected with 0.4 μg/μl AIDm-EGFP cRNA and 2.0 μg/μl TIR1-myc cRNA, and allowed to express cRNA for 3 h prior to start of imaging. (A) Graphical representation of EGFP fluorescence over time in prophase I oocytes treated with vehicle, 500 μM, or 1000 μM NAA. NAA was added at 0 min (arrow). EGFP fluorescence normalized to expression at −180 min. (B) Graphical comparison of EGFP fluorescence before (−20 min) and after (180 min) NAA addition. EGFP fluorescence was normalized to expression at −20 min (Kruskal–Wallis test with Dunn's post hoc). n = number of oocytes analyzed (23–26 over three technical replicates), P ≤ 0.0001. (C, D) Oocytes were injected with 0.4 μg/μl AIDm-EGFP cRNA and 2.0 μg/μl TIR1-myc cRNA, and allowed to express protein from the injected cRNA for 5 h prior to live-cell imaging. (C) Graphical representation of EGFP fluorescence over time in prophase I oocytes treated with vehicle, 500 μM, 1000 μM, or 2000 μM IAA. IAA was added at 0 min (arrow). EGFP fluorescence was normalized to expression at −20 min. (D) Graphical comparison of EGFP fluorescence before (−20 min) and after (180 min) IAA addition. EGFP fluorescence was normalized to expression at −20 min (Kruskal–Wallis test with Dunn's post hoc). n = number of oocytes analyzed (14–28 over two technical replicates), P ≤ 0.0001. Line graphs show mean and SEM of EGFP fluorescence every 20 min (B) or 180 min (D). Bar graph shows mean, SEM, and individual oocyte scatter plot in auxin-exposed and control oocytes.
Figure 8.
Figure 8.
Auxin removal allows AIDm-EGFP expression to recover. Oocytes were injected with 0.4 μg/μl AIDm-EGFP cRNA and 2.0 μg/μl TIR1-myc cRNA, and allowed to express cRNA for 16 h in culture media containing vehicle, 500 μM IAA or 500 μM NAA. Just prior to imaging, oocytes were washed into media containing vehicle, 500 μM IAA, or 500 μM NAA. (A) Graphical comparison of EGFP fluorescence at the start of imaging (20 min) and 500 min later. Table shows culture conditions for the initial 16 h (treatment 1) and then culture conditions initiated immediately prior to live-cell imaging (treatment 2). EGFP fluorescence of each oocyte normalized to its expression at 20 min (ANOVA with Tukey's post hoc). n = number of oocytes analyzed (12–31 over three technical replicates); ***P ≤ 0.0001, **P = 0.0005, *P = 0.0077. See the text and Supplementary Figure S2B for information on increased EGFP fluorescence in oocytes continually exposed to IAA. (B) Graphical representation of EGFP fluorescence over time. EGFP fluorescence normalized to average EGFP expression in oocytes continually exposed to vehicle at t = 20 min. Bar graph shows mean, SEM, and individual oocyte scatter plot. Line graphs show mean and SEM of EGFP fluorescence every 20 min.

Similar articles

Cited by

References

    1. Toyama Brandon H, Savas Jeffrey N, Park Sung K, Harris Michael S, Ingolia Nicholas T, Yates John R, III, Hetzer Martin W. Identification of long-lived proteins reveals exceptional stability of essential cellular structures. Cell 2013; 154:971–982. - PMC - PubMed
    1. Smoak EM, Stein P, Schultz RM, Lampson MA, Black BE. Long-term retention of CENP-A nucleosomes in mammalian oocytes underpins transgenerational inheritance of centromere identity. Curr Biol 2016; 26:1110–1116. - PMC - PubMed
    1. Li J, Tang J-X, Cheng J-M, Hu B, Wang Y-Q, Aalia B, Li X-Y, Jin C, Wang X-X, Deng S-L, Zhang Y, Chen S-R, et al. Cyclin B2 can compensate for Cyclin B1 in oocyte meiosis I. J Cell Biol 2018; 217(11):3901–3911. - PMC - PubMed
    1. Luo J, McGinnis LK, Kinsey WH. Role of Fyn kinase in oocyte developmental potential. Reprod Fertil Dev 2010; 22:3901–3911. - PMC - PubMed
    1. Adhikari D, Diril MK, Busayavalasa K, Risal S, Nakagawa S, Lindkvist R, Shen Y, Coppola V, Tessarollo L, Kudo NR, Kaldis P, Liu K. Mastl is required for timely activation of APC/C in meiosis I and Cdk1 reactivation in meiosis II. J Cell Biol 2014; 206:843–853. - PMC - PubMed

Publication types

MeSH terms

Substances