. 2019 Jul 11;178(2):302-315.e23.
doi: 10.1016/j.cell.2019.05.035.

The Cytoplasmic DNA Sensor cGAS Promotes Mitotic Cell Death

Affiliations

The Cytoplasmic DNA Sensor cGAS Promotes Mitotic Cell Death

Christian Zierhut et al. Cell. .

Abstract

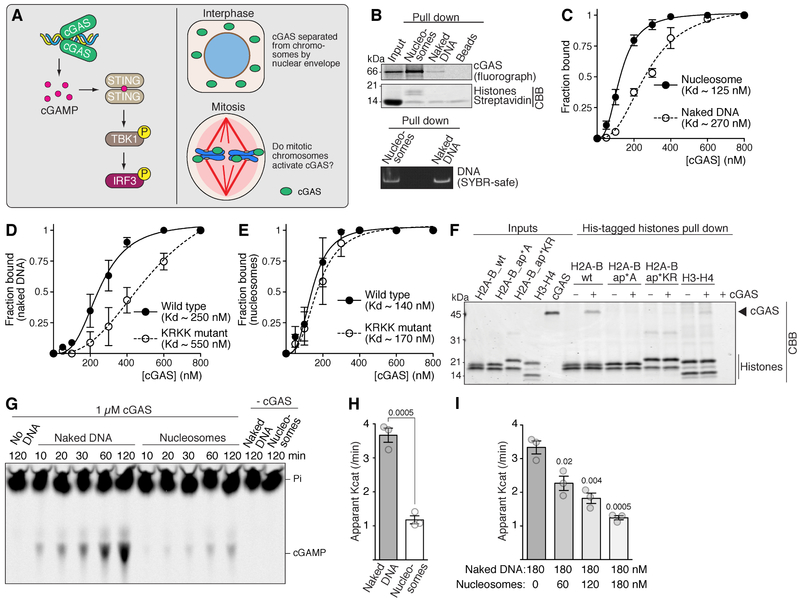
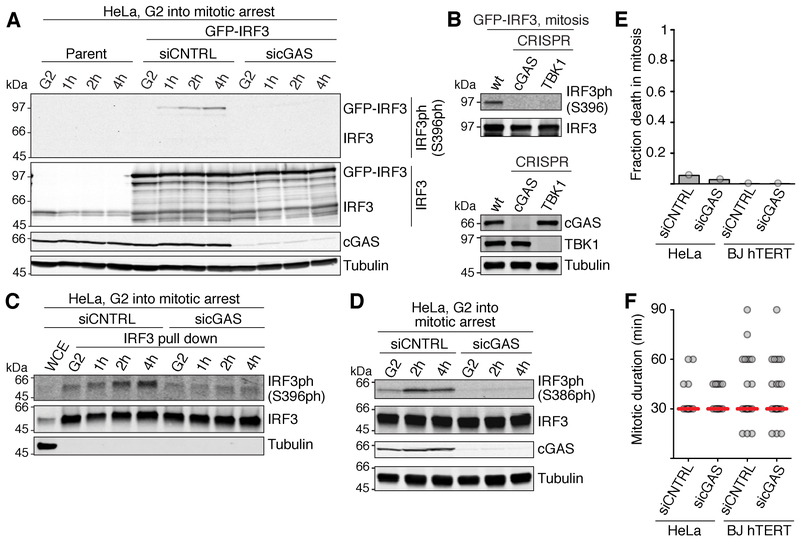
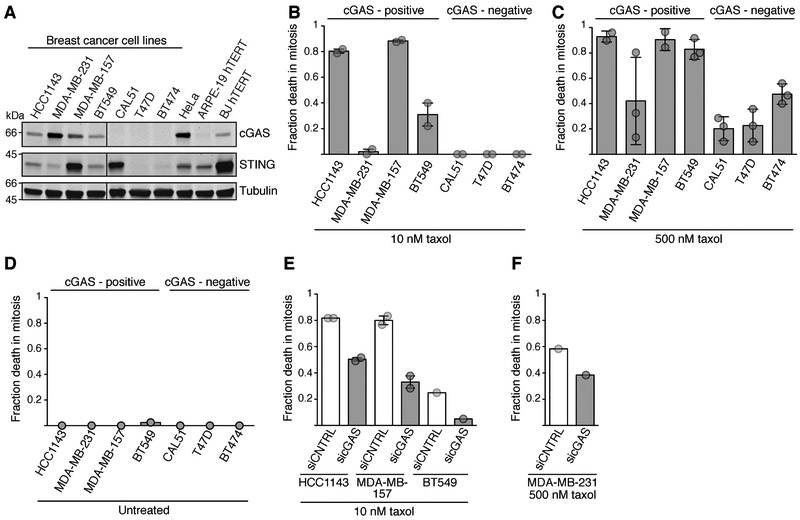
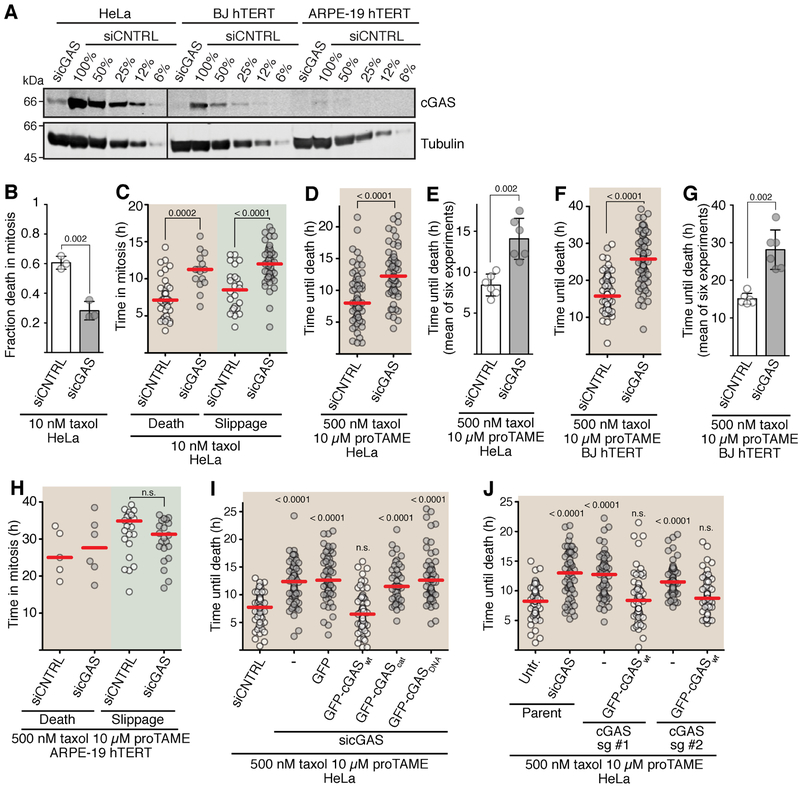
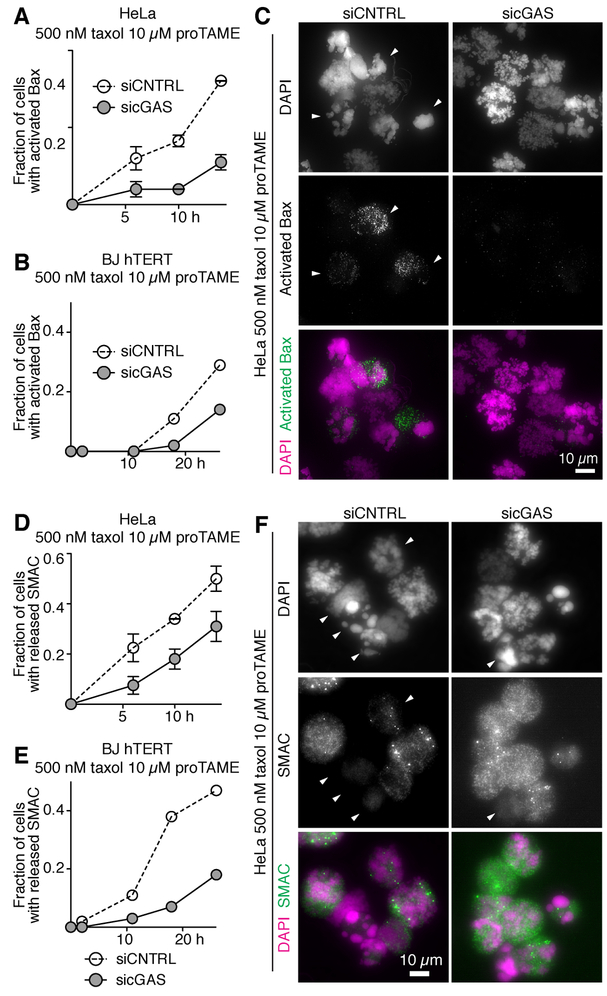
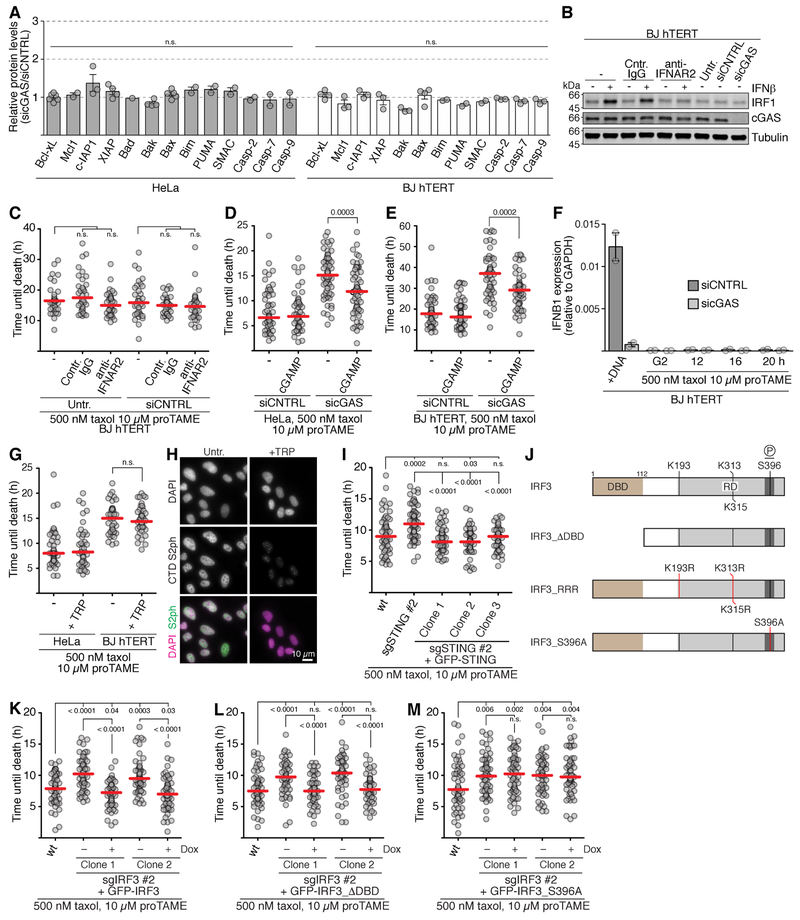
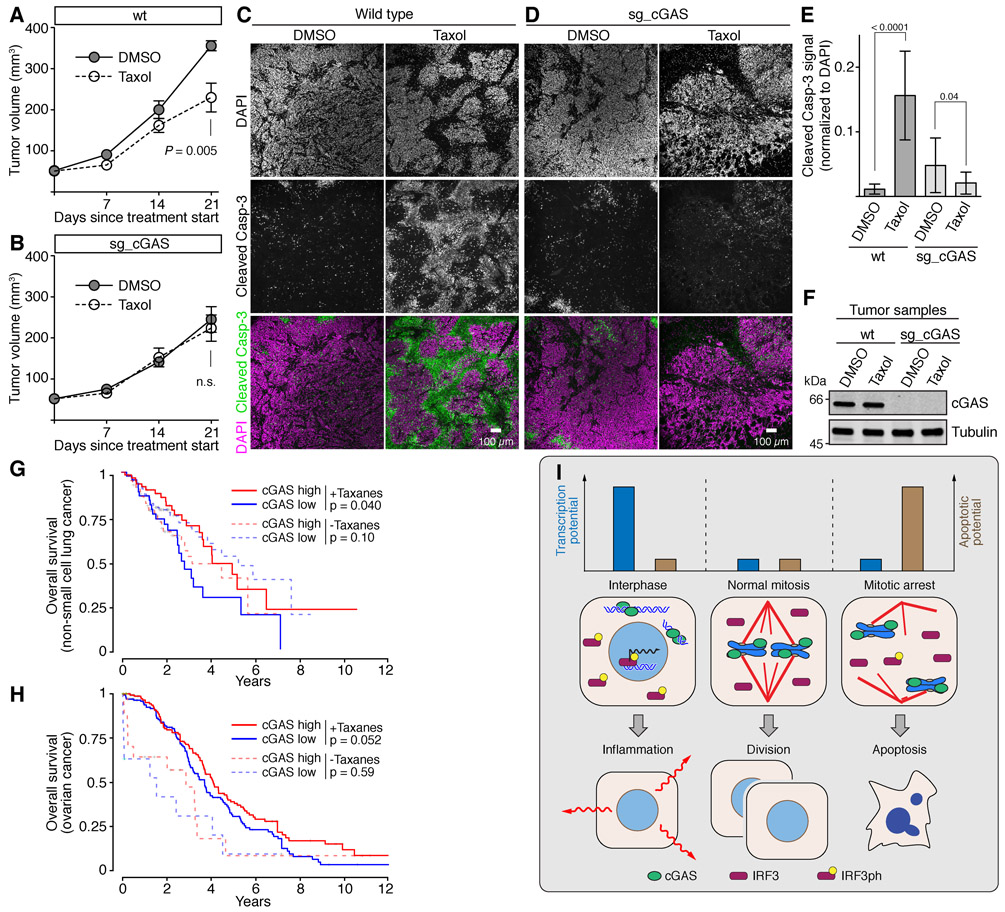
Pathogenic and other cytoplasmic DNAs activate the cyclic GMP-AMP synthase (cGAS)-stimulator of interferon genes (STING) pathway to induce inflammation via transcriptional activation by IRF3 and nuclear factor κB (NF-κB), but the functional consequences of exposing cGAS to chromosomes upon mitotic nuclear envelope breakdown are unknown. Here, we show that nucleosomes competitively inhibit DNA-dependent cGAS activation and that the cGAS-STING pathway is not effectively activated during normal mitosis. However, during mitotic arrest, low level cGAS-dependent IRF3 phosphorylation slowly accumulates without triggering inflammation. Phosphorylated IRF3, independently of its DNA-binding domain, stimulates apoptosis through alleviating Bcl-xL-dependent suppression of mitochondrial outer membrane permeabilization. We propose that slow accumulation of phosphorylated IRF3, normally not sufficient for inducing inflammation, can trigger transcription-independent induction of apoptosis upon mitotic aberrations. Accordingly, expression of cGAS and IRF3 in cancer cells makes mouse xenograft tumors responsive to the anti-mitotic agent Taxol. The Cancer Genome Atlas (TCGA) datasets for non-small cell lung cancer patients also suggest an effect of cGAS expression on taxane response.

Keywords: cGAS; cancer; cell death; innate immunity; mitosis; paclitaxel; taxane.


Conflict of interest statement

DECLARATION OF INTERESTS

The authors declare that no competing financial interests exist.

H.F. is affiliated with Graduate School of Medical Sciences, Weill Cornell Medicine, and Cell Biology Program, the Sloan Kettering Institute.

Figures

Figure 1.
Figure 1.. Nucleosomes bind cGAS with higher affinity than does naked DNA but inhibit cGAS catalytic activity.
(A) Schematics of cGAS signaling. (B) Beads with or without naked DNA/nucleosomes were incubated with 35S-labelled cGAS. Proteins and DNA associated with beads were detected by fluorometry and Coomassie brilliant blue (CBB) (top), and SYBR-Safe (bottom). (C) Gel mobility shift binding analysis with purified cGAS and naked DNA or mononucleosomes. Means and SEM (n ≥ 3). See Figure S1C for an example gel. (D and E) Binding analysis of purified wild type cGAS or cGAS mutated in the DNA binding domain (KRKK mutant) for naked DNA or mononucleosomes. Means and SEM (n ≥ 3). (F) His-tagged H2A–B or H3–H4 were incubated with cGAS and Talon beads. Proteins associated with beads were detected by CBB. H2A-B_ap*A, acidic patch to alanine mutant; H2A-B_ap*KR, acidic patch to lysine/arginine mutant. (G–I) Thin-layer chromatography analysis of cGAS activity (see also Figure S1D). (G) Typical example using either naked DNA or nucleosomes as cGAS stimulator. (H) Apparent Kcat of cGAS. Mean values and SEM (n=3). (I) Apparent Kcat of cGAS with naked DNA and increasing concentrations of mononucleosomes. Mean values and SEM (n=3). See also Figure S1.
Figure 2.
Figure 2.. The cGAS pathway is inactive during normal mitosis but is activated late in mitotic arrest
(A) Western blot analysis of IRF3 phosphorylation of the indicated HeLa cells, harvested either in G2 or after the indicated times during mitotic arrest in 500 nM taxol, 10 μM proTAME. (B) Western blot analysis of GFP-IRF3 S396 phosphorylation in mitotic arrest using the indicated cell lines (top). Bottom, verification of CRISPR-Cas9 disruptions. (C) Western blot analysis of S396 phosphorylation of endogenous IRF3 immunoprecipitated from G2 arrested HeLa cells, or from cells at the indicated time points during arrest in 500 nM taxol, 10 μM proTAME. (D) Western blot analysis of IRF3 S386 phosphorylation in HeLa cells harvested either in G2 or after the indicated times during arrest in 500 nM taxol, 10 μM proTAME. (E) Fraction of cells (determined by live microscopy) of the indicated cell line and treatment that die in an unperturbed mitosis (n=30-50 for each sample). (F) Length of mitosis (nuclear envelope breakdown - anaphase) determined by 15 min-interval time-lapse microscopy (n=30-50 for each sample). Red line: median. siCNTRL, non-targeting control siRNA; sicGAS, siRNA targeting cGAS. See also Figure S2.
Figure 3.
Figure 3.. cGAS expression correlates with taxol sensitivity in a panel of breast cancer cells
(A) Western blot analysis of cGAS and STING in the indicated cell lines. The vertical line indicates removed irrelevant lanes. (B-F) Time-lapse microscopy analysis of mitotic cell death in the indicated asynchronous populations following the indicated treatments. (B) Fraction mitotic cell death in 10 nM taxol (n=50 for each sample). Averages and range are shown from two experiments. (C) Fraction mitotic cell death in 500 nM taxol (n=45 for each sample). Data from two (HCC1143, MDA-MB-157) or three experiments (all others, averages and range plotted). (D) Mitotic cell death frequency of unperturbed mitosis (n=40 for each sample). (E) Effect of cGAS knockdown on mitotic cell death (10 nM taxol) in HCC1143, MDA-MB-157 and BT549 treated with the indicated siRNA (n=60 for each sample). Data from two (HCC1143, MDA-MB-157, averages and range plotted) or one experiment (BT549). (F) Effect of cGAS knockdown on mitotic cell death (500 nM taxol, n=60 for each sample) in MDA-MB-231 treated with the indicated siRNA. siCNTRL, non-targeting control siRNA; sicGAS, siRNA targeting cGAS. See also Figure S3.
Figure 4.
Figure 4.. cGAS promotes cell death in mitosis
(A) Western blot analysis of cGAS levels. Dilution series from extracts made from siCNTRL cells were used to assess cGAS depletion. The vertical line indicates removed irrelevant lanes. (B–J) Time-lapse microscopy analysis of mitotic cell death. Cells were released from G2 arrest into M phase with the indicated drugs, and duration of mitosis until death or slippage was monitored. Red lines, median. siCNTRL, non-targeting control siRNA; sicGAS, siRNA targeting cGAS. (B and C) Fraction of mitotic cell death of HeLa cells in 10 nM taxol. (B) Means and range (error bars) from three experiments (n=60 each). (C) Timing of mitotic cell death and slippage of individual cells (n=60 each). (D and E) Timing of cell death in HeLa cells released into 500 nM taxol 10 μM proTAME. (D) Timing of death of individual cells (n=60). (E) Means and SD from six experiments (dots are medians from each experiment). (F and G) Timing of cell death in BJ hTERT released into 500 nM taxol 10 μM proTAME. (F) Timing of death in individual cells (n=80). (G) Means and SD from six experiments (dots are medians from each experiment). (H) Timing of mitotic cell death and slippage of ARPE-19 hTERT cells (n=40 each) released into 500 nM taxol 10 μM proTAME. One of two replicates shown. (I) Complementation analysis in HeLa cells. Timing of mitotic cell death of individual HeLa cells (n ~50 each) was analyzed. cGAScat, catalytic mutant. cGASdna, DNA binding-induced catalytic activity mutant. See Figure S4J for Western blot of cGAS. One of two replicates shown. (J) Analysis of mitotic lifespan of individual cells of cGAS disruption mutants (n=60) released into 500 nM taxol 10 μM proTAME. Cell lines generated with two different short guide RNAs (sg #1 and sg #2), as well as clones from these that express wild type GFP-cGAS were used. Untr., no siRNA treatment. See Figure S4L for Western blot of cGAS levels. See also Figure S4.
Figure 5.
Figure 5.. cGAS promotes mitotic cell death by accelerating MOMP
(A–C) Bax activation in the indicated cell lines released from G2 into 500 nM taxol 10 μM proTAME. Cells were stained with the 6A7 antibody recognizing activated Bax. (A and B) Quantifications of HeLa cells (A, mean and range from two experiments) and BJ hTERT cells (B). (C) Representative images of HeLa cells at 14 h. Arrowheads, cells positive for activated Bax. (D–F) SMAC release from mitochondria in the indicated cell lines released from G2 into 500 nM taxol 10 μM proTAME. Cells were stained for SMAC. (D and E) Quantifications of HeLa cells (D, mean and range from two experiments) and BJ hTERT cells (E). (F) Representative images of HeLa cells at 14 h. Arrowheads, cells with delocalized SMAC. Note that delocalization manifests itself as weak signal intensity. See Figure S5J for SMAC staining of untreated mitotic cells. siCNTRL, non-targeting control siRNA; sicGAS, siRNA targeting cGAS. See also Figure S5.
Figure 6.
Figure 6.. The cGAS-cGAMP-STING-IRF3 axis promotes mitotic cell death independently of transcriptional induction
(A) Western blot analysis (means and SEM) of the indicated proteins in the indicated cell lines arrested in G2. (B and C) Treatment of cells with neutralizing anti-IFNAR 2 antibodies. (B) Western blot analysis of BJ hTERT cells following IFNβ addition with and without anti-IFNAR2 antibodies. (C) Mitotic lifespan of the indicated BJ hTERT cells (n=34-40 each) grown in the presence of the indicated antibodies and released from G2 arrest into 500 nM taxol 10 μM proTAME. (D and E) Mitotic lifespan of cells (n=50 each) arrested in G2 and released into 500 nM taxol 10 μM proTAME. After 1.5 h (HeLa Cells, D) or 4 h (BJ hTERT cells, E), cGAMP was added to 33 μM for the indicated cells. Only cells that had already entered mitosis were analyzed. (F) IFNB1 expression by quantitative PCR in the indicated cells. +DNA, asynchronous cells transfected with naked DNA. Cells were released from G2 arrest into media containing the indicated drugs. Mean and range from two experiments. (G and H) Analysis of transcription inhibition. (G) Mitotic lifespan of cells (n=60 each) arrested in G2 and released into 500 nM taxol 10 μM proTAME. After 1.5 h (HeLa) or 4 h (BJ hTERT), triptolide (TRP) was added to 10 μM for the indicated cells. Only cells that had already entered mitosis were included in the analyzed. (H) Verification of transcription inhibition by TRP. Asynchronous HeLa cells treated with 10 μM TRP were stained with antibodies against serine 2 phosphorylation of the C-terminal tail of RNA polymerase II (CTD S2ph). (I) Mitotic lifespan of the indicated cells (n=60 each) arrested in G2 and released into 500 nM taxol 10 μM proTAME. See Figure S6G for Western blot analysis. (J) IRF3 rescue constructs. DBD, DNA-binding domain (gold). RD, regulatory domain (light gray). Region around S396 (dark gray). (K–M) Mitotic lifespan of an IRF3 disruption cell line containing rescue constructs expressing doxycycline-inducible wild type GFP-IRF3 (K), a mutant lacking the DNA binding domain (L) or a mutant expressing GFP-IRF3 carrying the S396A mutation (M). See Figures S6H-S6J for Western blot. Cells were arrested in G2 and released into 500 nM taxol 10 μM proTAME (n=60 each). Red lines, median. siCNTRL, non-targeting control siRNA; sicGAS, siRNA targeting cGAS; Untr., no siRNA treatment. See also Figure S6.
Figure 7.
Figure 7.. The cGAS pathway promotes the response to taxol in a mouse xenograft cancer model, and correlates with increased survival in lung and ovarian cancer patients.
.(A-F) Xenograft tumors formed by wild type or cGAS-disrupted (sg_cGAS) HeLa cells injected into immunocompromised (NSG) mice were subjected to weekly treatments with taxol or DMSO (see also Figure S7A). (A and B) Growth curves for the indicated tumors and treatments (mean and SEM; n=6 for wt + DMSO; n=8 for wt +Taxol; n=6 for sg_cGAS + DMSO; n=5 for sg_cGAS + taxol). (C–E) Apoptosis in the indicated tumor samples as determined with antibodies recognizing the cleaved (active) form of caspase-3. (C and D) sample images for the indicated tumors and treatments (scale bar, 100 μm). (E) quantifications of cleaved caspase-3 signal in taxol treated samples divided by the signal in DMSO treated samples (means and SD). (F) Western blot analysis of tumors recovered at the end of the experiment. (G and H) Survival curves of non-small cell lung (G) and ovarian (H) cancer patients from the TCGA database stratified according to treatment (taxane vs. other) and expression levels of cGAS (cutoff: median). See Table S1 and Table S2 for patient numbers. (I) Model for cGAS functions during infection and mitosis. Left: Due to a high transcriptional potential in interphase, activation of cGAS by cytoplasmic DNA predominantly results in inflammation. Middle: During normal mitosis, cGAS associates with mitotic chromosomes, but is inhibited by nucleosomes, and phosphorylated IRF3 is not generated. Right: During mitotic arrest, phosphorylated IRF3 slowly accumulates. Due to a high apoptotic potential but a low transcriptional potential, apoptosis rather than inflammation is induced. See also Figure S7, Table S1 and Table S2.

References

    1. Abe T, and Barber GN (2014). Cytosolic-DNA-mediated, STING-dependent proinflammatory gene induction necessitates canonical NF-κB activation through TBK1. J Virol 88, 5328–5341. - PMC - PubMed
    1. Ablasser A, Goldeck M, Cavlar T, Deimling T, Witte G, RÖhl I, Hopfner K-P, Ludwig J, and Hornung V (2013). cGAS produces a 2“-5-”linked cyclic dinucleotide second messenger that activates STING. Nature 498, 380–384. - PMC - PubMed
    1. Allan LA, and Clarke PR (2007). Phosphorylation of caspase-9 by CDK1/cyclin B1 protects mitotic cells against apoptosis. Mol Cell 26, 301–310. - PubMed
    1. Andersen JL, Johnson CE, Freel CD, Parrish AB, Day JL, Buchakjian MR, Nutt LK, Thompson JW, Moseley MA, and Kornbluth S (2009). Restraint of apoptosis during mitosis through interdomain phosphorylation of caspase-2. Embo J 28, 3216–3227. - PMC - PubMed
    1. Andreeva L, Hiller B, Kostrewa D, Lässig C, de Oliveira Mann CC, Jan Drexler D, Maiser A, Gaidt M, Leonhardt H, Hornung V, et al. (2017). cGAS senses long and HMGB/TFAM-bound U-turn DNA by forming protein-DNA ladders. Nature 549, 394–398. - PubMed

Publication types

MeSH terms

LinkOut - more resources