. 2019 Jul 12;20(1):577.
doi: 10.1186/s12864-019-5927-3.

Alternative polyadenylation produces multiple 3' untranslated regions of odorant receptor mRNAs in mouse olfactory sensory neurons

Affiliations

Alternative polyadenylation produces multiple 3' untranslated regions of odorant receptor mRNAs in mouse olfactory sensory neurons

Mohamed Doulazmi et al. BMC Genomics. .

Abstract

Background: Odorant receptor genes constitute the largest gene family in mammalian genomes and this family has been extensively studied in several species, but to date far less attention has been paid to the characterization of their mRNA 3' untranslated regions (3'UTRs). Given the increasing importance of UTRs in the understanding of RNA metabolism, and the growing interest in alternative polyadenylation especially in the nervous system, we aimed at identifying the alternative isoforms of odorant receptor mRNAs generated through 3'UTR variation.

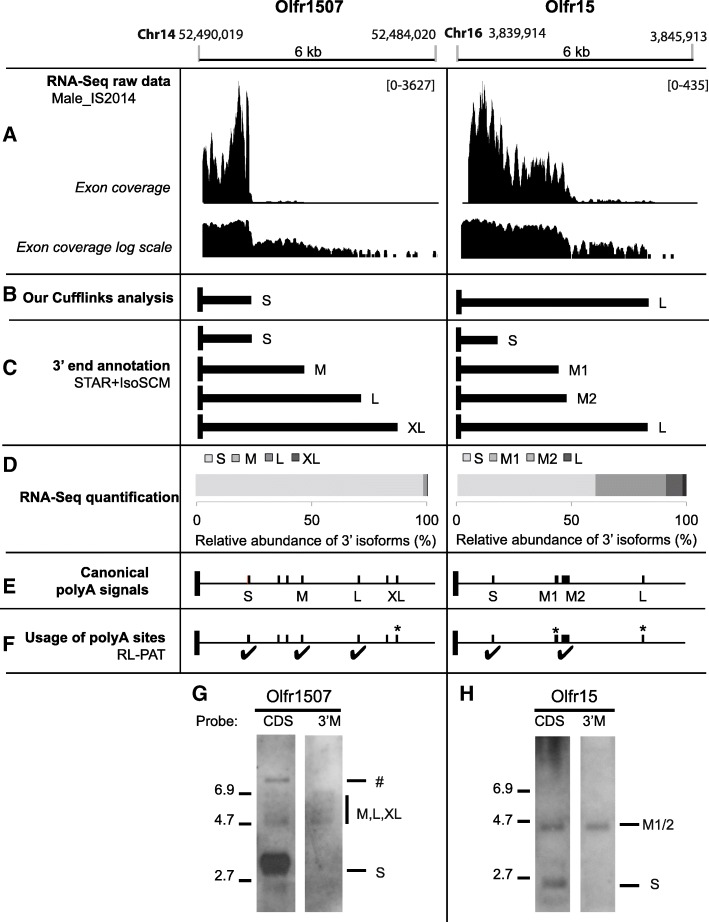
Results: We implemented a dedicated pipeline using IsoSCM instead of Cufflinks to analyze RNA-Seq data from whole olfactory mucosa of adult mice and obtained an extensive description of the 3'UTR isoforms of odorant receptor mRNAs. To validate our bioinformatics approach, we exhaustively analyzed the 3'UTR isoforms produced from 2 pilot genes, using molecular approaches including northern blot and RNA ligation mediated polyadenylation test. Comparison between datasets further validated the pipeline and confirmed the alternative polyadenylation patterns of odorant receptors. Qualitative and quantitative analyses of the annotated 3' regions demonstrate that 1) Odorant receptor 3'UTRs are longer than previously described in the literature; 2) More than 77% of odorant receptor mRNAs are subject to alternative polyadenylation, hence generating at least 2 detectable 3'UTR isoforms; 3) Splicing events in 3'UTRs are restricted to a limited subset of odorant receptor genes; and 4) Comparison between male and female data shows no sex-specific differences in odorant receptor 3'UTR isoforms.

Conclusions: We demonstrated for the first time that odorant receptor genes are extensively subject to alternative polyadenylation. This ground-breaking change to the landscape of 3'UTR isoforms of Olfr mRNAs opens new avenues for investigating their respective functions, especially during the differentiation of olfactory sensory neurons.

Keywords: 3′ untranslated region; Adult olfactory mucosa; Alternative polyadenylation; IsoSCM; Odorant receptors; Olfactory sensory neuron; Olfr genes; mRNA isoforms.


Conflict of interest statement

The authors declare that they have no competing interests.

Figures

Fig. 1
Fig. 1
Comparison between available annotations for Olfr1507 and Olfr15 3’UTR isoforms and RNA-Seq raw data. a Upper panel. 3’UTRs from Ibarra-Soria et al. [26] RNA-Seq study (Dataset S6 in this paper). Center panel. 3’UTRs from Shum et al. [27] RNA-Seq study (File 013 Additional File 26 Table S3 in this paper). An alternative 3’UTR for Olfr15 due to 3′ length variation is mentioned (File 010 Additional File 3: Table S2 in [27]) but not described. Bottom panel. 3’UTRs in Ensembl release 89 [45].*: 3’UTRs deduced from RNA-Seq annotation (raw data in [26]) by the Havana project: ENSMUST00000206062.3 for Olfr1507; ENSMUST00000214590.1/ENSMUST00000214238.1 for Olfr15. Black vertical box: CDS end; black horizontal bar: 3’UTR. b Exon coverage, linear scale (top panel) and log scale (bottom panel), from olfactory mucosa RNA-Seq data of 3 adult male mice (male_IS2014, from [26]). Dashed lines indicate sustained drop of coverage that may be visually interpreted as 3′ ends; bold dashed lines indicate quantitatively major isoforms. Olfr1507 coverage suggests a short major 3’UTR isoform (S, previously described in a), and at least 2 additional minor 3’UTR isoforms with longer 3’UTRs (not described in a). Olfr15 coverage suggests 2 major 3’UTR isoforms (shorter than the 3’UTRs previously described in a), and a long minor 3’UTR isoform (L, previously described in a)
Fig. 2
Fig. 2
Computational pipeline for the characterization and analysis of Olfr 3’UTR isoforms from RNA-Seq datasets. The pipeline is divided into six steps: Step 1: RNA-Seq reads are mapped using STAR, and reference genome and annotation files. Step 2: A mask file in bed format, restricted to the Olfr loci in mouse, is generated. Step 3: The mask genome alignment output is obtained. Step 4: Full known and novel transcripts are reconstructed with IsoSCM or Cufflinks. Step 5: Reconstructed transcripts are characterized and analyzed in terms of annotation, 3’UTR isoforms identification, identification of predictive PASs at 3′ ends, merging (merge of 3’UTR isoforms from the same gene when 3′ ends are distant from less than 100 nt) and 3′ intron detection. Step 6: The relative abundances of the multiple 3’UTRs generated for the same Olfr gene are assessed by RNA-Seq quantification. Rectangles: input files or output files. Diamond shapes: bash shell and perl scripts.
Fig. 3
Fig. 3
New annotations for Olfr1507 and Olfr15 3’UTR isoforms and experimental validation. a RNA-Seq raw data (see Fig. 1B for legend). b 3’UTRs generated using our own Cufflinks analysis. c 3’UTRs identified using our dedicated workflow applied to the male_IS2014 dataset with the STAR and IsoSCM algorithms. S: short, M: medium, L: long; XL: extra-long. Black vertical box: CDS end; black horizontal bar: 3’UTR. d Relative abundance of the alternative 3’UTR isoforms annotated in silico using our IsoSCM pipeline. e In silico validation of the 3’UTRs annotated using our IsoSCM pipeline by the presence of canonical PASs. Vertical bar = predicted canonical (AAUAAA or AUUAAA) PAS. f Experimental validation by RL-PAT (RNA Ligation mediated PolyAdenylation Test, Table 1). ✔ = genuine polyA site. *: XL site for Olfr1507, M1 and L sites for Olfr15 could not be tested by RL-PAT due to repeat sequences upstream of the polyA sites. g and h Experimental validation by northern blot. Total OM RNAs were separated on agarose/formaldehyde gels and transferred onto nitrocellulose membranes. The presence of Olfr mRNAs was detected following hybridization with DIG-labeled antisense probes either in the CDS region (CDS probe) or between the 3′S and 3’M ends (3’M probe; see Table 3 for detailed probe description). g The major isoform of the Olfr1507 mRNA shows a short 3’UTR (≈3-kb dark band with CDS probe, not detected with 3’M probe); additional isoforms having longer 3’UTRs are present at low abundance (4.7 to 6.9-kb faint bands with both probes); ♯ highest band (> 7 kb) corresponds to an intron-retaining transcript for Olfr1507 (Additional File 4: Fig. S2). h Olfr15 shows 2 major isoforms, the first one with a short 3’UTR (≈2.5-kb band with CDS probe, not detected with 3’M probe = 3′S), and the second one with a longer 3’UTR (≈4.5-kb band with both probes = 3’M1/2).
Fig. 4
Fig. 4
A large majority of Olfr mRNAs shows multiple 3’UTR isoforms produced through alternative polyadenylation. The whole male_IS2104 dataset was analyzed using our IsoSCM pipeline. a Distribution of numbers of 3’UTR isoforms per Olfr. b Distribution of length for 3’UTR groups; sUTR = single 3’UTR for Olfr genes without APA (purple); pUTR = proximal 3’UTR isoform (dark green) and dUTR = distal 3’UTR isoform(s) (light green) for Olfr genes with APA. One-way Kruskal-Wallis test (Chi square = 430.62, p < 0.0001, df = 2), followed by Nemenyi test (* p < 0.05, *** p < 0.001). c Distribution of Olfr genes in 4 distinct quantitative 3’UTR isoform profiles. P1 = Olfr genes without APA (their mRNAs present a single 3’UTR), P2 = Olfr genes with APA, the proximal 3’UTR isoform representing more than 80% of the mRNAs (typically, the proximal 3’UTR is the major isoform); P3 = Olfr genes with APA, the proximal 3’UTR isoform representing less than 80% and the sum of the most distal isoforms (dUTR2 to dUTR4) less than 10% (typically, the pUTR and dUTR1 are the main isoforms); P4 = Olfr genes with APA, the proximal 3’UTR isoform representing less than 80% and the sum of the most distal isoforms (dUTR2 to dUTR4) more than 10% (typically, these Olfr genes have 3 or more isoforms of quantitative importance). Typical examples for these 4 quantitative profiles are shown in the right panel
Fig. 5
Fig. 5
New annotations for Olfr1508 and Olfr1509 3’UTR isoforms and experimental validation. a RNA-Seq raw data within a 11.7-kb region comprising both Olfr1508 and Olf1509 3’UTRs (see Fig. 1b for legend). Junction coverage is shown for the Olfr1508 strand. b 3’UTRs identified using our IsoSCM pipeline processing the male_IS2014 dataset. Black vertical box: CDS end; black horizontal bar: 3’UTR. c In silico validation of the 3’UTRs annotated using our IsoSCM pipeline by the presence of canonical PASs. Vertical bar = predicted canonical (AAUAAA or AUUAAA) PAS. d Experimental validation by RL-PAT. ✔ = genuine polyA site. The optional splicing in the 3’M of Olfr1508 has been confirmed by 3’RACE (3′ Rapid Amplification of cDNA ends). S: short, M: medium
Fig. 6
Fig. 6
Class I and Class II Olfr mRNAs show similar patterns of alternative polyadenylation. a Distribution of numbers of 3’UTR isoforms per Olfr. b Comparison between Class I and Class II Olfr genes’ distribution of length for 3’UTR groups. Mann–Whitney test (ns p > 0.05). See Fig. 4 for the definition of the groups. c Distribution of Olfr genes in 4 distinct quantitative 3’UTR isoform profiles. See Fig. 4 for the definition of the profiles. A Fisher-Freeman-Halton exact test shows no significant difference (p = 0.76)
Fig. 7
Fig. 7
Comparison of the Olfr 3’UTR annotations between 4 datasets from adult olfactory mucosa. The male_IS2104, female_IS2014, male_IS2017 and female_IS2017 datasets were analyzed using our IsoSCM pipeline. a Distribution of numbers of 3’UTR isoforms per Olfr. A Fisher-Freeman-Halton exact test shows no significant difference (p = 0.75). b Distribution of sUTR, pUTR and dUTR lengths. The length of sUTRs (left panel) does not appear statistically different between the 4 datasets (two-way ANOVA: experiment effect, F(1, 656) = 2.45, p > 0.05; sex effect, F(1, 656) = 0.88, p > 0.05; no interaction). Whereas the length of pUTRs (middle panel) is significantly lower in the 2017 experiment as compared to the 2014 one (two-way ANOVA: experiment effect, F(1, 2253) = 5.34, p = 0.03; sex effect, F(1, 2253) = 0.18, p > 0.05; no interaction), this difference falls into the 200-nt uncertainty window and may thus not reflect a genuine difference between these 2 experiments. The length of dUTRs (right panel) is statistically different between the 4 datasets (two-way ANOVA: experiment effect, F(1, 3319) = 17.38, p < 0.001; sex effect, F(1, 3319) = 3.06, p > 0.05; no interaction). c Distribution of Olfr genes in 4 distinct quantitative 3’UTR isoform profiles. See Fig. 4 for the definition of the profiles. A Fisher-Freeman-Halton exact test shows no significant difference (p = 0.37)

Similar articles

Cited by

References

    1. Shepherd GM. The olfactory glomerulus: its significance for sensory processing. In: Katsuki Y, Norgren R, Sato M, editors. Brain mechanisms of sensation. New York: Wiley; 1981. pp. 209–223.
    1. Buck L, Axel R. A novel multigene family may encode odorant receptors: a molecular basis for odor recognition. Cell. 1991;65:175–187. - PubMed
    1. Niimura Y. Olfactory receptor multigene family in vertebrates: from the viewpoint of evolutionary genomics. Curr Genomics. 2012;13:103–114. - PMC - PubMed
    1. Niimura Y, Matsui A, Touhara K. Extreme expansion of the olfactory receptor gene repertoire in African elephants and evolutionary dynamics of orthologous gene groups in 13 placental mammals. Genome Res. 2014;24:1485–1496. - PMC - PubMed
    1. Chess A, Simon I, Cedar H, Axel R. Allelic inactivation regulates olfactory receptor gene expression. Cell. 1994;78:823–834. - PubMed

LinkOut - more resources