

Hand fracture epidemiology and etiology in children-time trends in Malmö, Sweden, during six decades
- PMID: 31299998
- PMCID: PMC6626361
- DOI: 10.1186/s13018-019-1248-0
Hand fracture epidemiology and etiology in children-time trends in Malmö, Sweden, during six decades
Abstract
Background: The aim of this study was to describe hand fracture epidemiology/etiology in city children and describe time trend during six decades.
Patients and methods: A single hospital serves the entire city population of 271,271 (year 2005). Through the hospital medical and radiological archives, we collected epidemiology and etiology data concerning pediatric (age < 16 years) hand fractures in city residents, treated during 2005-2006. We compared these data to previously collected data in in the same city during 12 evaluated periods from 1950/1955 to 1993-1994. We present period-specific crude and age- and gender-adjusted fracture incidence rates and group differences as incidence rate ratios (RR) with 95% confidence intervals (95% CI).
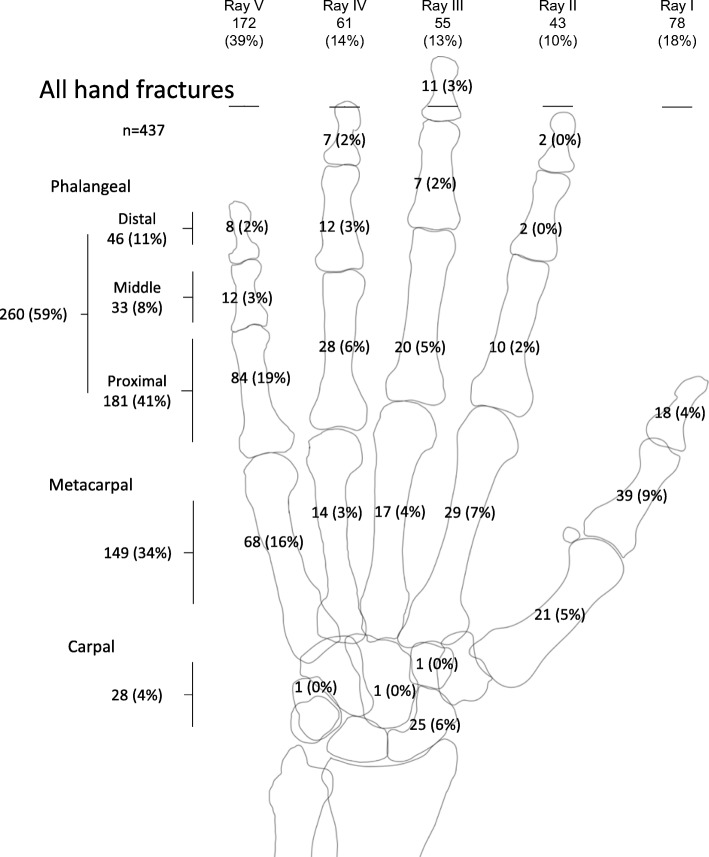
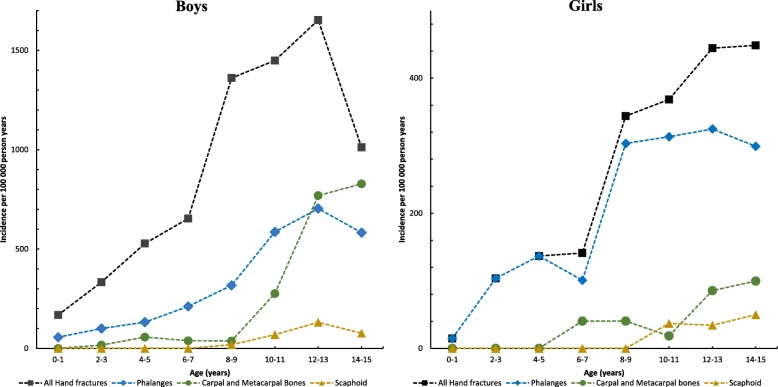
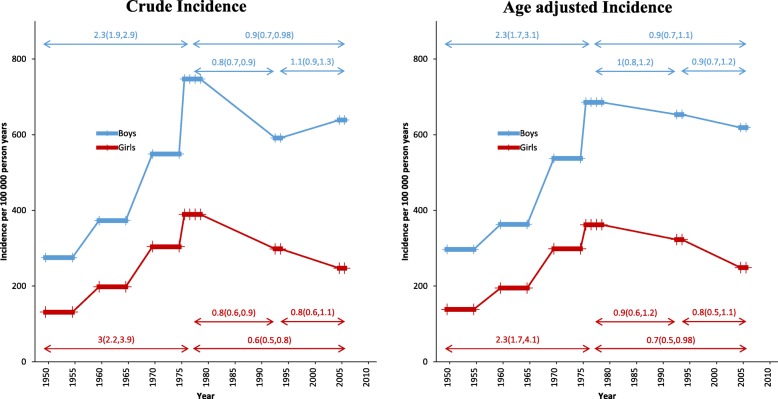
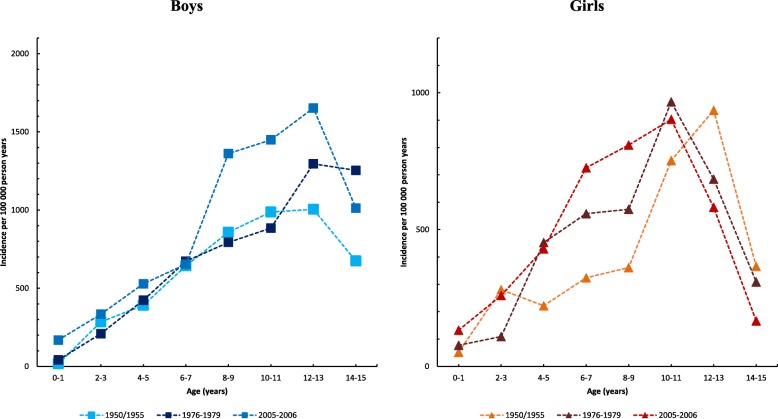
Results: In 2005-2006, we identified 414 hand fractures (303 in boys and 111 in girls), 247 phalangeal fractures (60% of all hand fractures), 140 metacarpal/carpal fractures (except the scaphoid bone) (34%), and 27 scaphoid fractures (6%). The crude hand fracture rate in children was 448/100,000 person years (639/100,000 in boys and 247/100,000 in girls), with a 2.5 times higher age-adjusted incidence in boys than in girls. Compared to 1950/1955, the age and gender-adjusted hand fracture incidence was twice as high in 2005-2006 and more than twice as high in 1976-1979. Compared to 1976-1979, we found no significant difference in the age and gender-adjusted hand fracture incidence in 2005-2006. In 2005-2006, sports injuries explained 42%, fights 20%, and traffic accidents 13% of the hand fractures. In 1950/1955, sports injuries explained 27% of fractures, fights 10%, and traffic accidents 21%.
Conclusions: The incidence of hand fractures in children was more than twice as high in the end of the 1970s compared to the 1950s, where after no significant change could be found. Also, fracture etiology has changed. New studies are needed, to adequately allocate health care resources and identify new fracture prone activities suitable for preventive measures.
Level of evidence: III.
Keywords: Boy; Epidemiology; Fractures; Girl; Time trends.
Conflict of interest statement
The authors declare that they have no competing interests.
Figures
Similar articles
-
Time trends in pediatric hand fracture incidence in Malmö, Sweden, 1950-2016.J Orthop Surg Res. 2021 Apr 9;16(1):245. doi: 10.1186/s13018-021-02380-y. J Orthop Surg Res. 2021. PMID: 33836797 Free PMC article.
-
Pediatric Distal Forearm Fracture Epidemiology in Malmö, Sweden-Time Trends During Six Decades.J Wrist Surg. 2019 Dec;8(6):463-469. doi: 10.1055/s-0039-1692471. Epub 2019 Jul 12. J Wrist Surg. 2019. PMID: 31815060 Free PMC article.
-
Time trends in pediatric fracture incidence in Sweden during the period 1950-2006.Acta Orthop. 2017 Aug;88(4):440-445. doi: 10.1080/17453674.2017.1334284. Epub 2017 May 31. Acta Orthop. 2017. PMID: 28562146 Free PMC article.
-
Paediatric pelvic fractures: A review of 2 cohorts over 22 years.Injury. 2018 Mar;49(3):613-617. doi: 10.1016/j.injury.2018.02.005. Epub 2018 Feb 11. Injury. 2018. PMID: 29448991 Review.
-
A prospective study of pediatric hand fractures and review of the literature.Pediatr Emerg Care. 2014 May;30(5):299-304. doi: 10.1097/PEC.0000000000000118. Pediatr Emerg Care. 2014. PMID: 24759492 Review.
Cited by
-
Traffic Accidents in Children and Adolescents: A Complex Orthopedic and Medico-Legal Approach.Children (Basel). 2023 Aug 24;10(9):1446. doi: 10.3390/children10091446. Children (Basel). 2023. PMID: 37761407 Free PMC article. Review.
-
Frequency, Pattern, and Treatment of Hand Fractures in Children and Adolescents: A 27-Year Review of 4356 Pediatric Hand Fractures.Hand (N Y). 2022 Jan;17(1):92-97. doi: 10.1177/1558944719900565. Epub 2020 Feb 10. Hand (N Y). 2022. PMID: 32036680 Free PMC article. Review.
-
Mapping of Orthopaedic Fractures for Optimal Surgical Guidance.Adv Exp Med Biol. 2023;1392:43-59. doi: 10.1007/978-3-031-13021-2_3. Adv Exp Med Biol. 2023. PMID: 36460845
-
Pin vs plate fixation for metacarpal fractures: a meta-analysis.J Orthop Surg Res. 2020 Nov 19;15(1):542. doi: 10.1186/s13018-020-02057-y. J Orthop Surg Res. 2020. PMID: 33213480 Free PMC article.
-
Streamlining the Management of Children with Simple Hand Injuries.Plast Surg (Oakv). 2024 Apr 28;33(3):442-448. doi: 10.1177/22925503241249755. eCollection 2025 Aug. Plast Surg (Oakv). 2024. PMID: 39553517 Free PMC article.
References
MeSH terms
Grants and funding
LinkOut - more resources
Full Text Sources
Medical
Research Materials
