Comparative Study
. 2019 Jul 12;20(1):136.
doi: 10.1186/s13059-019-1744-x.

Frequent intra- and inter-species introgression shapes the landscape of genetic variation in bread wheat

Affiliations
Comparative Study

Frequent intra- and inter-species introgression shapes the landscape of genetic variation in bread wheat

Hong Cheng et al. Genome Biol. .

Abstract

Background: Bread wheat is one of the most important and broadly studied crops. However, due to the complexity of its genome and incomplete genome collection of wild populations, the bread wheat genome landscape and domestication history remain elusive.

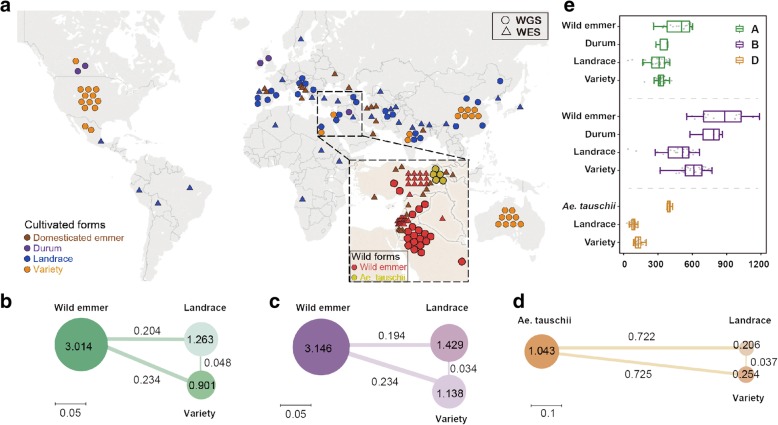
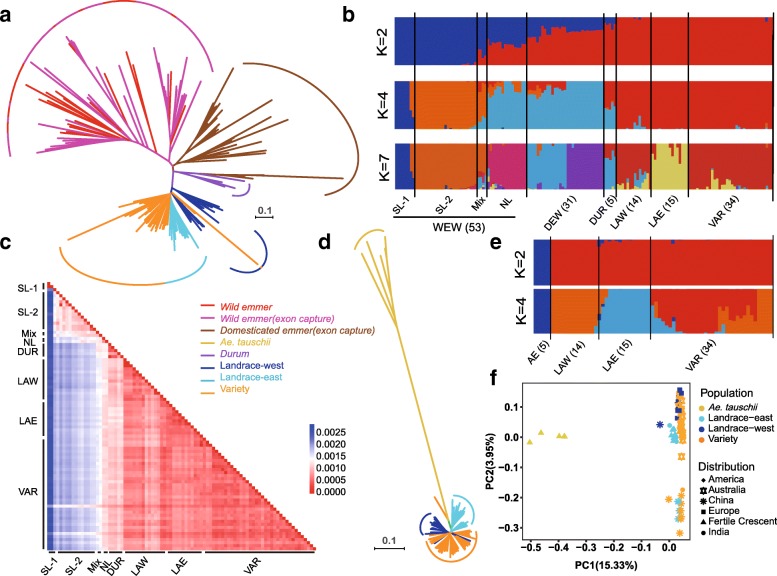
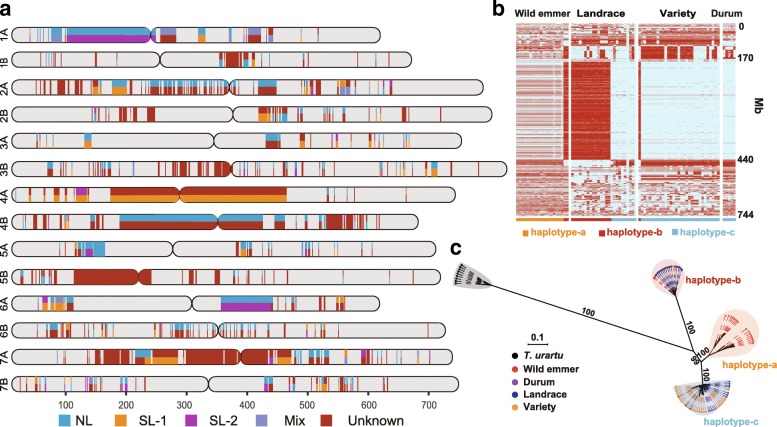
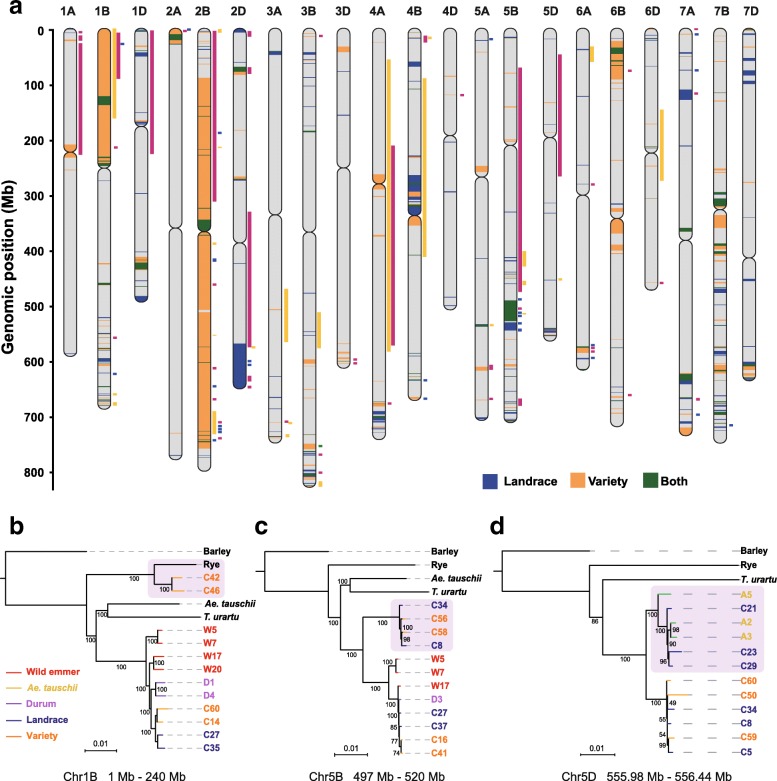
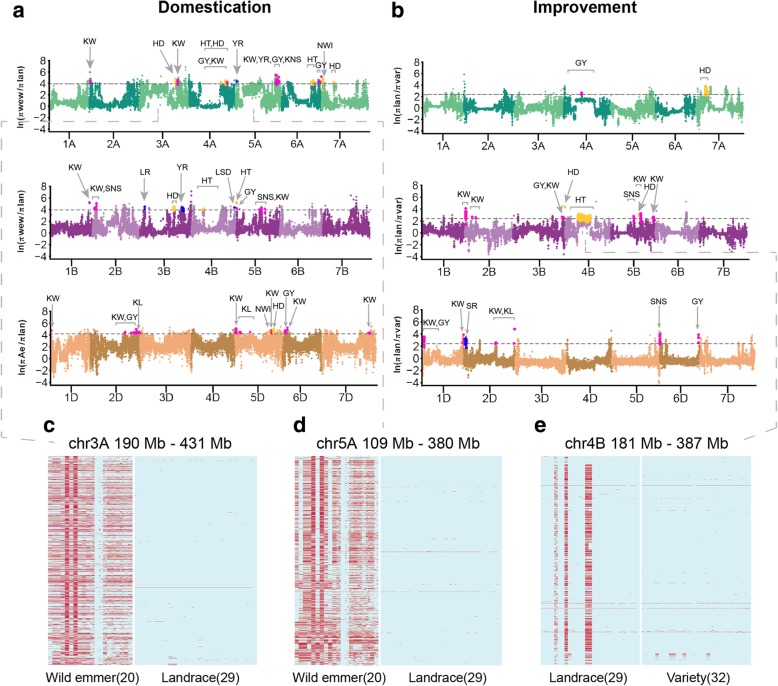
Results: By investigating the whole-genome resequencing data of 93 accessions from worldwide populations of bread wheat and its diploid and tetraploid progenitors, together with 90 published exome-capture data, we find that the B subgenome has more variations than A and D subgenomes, including SNPs and deletions. Population genetics analyses support a monophyletic origin of domesticated wheat from wild emmer in northern Levant, with substantial introgressed genomic fragments from southern Levant. Southern Levant contributes more than 676 Mb in AB subgenomes and enriched in the pericentromeric regions. The AB subgenome introgression happens at the early stage of wheat speciation and partially contributes to their greater genetic diversity. Furthermore, we detect massive alien introgressions that originated from distant species through natural and artificial hybridizations, resulting in the reintroduction of ~ 709 Mb and ~ 1577 Mb sequences into bread wheat landraces and varieties, respectively. A large fraction of these intra- and inter-introgression fragments are associated with quantitative trait loci of important traits, and selection events are also identified.

Conclusion: We reveal the significance of multiple introgressions from distant wild populations and alien species in shaping the genetic components of bread wheat, and provide important resources and new perspectives for future wheat breeding.

Keywords: Bread wheat; Genetic diversity; Haplotype; Introgression; Selection.


Conflict of interest statement

The authors declare that they have no competing interests.

Figures

Fig. 1
Fig. 1
Geographic distribution and population diversity of wheat accessions. a Schematic geographical distribution of the collection sites for 93 whole-genome sequencing (WGS) accessions and 92 whole-exome sequencing (WES) accessions. The locations of wild progenitors of bread wheat are shown in the inset. bd Nucleotide diversity and population divergence across the wild progenitor, landraces, and varieties among the A subgenome, B subgenome, and D subgenome. The circle size and the value in each circle represent nucleotide diversity (π × 103), and the length of the line indicates divergence (Fst) among the populations. e The length of the deleted CNVs in divergent populations. The deleted CNVs were identified using the IWGSC RefSeq v1.0. The B subgenome contains more deleted CNVs in length than the A and D subgenomes in the wild emmer, landrace, and variety
Fig. 2
Fig. 2
Phylogenetic relationships and population structures. a The NJ tree was built with 1000 bootstraps using a total of 312,952 overlapping SNPs with exome capture data. Branch colors reflect different populations. Accessions are arranged according to the populations and their geographic locations. b Population structure of the 152 wheat accessions on AB subgenomes, including wild emmer (WEW), domesticated emmer (DEW), durum (DUM), landrace-west (LAW), landrace-east (LAE), variety (VAR). c Nucleotide distance (dxy) between each pairwise of wheat accessions by whole-genome resequencing. d NJ tree of 68 whole-genome resequencing accessions on the D subgenome. The tree was built using the 1,879,923 SNPs located in the genic region. e Population structure of the 68 wheat accessions on the D subgenome. f PCA plots of the first two components of 68 wheat accessions. The color and shape of dots separately indicate the population and location
Fig. 3
Fig. 3
Segmental ancestry inference of present-day bread wheat. a The distributions of long haploblocks with haplotype diversity along the AB subgenomes of bread wheat. The origins of haplotypes are shown in different colors. Segmental ancestry derived from the four populations of wild emmer, NL, SL-1, SL-2, and mix. b Haplotype patterns of chromosome 4A in diverse populations. Each column is an accession, each row is a phased haplotype. The haplotypes were constructed for each accession using all the SNPs on chromosome 4A. Alleles that are identical to or different from the ones in the IWGSC RefSeq v1.0 reference genome are indicated by blue and red, respectively. c ML tree of the longest haplotypes on chromosome 4A from ~ 170 to 440 Mb. All the accessions clustered into three groups corresponding to three distinct haplotypes in b
Fig. 4
Fig. 4
Genome-wide introgressions from wild relatives into landraces and varieties. a Map of the lengths and distributions of all the putative introgressed segments on 21 chromosomes. Introgression regions in different populations are distinguished by the color: blue for landrace, orange for variety, and green for the introgressed segments shared between landrace and variety. The length of these columns indicates the actual length of the introgression segments. Previously mapped QTLs overlapped with introgression regions are indicated to the right side of the chromosomes by colored rectangles, magenta for QTLs related to yield, blue for QTLs associated with disease resistance, and yellow for QTLs related to development. The QTLs indicate references and confidence intervals are provided in Additional file 4: Table S9. b ML tree of the 1B/1R region on the chromosome 1B of the IWGSC RefSeq 1.0 from 0 to approximately 240 Mb using sequences of each individual. C42 and C46 clustered with rye. c ML tree of the 23 Mb introgression fragment on chromosome 5B. Several bread wheat accessions clustered in a clade, segregating from all wild emmer accessions. d ML tree of a 0.45-Mb fragment on chromosome 5D introgressed from Ae. tauschii. This fragment was shared in six landrace accessions. Trees constructed by all accessions are provided in Additional file 1: Figures S21, S29, and S31
Fig. 5
Fig. 5
Genome-wide selective signals during domestication and improvement. Whole-genome screening of selective signals during domestication (a) and improvement (b). The ln π ratio values are plotted against the position on each of the 21 chromosomes. The horizontal gray dashed lines show the genome-wide threshold for selective sweeps, ln πwild emmer/πlandrace > 3.95, ln πAe. auschii/πlandrace > 4.29, and ln πlandrace/πvariety > 2.41. The previous reported QTLs that overlap with selection signals are highlighted with points in different colors, magenta for QTLs related to yield, blue for QTLs associated with disease resistance, and yellow for development related. All the windows overlapped with QTLs, and the QTLs indicate references and confidence intervals are provided in Additional file 9: Tables S15 and Additional file 10: S16. ce The patterns of SNPs of the large regions with long stretches of elevated π ratio on chromosomes 3A, 5A, and 4B. Each column is an accession, and each row is an SNP site. Different colors donate the genotypes of SNPs, light blue for reference homozygous sites and red for homozygous non-reference sites

References

    1. Jared D. Evolution, consequences and future of plant and animal domestication. Nature. 2002;418(6898):700–707. - PubMed
    1. Kilian B, et al. Independent wheat B and G genome origins in outcrossing Aegilops progenitor haplotypes. Mol Biol Evol. 2006;24(1):217–227. - PubMed
    1. Tanno K-I, Willcox G. How fast was wild wheat domesticated? Science. 2006;311(5769):1886. - PubMed
    1. Luo MC, et al. The structure of wild and domesticated emmer wheat populations, gene flow between them, and the site of emmer domestication. Theor Appl Genet. 2007;114(6):947–959. - PubMed
    1. Cavanagh CR, et al. Genome-wide comparative diversity uncovers multiple targets of selection for improvement in hexaploid wheat landraces and cultivars. Proc Natl Acad Sci U S A. 2013;110(20):8057–8062. - PMC - PubMed

Publication types

LinkOut - more resources