Review
. 2019 Jul;39(4):316-327.
doi: 10.1016/j.semnephrol.2019.04.002.

Acid-Base Basics

Affiliations
Review

Acid-Base Basics

Michael F Romero et al. Semin Nephrol. 2019 Jul.

Erratum in

Abstract

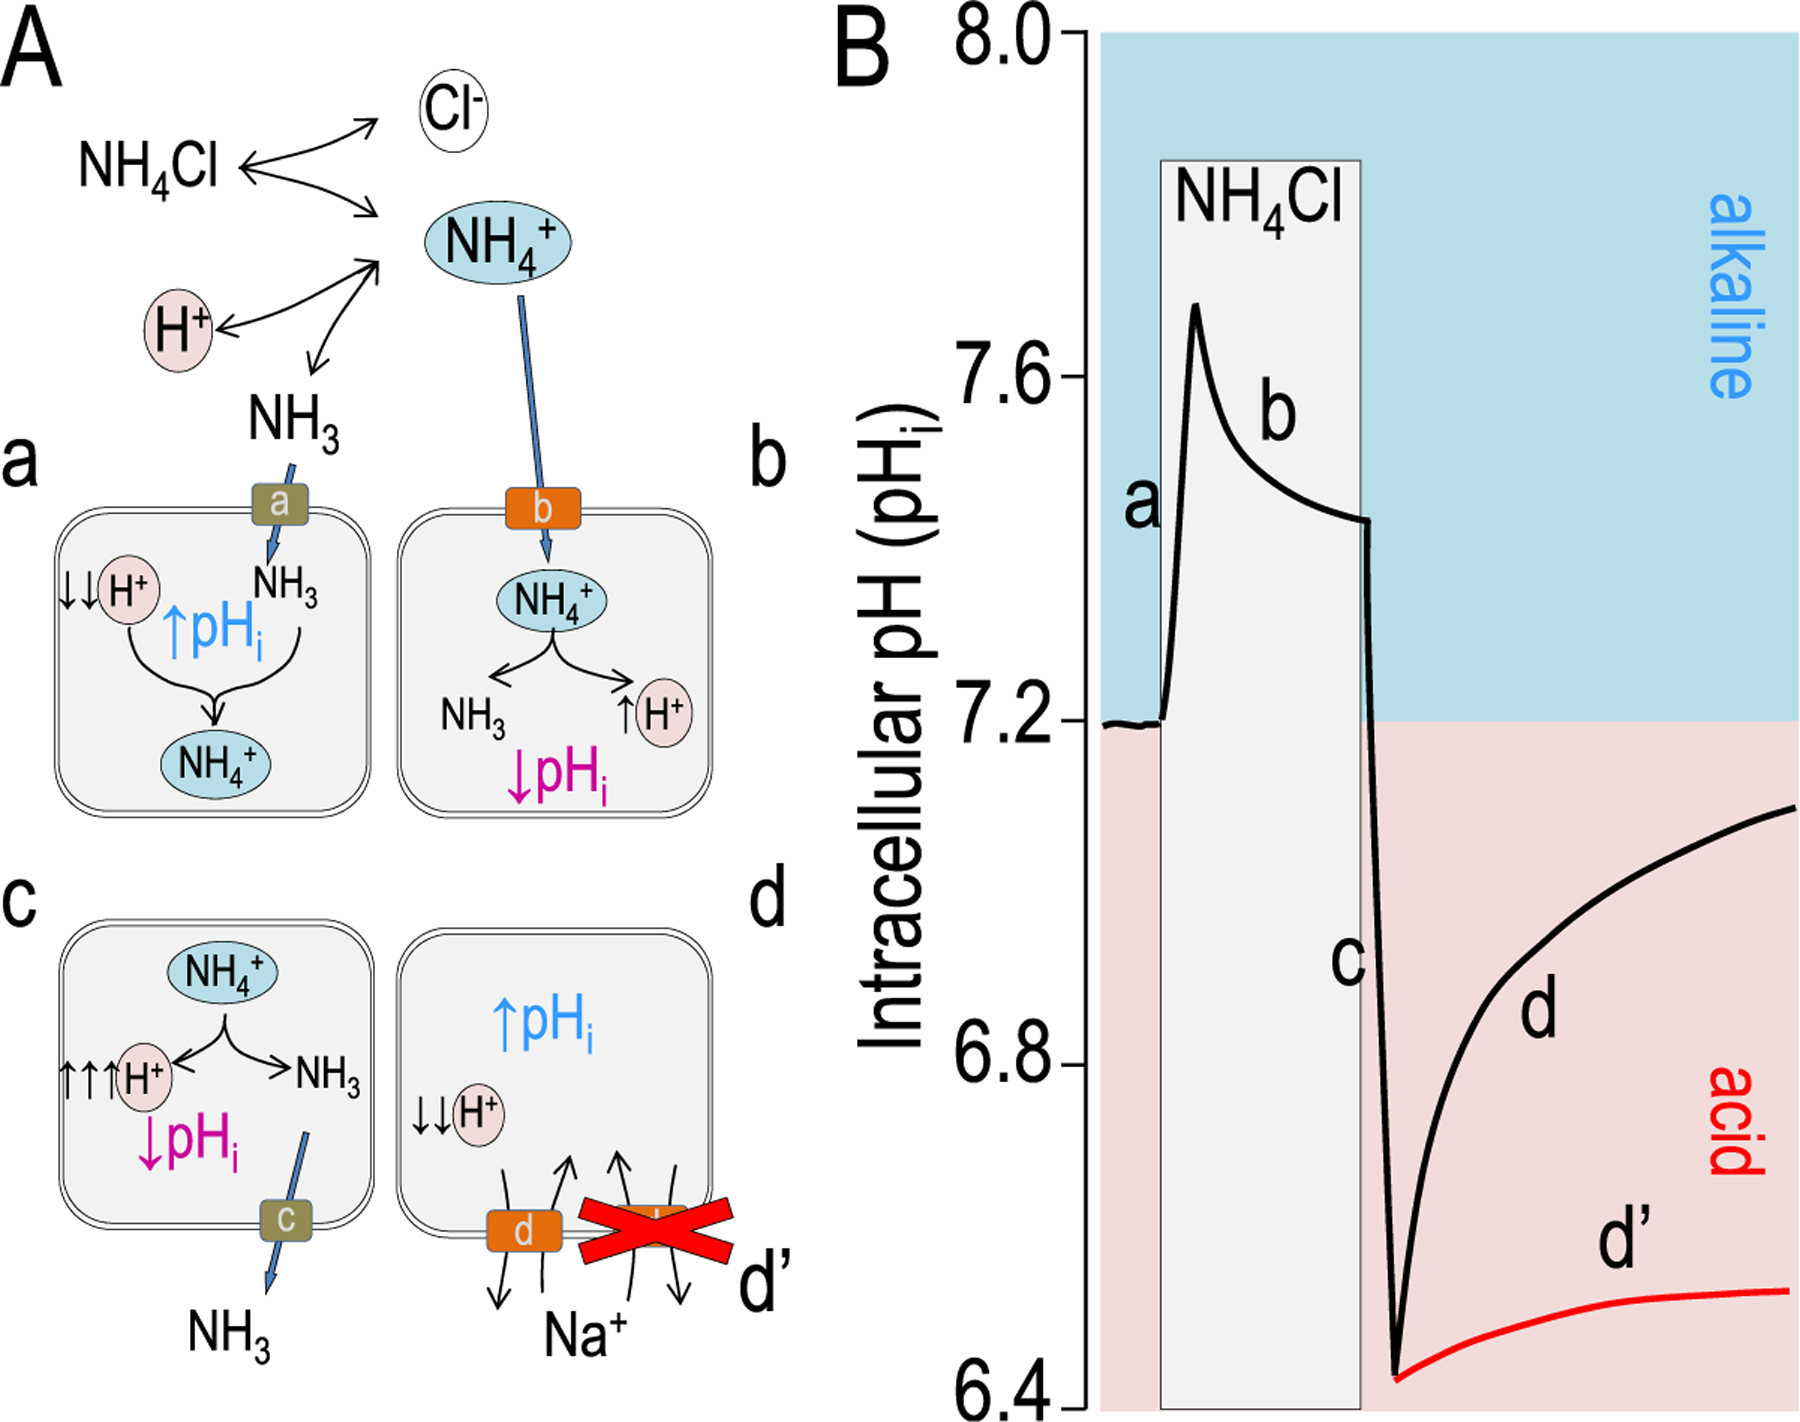
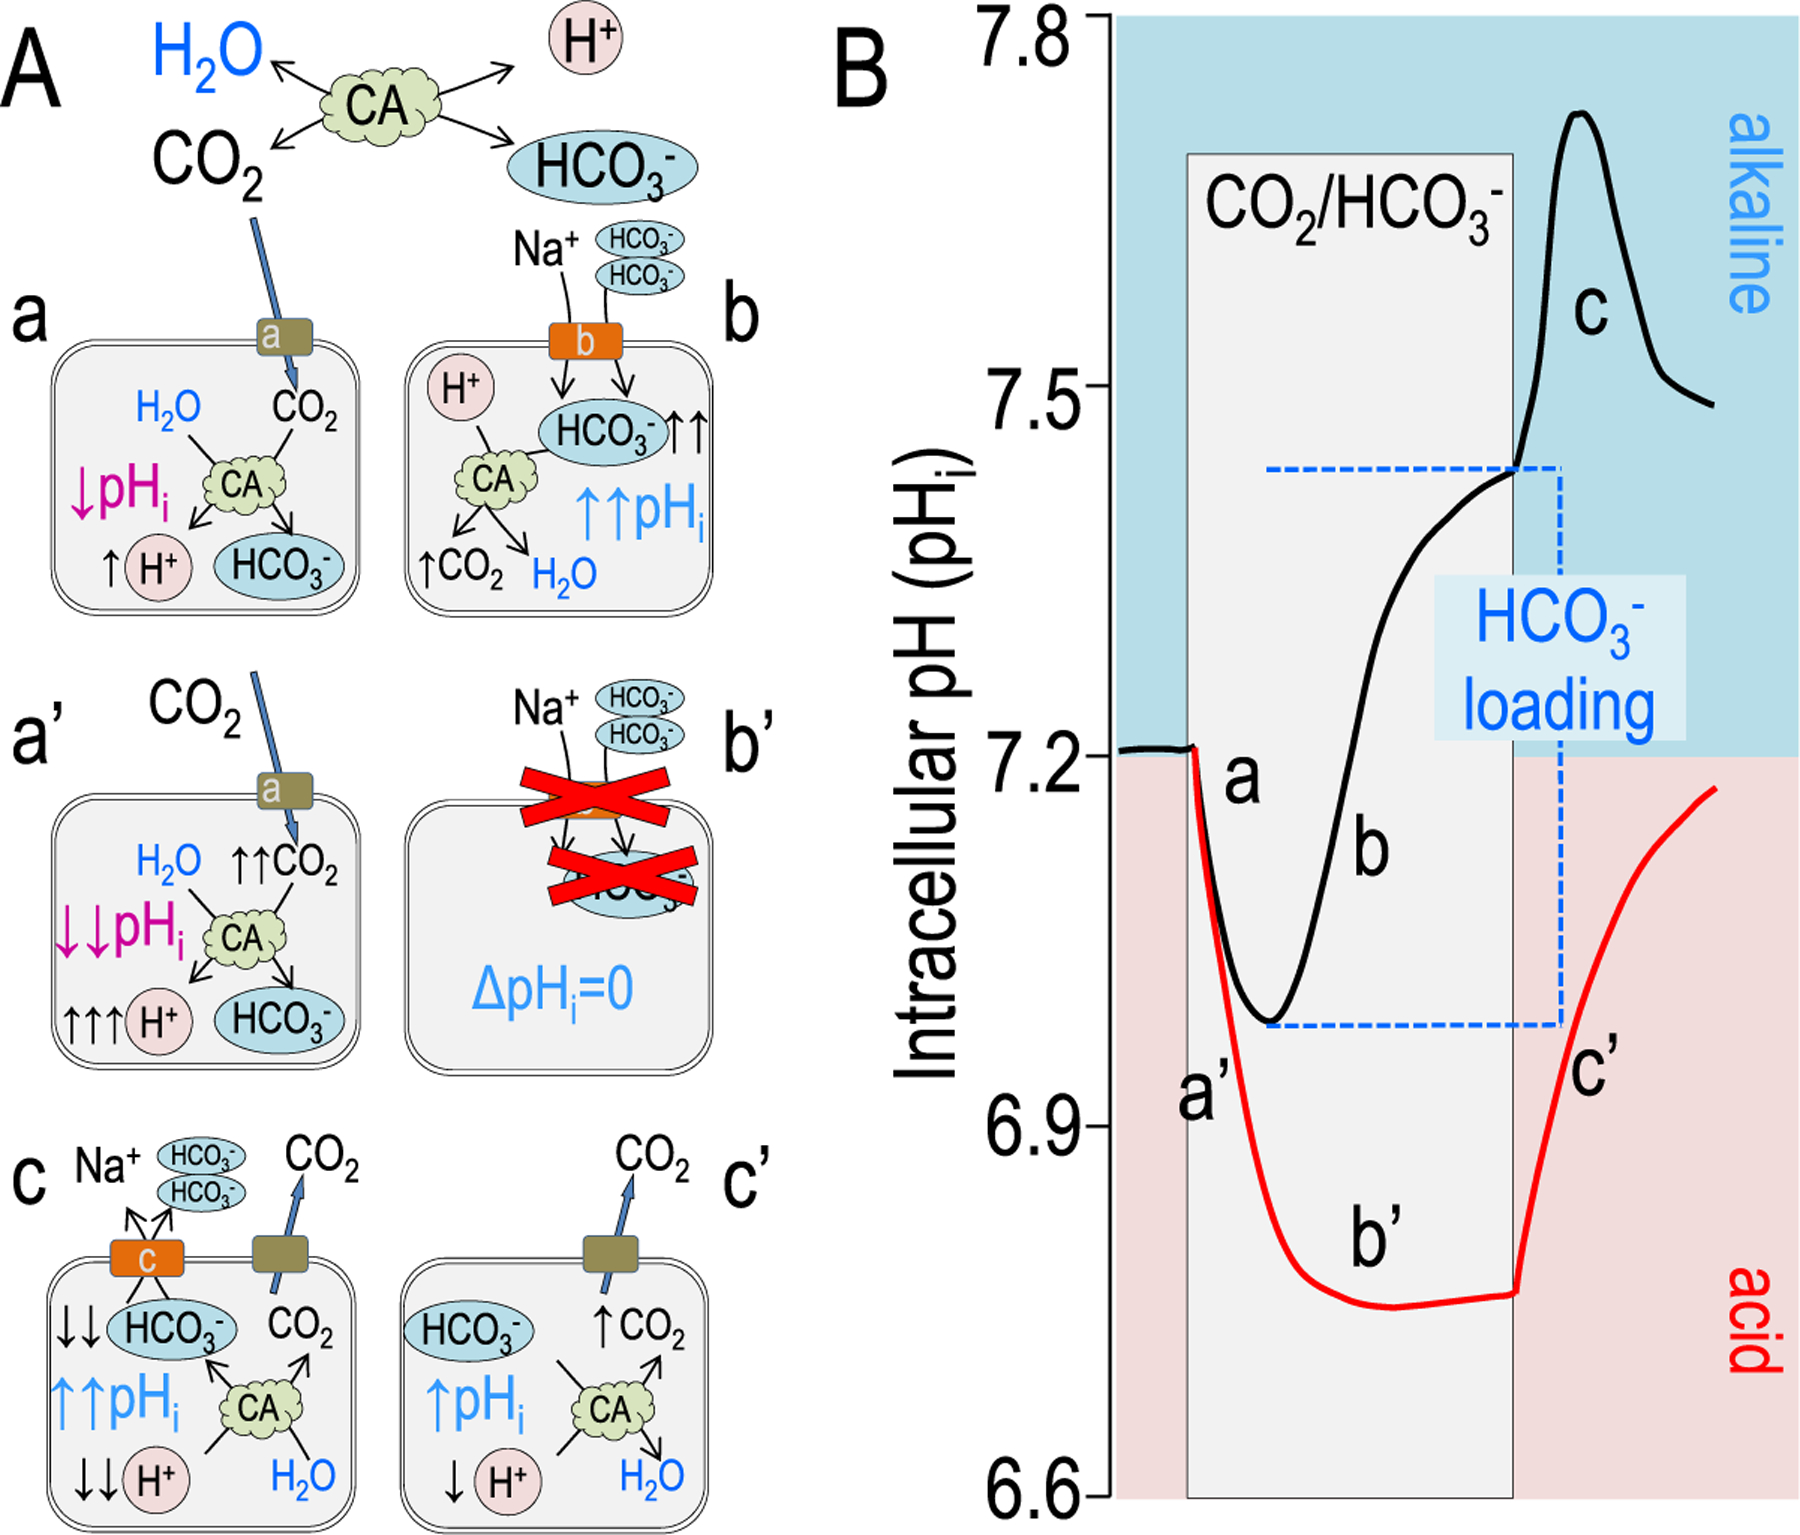
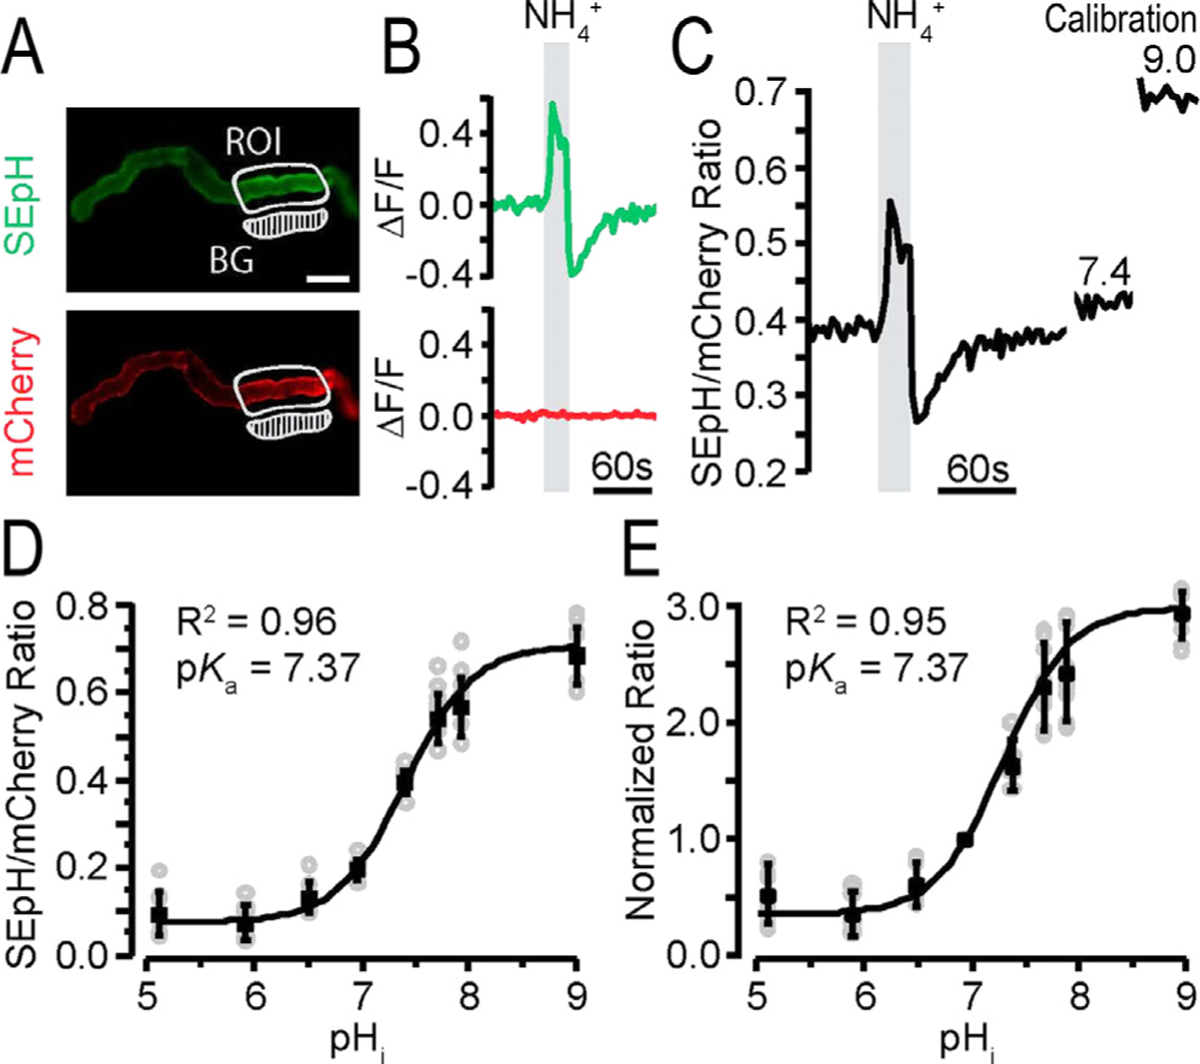
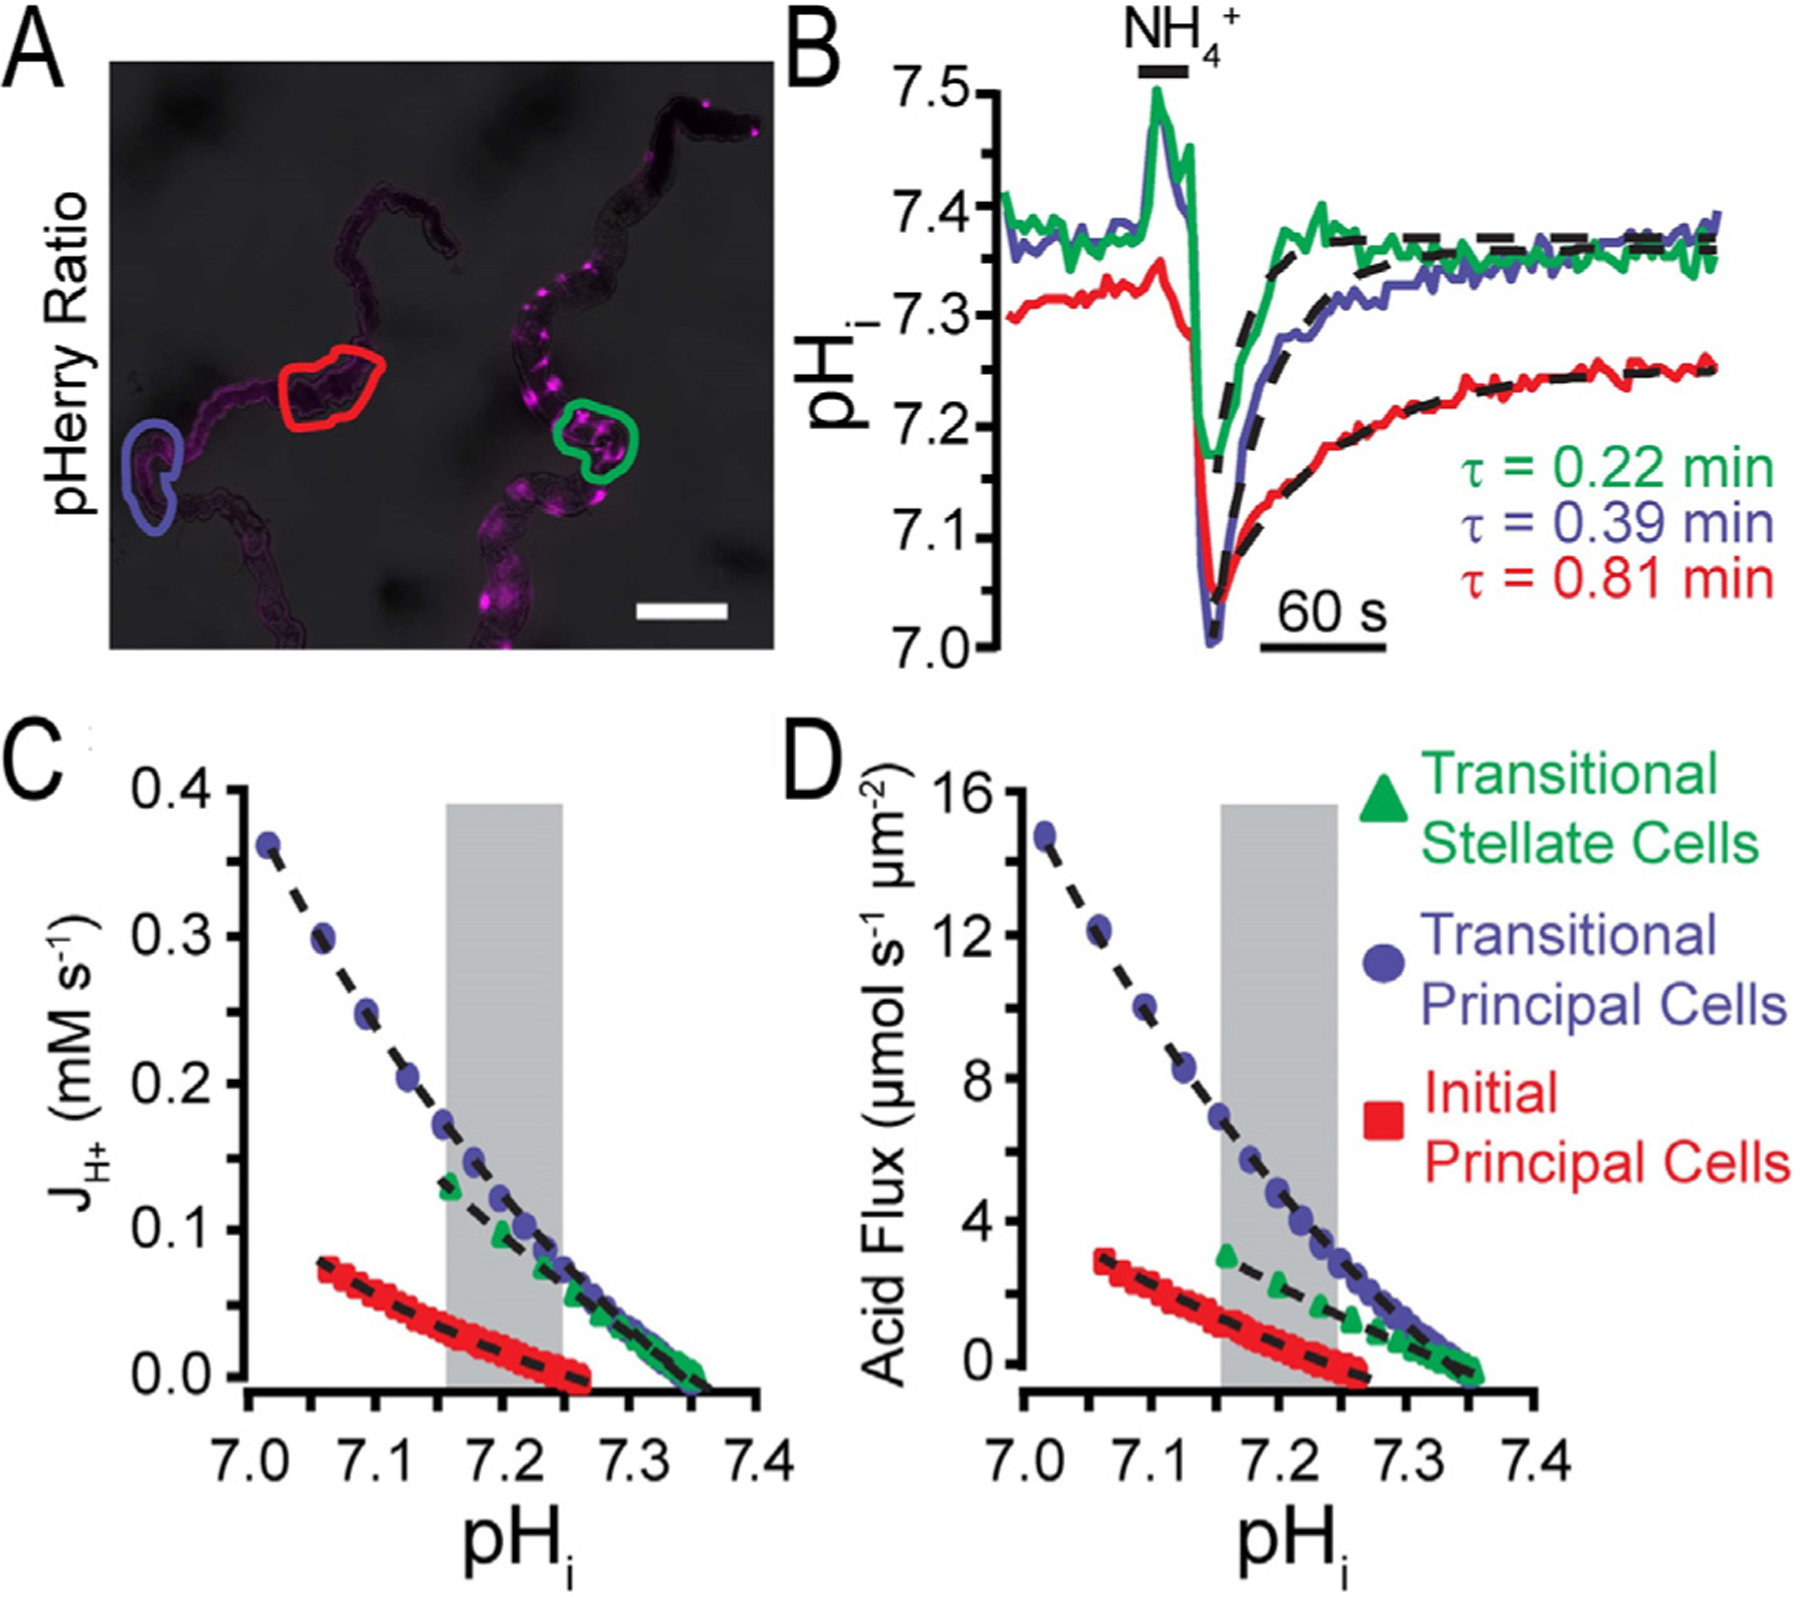
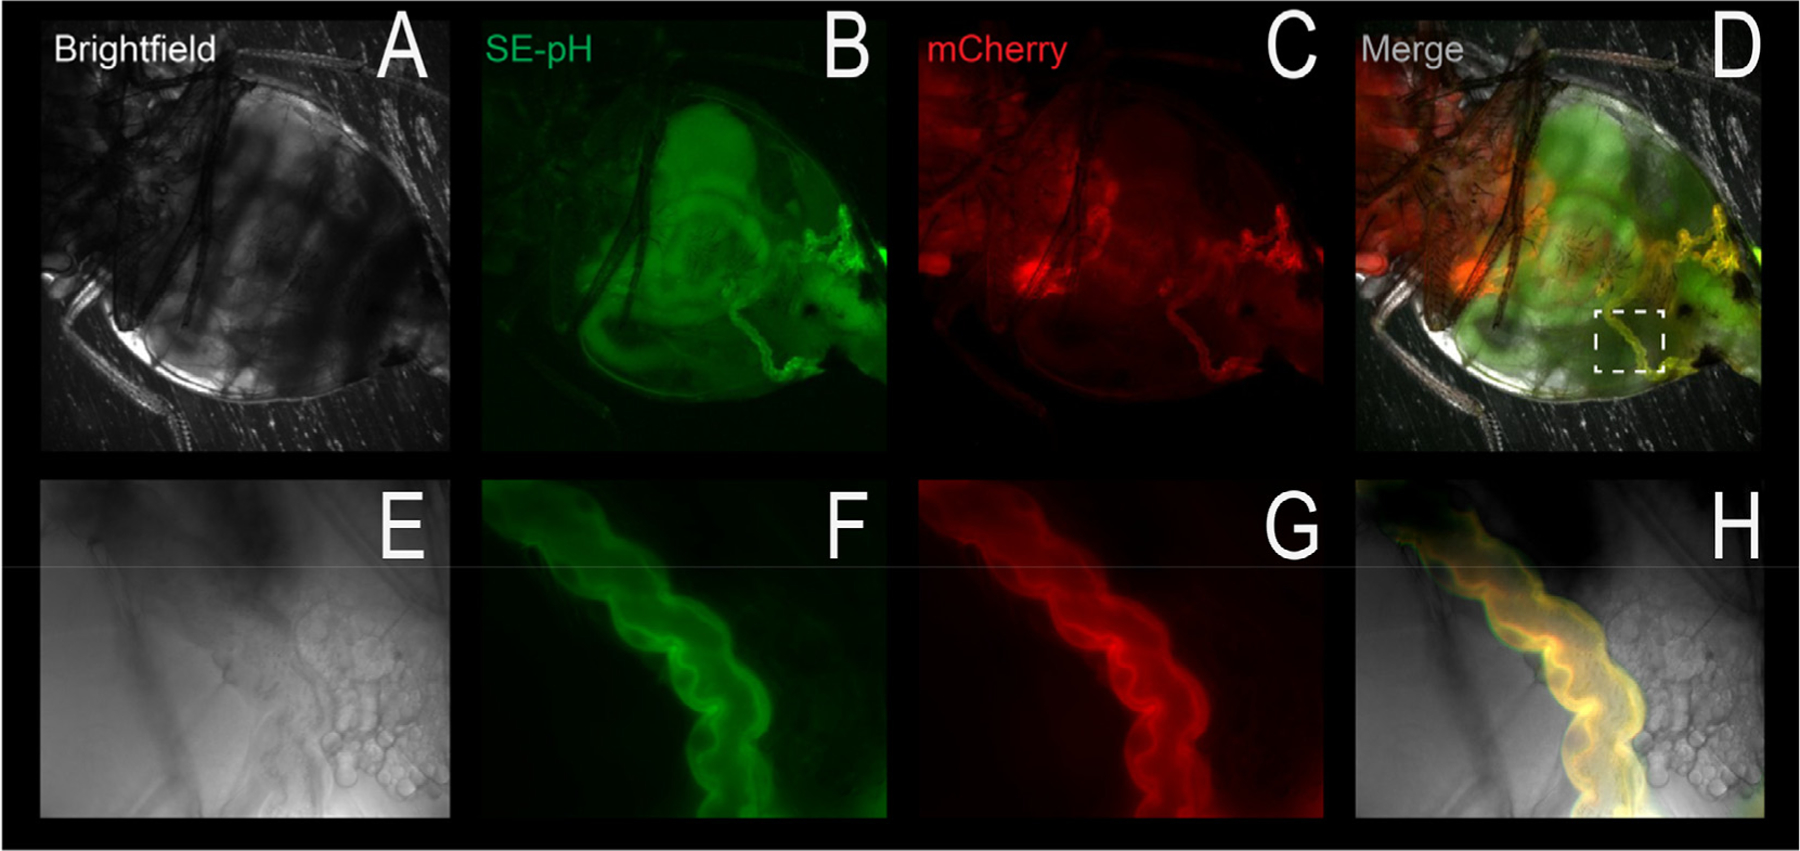
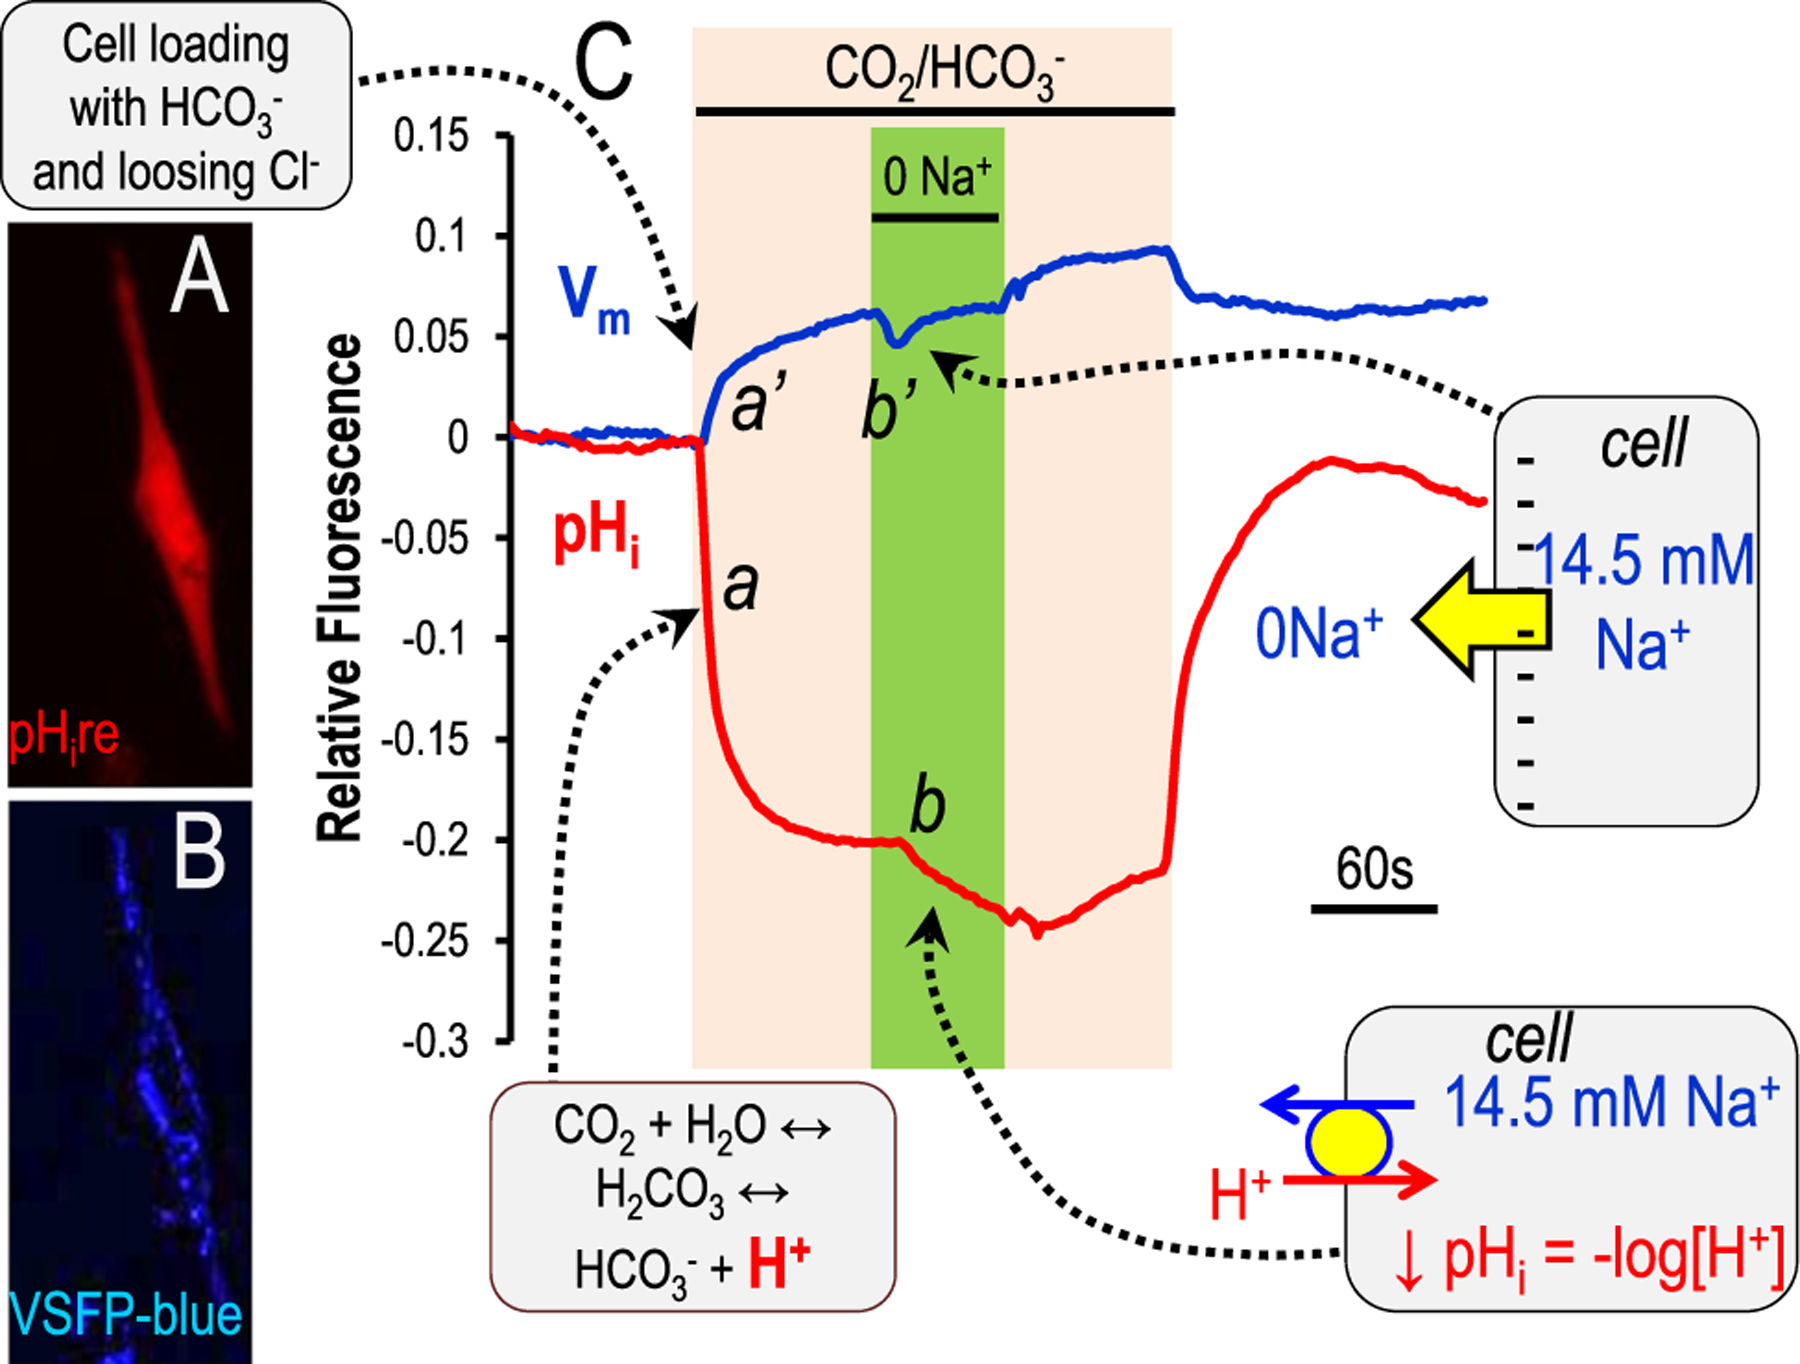
Although students initially learn of ionic buffering in basic chemistry, buffering and acid-base transport in biology often is relegated to specialized classes, discussions, or situations. That said, for physiology, nephrology, pulmonology, and anesthesiology, these basic principles often are critically important for mechanistic understanding, medical treatments, and assessing therapy effectiveness. This short introductory perspective focuses on basic chemistry and transport of buffers and acid-base equivalents, provides an outline of basic science acid-base concepts, tools used to monitor intracellular pH, model cellular responses to pH buffer changes, and the more recent development and use of genetically encoded pH-indicators. Examples of newer genetically encoded pH-indicators (pHerry and pHire) are provided, and their use for in vitro, ex vivo, and in vivo experiments are described. The continued use and development of these basic tools provide increasing opportunities for both basic and potentially clinical investigations.

Keywords: CO(2)/HCO(3)(-) buffering; GEpHI; Intracellular pH; ammonium pulse; genetically encoded pH indicator; pH buffering.


Conflict of interest statement

Conflict of interest statement: M.F.R. is employed by the Mayo Clinic Foundation and has received federal funding to support this area of research.

Figures

Figure 1.
Figure 1.
Model intracellular pH (pHi) responses to an ammonium prepulse. (A) Chemical and cellular models illustrating the buffering reaction of ammonium dissociation and reassociation [NH4+ ↔ NH3 + H+] as discussed in the text. Cellular models indicate the cellular chemistry and transport involved at each of the curve phases indicated in panel B. (B) A model experiment measuring pHi is shown. The red line denotes an acid recovery in which there is either no transporter, an inactive transport, or an inhibited transporter.
Figure 2.
Figure 2.
Model pHi responses form the addition of CO2/HCO3. (A) Chemical and cellular models showing the buffering reaction of CO2 hydration and dehydration in the presence of a carbonic anhydrase: [CO2 + H2O ↔ HCO3 + H+] as discussed in the text. Cellular models indicate the cellular chemistry and transport involved at each of the curve phases indicated in panel B. (B) A model experiment measuring pHi is shown with the acute addition of 5% CO2/33 mmol/L HCO3 (pH 7.5). The red line denotes an acid recovery in which there is either no transporter, an inactive transport, or an inhibited transporter. Note that in the red trace (a’), pHi decreases more quickly and to a more acidic pHi because there is little cellular buffering. Similarly, without cellular HCO3 or H+ transport, there is no pHi recovery (b’) (ie, alkalinization). Removal of CO2/HCO3 returns pHi to almost the initial pre-CO2 pHi.
Figure 3.
Figure 3.
Intracellular pH (pHi) response of pHerry with NH4Cl pulse in renal epithelia. pHerry is a genetically encoded and ratiometric pH sensor expressed in anterior Malpighian tubules (MTs) of Drosophila. (A) Fluorescent images of pHerry (super ecliptic pHluorin [SEpH] [470/510 nm Ex/Em] and mCherry] 556/630 nm ex/em]) of UAS-pHerry driven by the capaR-GAL4 (principle cells of MT) in healthy anterior MTs. The region of interest (ROI) is marked. The background (BG) region is indicated. Scale bar: 50 μm. (B) Relative fluorescence changes of pHerry (SEpH and mCherry signals) of pHerry after 20 seconds of 40 mmol/L NH4Cl. The mCherry signal does not vary, it is stable, yet the SEpH signal increases fluorescence with alkalization (ie, increased pHi) and decreases fluorescence with NH4Cl washout (acidification; ie, decreased pHi). (C) The ratio of fluorescent signals (SEpH/mCherry) is calculated from data in panel B after calibration (30-min incubation in calibration iPBS: 10 μmol/L nigericin, 130 mmol/L K+, pH 7.4 and 9.0). (D) Calibration curve of the absolute pHerry ratio (SEpH/mCherry) after setting pHi during exposure to calibration insect PBS (iPBS) at eight pH values. Gray circles are individual values from 8 preparations, and the black squares and bars are means ± SD. The curve is fit to Boltzmann distribution. (E) Same data as in panel D but normalized so that pH 7.0 has a ratio of 1.0. Reprinted with permission from Rossano and Romero.
Figure 4.
Figure 4.
Acid flux determined from pHerry responses to NH4Cl pulse. By using pHerry, its calibration, and the rates of recovery in selected regions, a quantification of acid flux may be calculated. (A) pHerry fluorescence ratio in anterior MTs: principal cells (left, driven by capaR-GAL4) and stellate cells (right, driven by c724-GAL4). Depending on MT location, stellate cells have different morphologies: cells in initial and transitional segments are bar-shaped and cells in the main segment have cellular projections. Scale bar = 100 μm. (B) pHi changes in response to 20 seconds of 40 mmol/L NH4Cl (in specific regions of A) are calibrated. Single exponential fits are shown as dashed curves in the acid recovery phase (withdrawal of NH4Cl solution). The numeric fit allows a decay constant (τ) value to be derived. (C) JH+ (acid extrusion rate or H+ flux) can be plotted against the calculated pHi. (D) JH+ (H+ flux) then may be transformed as a flux per unit area. Reprinted with permission from Rossano and Romero.
Figure 5.
Figure 5.
In vivo pHerry fluorescence. The four panels show brightfield, super ecliptic pHluorin (SEpH) fluorescence, mCherry fluorescence, and a merge, respectively, of a living Drosophila. The top panels are a low magnification of the fly abdomen, which shows significant autofluorescence in the green and red channels. The dotted white box (merge panel) shows the Malpighian tubule (renal tubule epithelium, bottom images), which shows specific fluorescence, indicated by the yellow in the merged image. Note that these images were observed with the intact and anesthetized fly.
Figure 6.
Figure 6.
Genetically encoded pH sensors in mammalian cells. The two trace lines (blue and red) illustrate relative fluorescent responses of TM5 (normal human trabecular meshwork) cells transfected with two genetically encoded sensors. Blue is VSFP blue (lower inset) and tracks membrane potential. Red is pHire (upper inset) and tracks pHi. he TM5 cells on a glass coverslip were exposed to a 5% CO2/25 mmol/L HCO3 (pH 7.4 at room temperature), followed by Na+ removal (0 Na+, replacement by choline) in the continued presence of 5% CO2/25 mmol/L HCO3. This maneuver is designed to test for the presence of a Na+ bicarbonate cotransporter,, but also could indicate a Na+/H+ exchanger if HCO3 is not required. The callout boxes indicate the movement of ions or charge, which in turn elicit the fluorescent changes.

References

    1. Mitchell P. Coupling of phosphorylation to electron and hydrogen transfer by a chemi-osmotic type of mechanism. Nature. 1961;191:144–8. - PubMed
    1. Busa WB, Nuccitelli R. Metabolic regulation via intracellular pH. Am J Physiol. 1984;246:R409–38. - PubMed
    1. Trivedi B, Danforth WH. Effect of pH on the kinetics of frog muscle phosphofructokinase. J Biol Chem. 1966;241:4110–2. - PubMed
    1. Pouyssegur J, Franchi A, L’Allemain G, Paris S. Cytoplasmic pH, a key determinant of growth factor-induced DNA synthesis in quiescent fibroblasts. FEBS Lett. 1985;190:115–9. - PubMed
    1. Pouyssegur J, Sardet C, Franchi A, L’Allemain G, Paris S. A specific mutation abolishing Na+/H+ antiport activity in hamster fibroblasts precludes growth at neutral and acidic pH. Proc Natl Acad Sci U S A. 1984;81:4833–7. - PMC - PubMed

Publication types