

KLF12 Regulates Mouse NK Cell Proliferation
- PMID: 31300511
- PMCID: PMC6684394
- DOI: 10.4049/jimmunol.1900396
KLF12 Regulates Mouse NK Cell Proliferation
Abstract
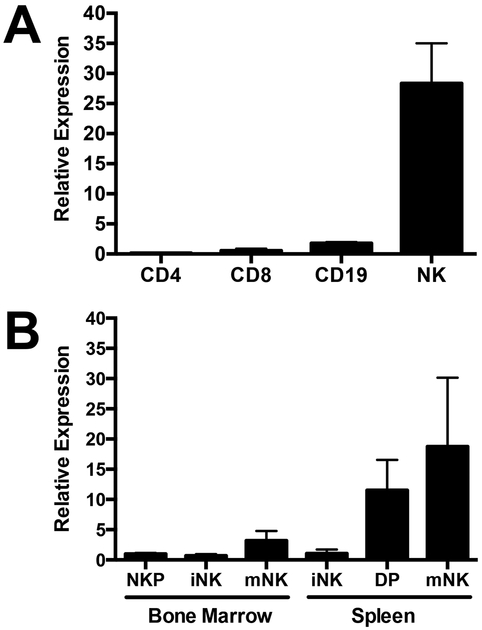
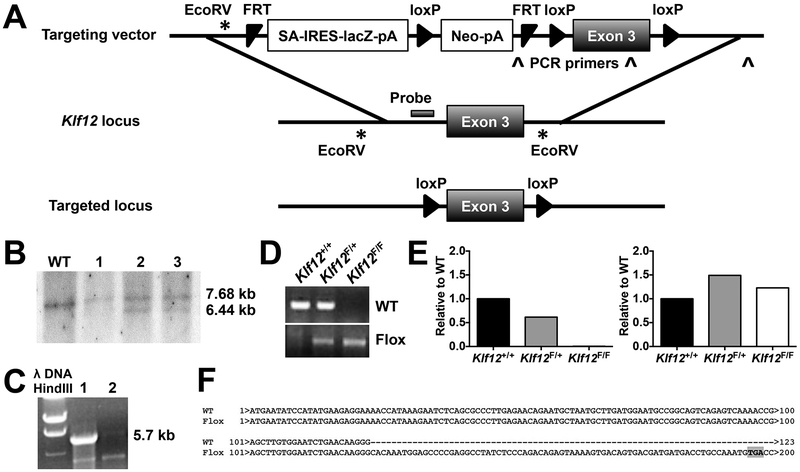
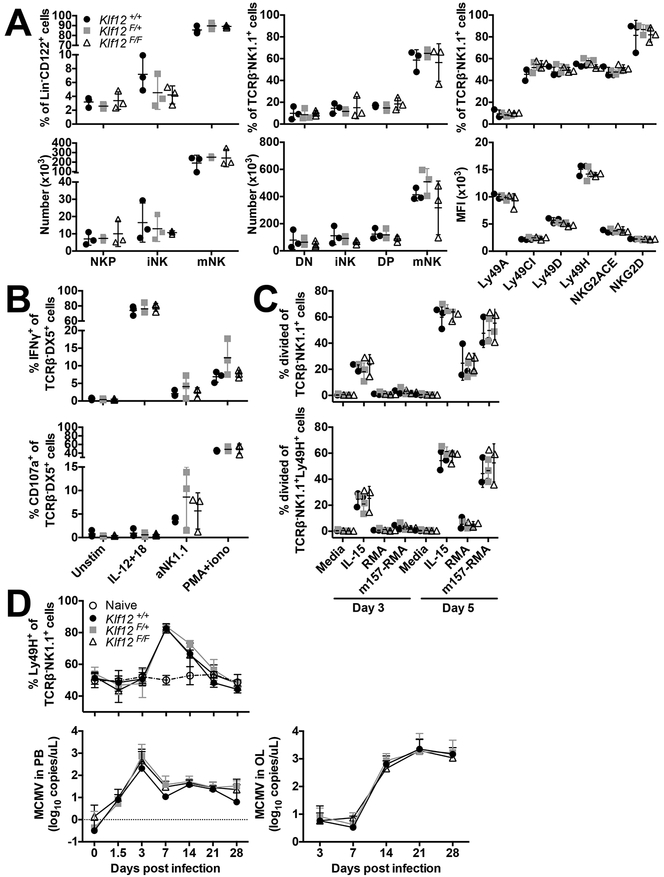
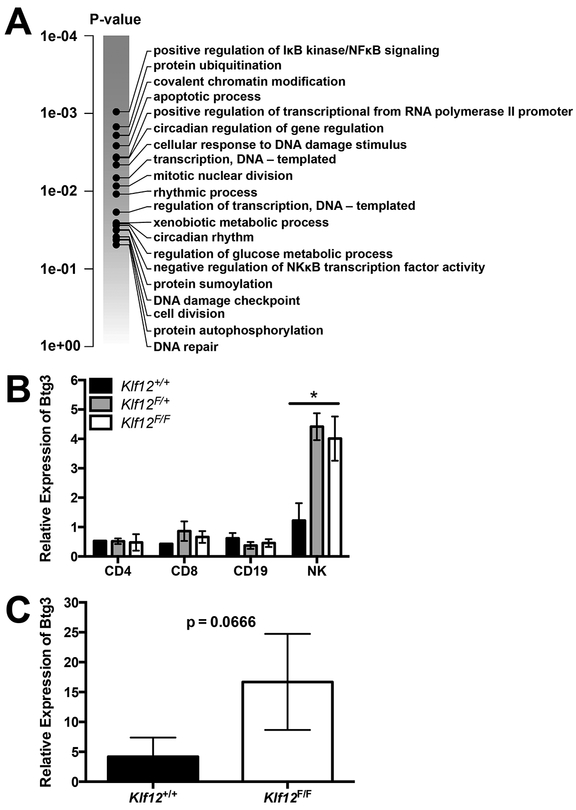
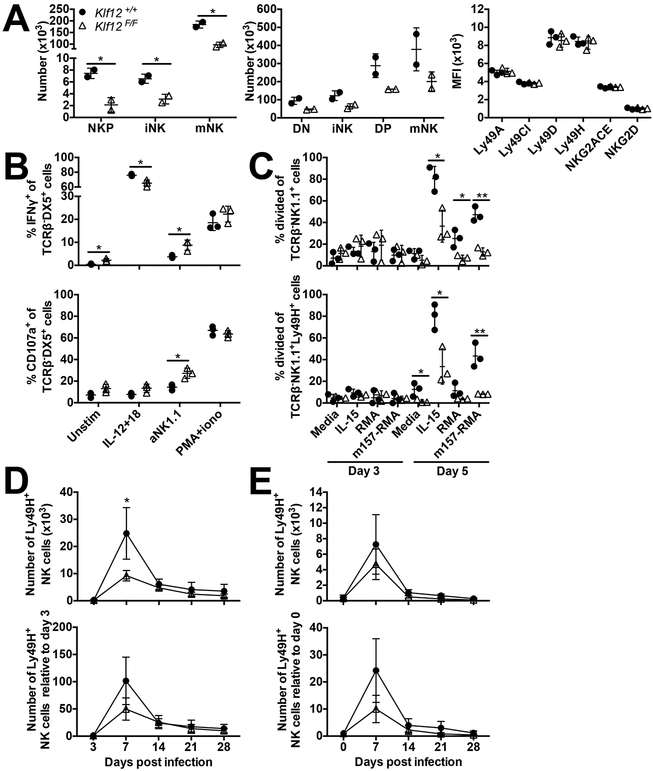
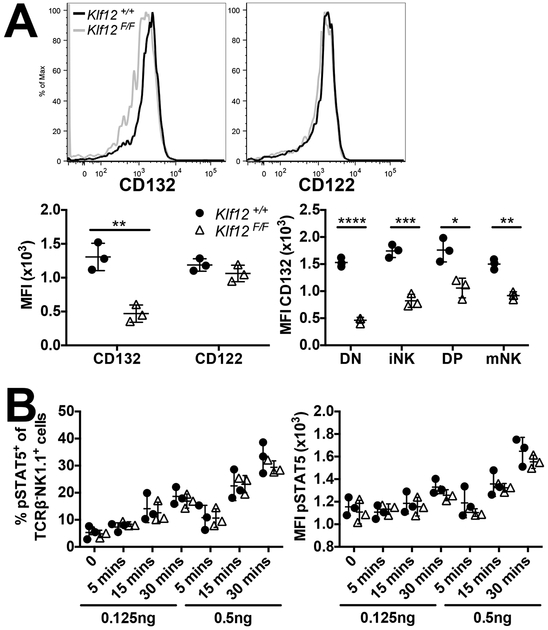
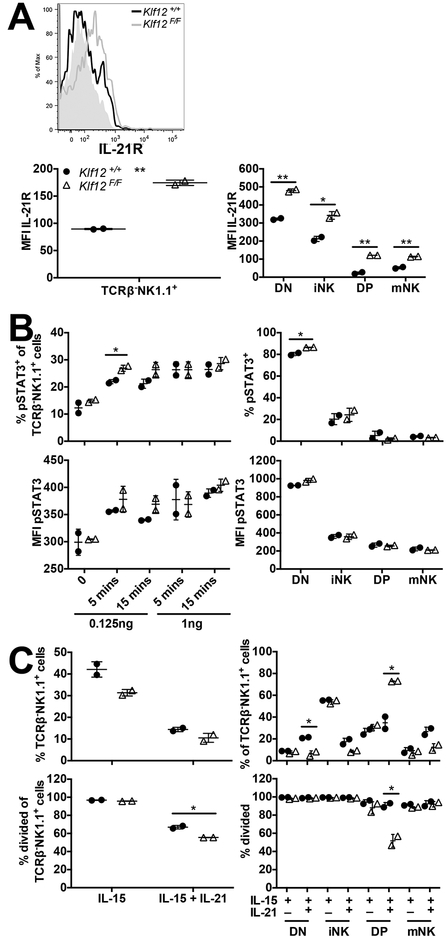
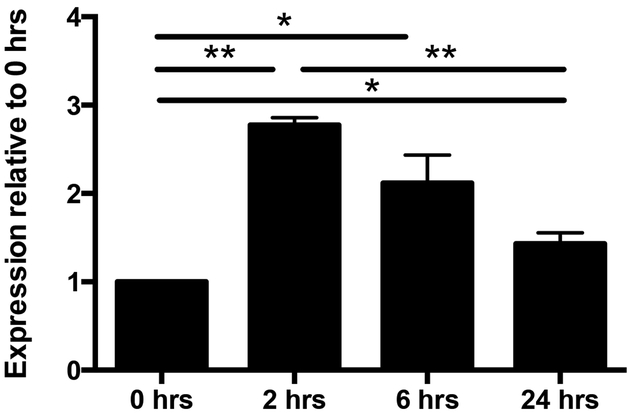
NK cells are innate lymphocytes that play an integral role in tumor rejection and viral clearance. Unlike their other lymphocyte counterparts, NK cells have the unique ability to recognize and lyse target cells without prior exposure. However, there are no known NK cell-specific genes that are exclusively expressed by all NK cells. Therefore, identification of NK cell-specific genes would allow a better understanding of why NK cells are unique cytotoxic lymphocytes. From the Immunological Genome (ImmGen) Consortium studies, we identified kruppel-like factor 12 (Klf12), encoding a novel transcription factor, preferentially expressed in C57BL/6 mouse NK cells. KLF12 was dispensable for NK cell development, IFN-γ production, degranulation, and proliferation in Klf12 knockout mice. RNA-sequencing analysis revealed increased expression of Btg3, an antiproliferative gene, in KLF12-deficient NK cells compared with wild-type NK cells. Interestingly, competitive mixed bone marrow chimeric mice exhibited reduced development of KLF12-deficient NK cells, altered IFN-γ production and degranulation, and impairment of NK cell proliferation in vitro and in vivo in response to mouse CMV infection. KLF12-deficient NK cells from bone marrow chimeric mice also expressed higher levels of the IL-21R, which resulted in increased IL-21R signaling and correlated with greater inhibition of NK cell proliferation. Furthermore, IL-21 induced Btg3 expression, which correlated with arrested NK cell maturation and proliferation. In summary, we found that KLF12 regulates mouse NK cell proliferation potentially by regulating expression of Btg3 via IL-21.
Copyright © 2019 by The American Association of Immunologists, Inc.
Conflict of interest statement
Disclosures
The authors have no financial conflicts of interest.
Figures
Similar articles
-
Transcription factor KLF2 regulates homeostatic NK cell proliferation and survival.Proc Natl Acad Sci U S A. 2016 May 10;113(19):5370-5. doi: 10.1073/pnas.1521491113. Epub 2016 Apr 25. Proc Natl Acad Sci U S A. 2016. PMID: 27114551 Free PMC article.
-
Interleukin 2-induced proliferation of murine natural killer cells in vivo.J Exp Med. 1990 Jan 1;171(1):173-88. doi: 10.1084/jem.171.1.173. J Exp Med. 1990. PMID: 1688606 Free PMC article.
-
Natural killer cells from protein kinase C theta-/- mice stimulated with interleukin-12 are deficient in production of interferon-gamma.J Leukoc Biol. 2008 May;83(5):1267-76. doi: 10.1189/jlb.1107745. Epub 2008 Feb 8. J Leukoc Biol. 2008. PMID: 18263766
-
Dysregulation of Krüppel-like factor 12 in the development of endometrial cancer.Gynecol Oncol. 2019 Jan;152(1):177-184. doi: 10.1016/j.ygyno.2018.10.028. Epub 2018 Oct 25. Gynecol Oncol. 2019. PMID: 30482501
-
Postnatal expression of KLF12 in the inner medullary collecting ducts of kidney and its trans-activation of UT-A1 urea transporter promoter.Biochem Biophys Res Commun. 2006 May 26;344(1):246-52. doi: 10.1016/j.bbrc.2006.03.138. Epub 2006 Mar 30. Biochem Biophys Res Commun. 2006. PMID: 16615998
Cited by
-
Transcriptional and epigenetic regulation of memory NK cell responses.Immunol Rev. 2021 Mar;300(1):125-133. doi: 10.1111/imr.12947. Epub 2021 Jan 24. Immunol Rev. 2021. PMID: 33491231 Free PMC article. Review.
-
Genome-Wide Analysis of the KLF Gene Family in Chicken: Characterization and Expression Profile.Animals (Basel). 2023 Apr 22;13(9):1429. doi: 10.3390/ani13091429. Animals (Basel). 2023. PMID: 37174466 Free PMC article.
-
Chromatin Landscape Underpinning Human Dendritic Cell Heterogeneity.Cell Rep. 2020 Sep 22;32(12):108180. doi: 10.1016/j.celrep.2020.108180. Cell Rep. 2020. PMID: 32966789 Free PMC article.
-
Cell autonomous expression of BCL6 is required to maintain lineage identity of mouse CCR6+ ILC3s.J Exp Med. 2023 Apr 3;220(4):e20220440. doi: 10.1084/jem.20220440. Epub 2023 Jan 18. J Exp Med. 2023. PMID: 36651876 Free PMC article.
-
Epigenetic and Transcriptional Regulation of Innate Immunity in Cancer.Cancer Res. 2022 Jun 6;82(11):2047-2056. doi: 10.1158/0008-5472.CAN-21-3503. Cancer Res. 2022. PMID: 35320354 Free PMC article. Review.
References
-
- Biron CA, Byron KS, and Sullivan JL. 1989. Severe herpesvirus infections in an adolescent without natural killer cells. N. Engl. J. Med 320: 1731–1735. - PubMed
-
- Mace EM, Hsu AP, Monaco-Shawver L, Makedonas G, Rosen JB, Dropulic L, Cohen JI, Frenkel EP, Bagwell JC, Sullivan JL, Biron CA, Spalding C, Zerbe CS, Uzel G, Holland SM, and S Orange J. 2013. Mutations in GATA2 cause human NK cell deficiency with specific loss of the CD56(bright) subset. Blood 121: 2669–2677. - PMC - PubMed
-
- Notarangelo LD, and Mazzolari E. 2006. Natural killer cell deficiencies and severe varicella infection. J. Pediatr 148: 563–564. - PubMed
Publication types
MeSH terms
Substances
Grants and funding
LinkOut - more resources
Full Text Sources
Molecular Biology Databases
