. 2019 Sep 4;39(36):7086-7101.
doi: 10.1523/JNEUROSCI.2817-18.2019. Epub 2019 Jul 12.

Tetrodotoxin-Sensitive Sodium Channels Mediate Action Potential Firing and Excitability in Menthol-Sensitive Vglut3-Lineage Sensory Neurons

Affiliations

Tetrodotoxin-Sensitive Sodium Channels Mediate Action Potential Firing and Excitability in Menthol-Sensitive Vglut3-Lineage Sensory Neurons

Theanne N Griffith et al. J Neurosci. .

Abstract

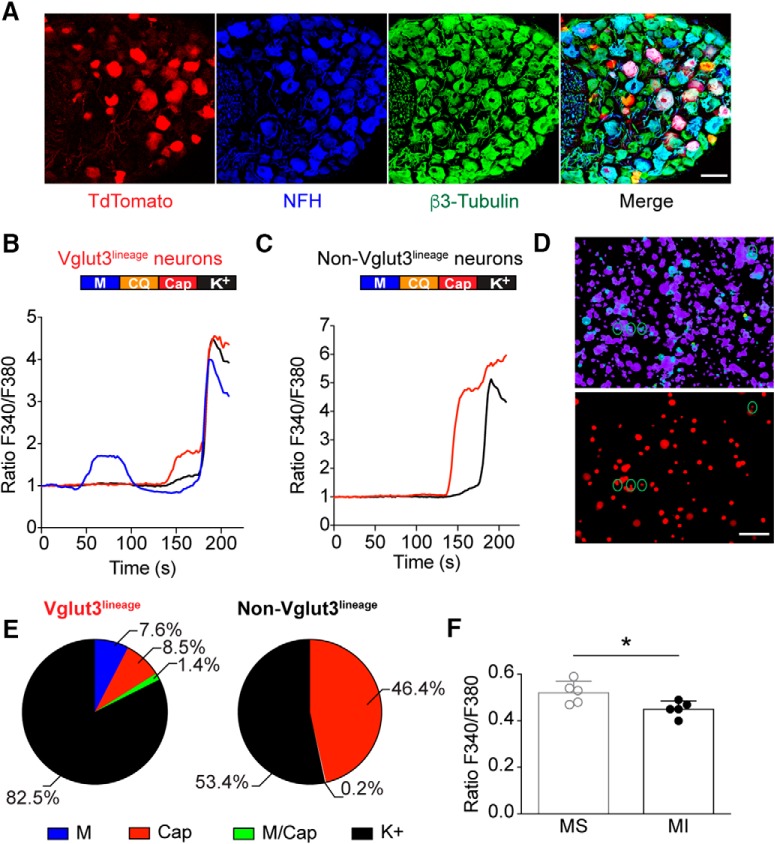
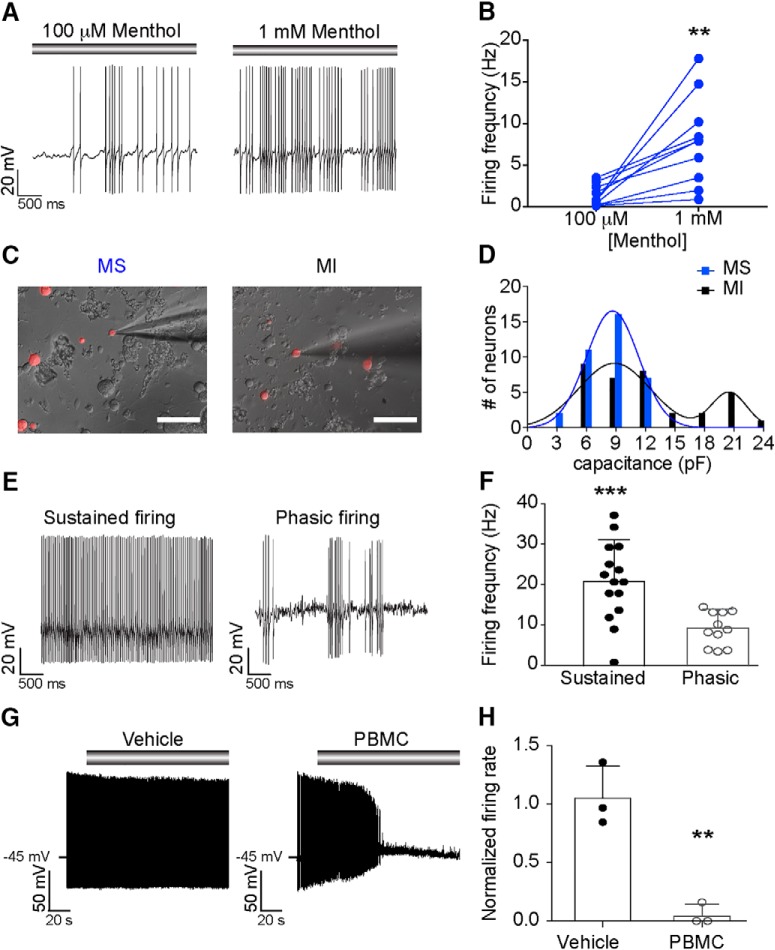
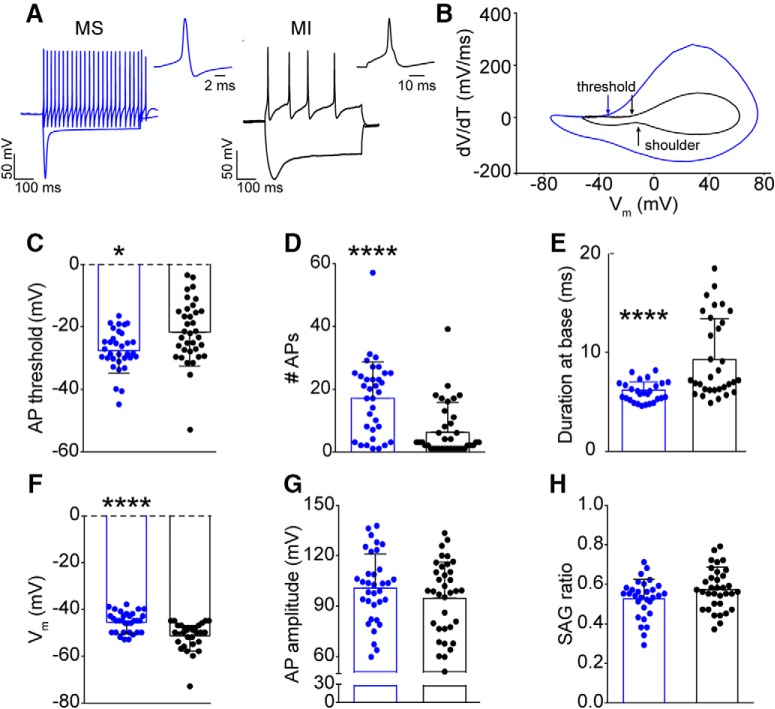
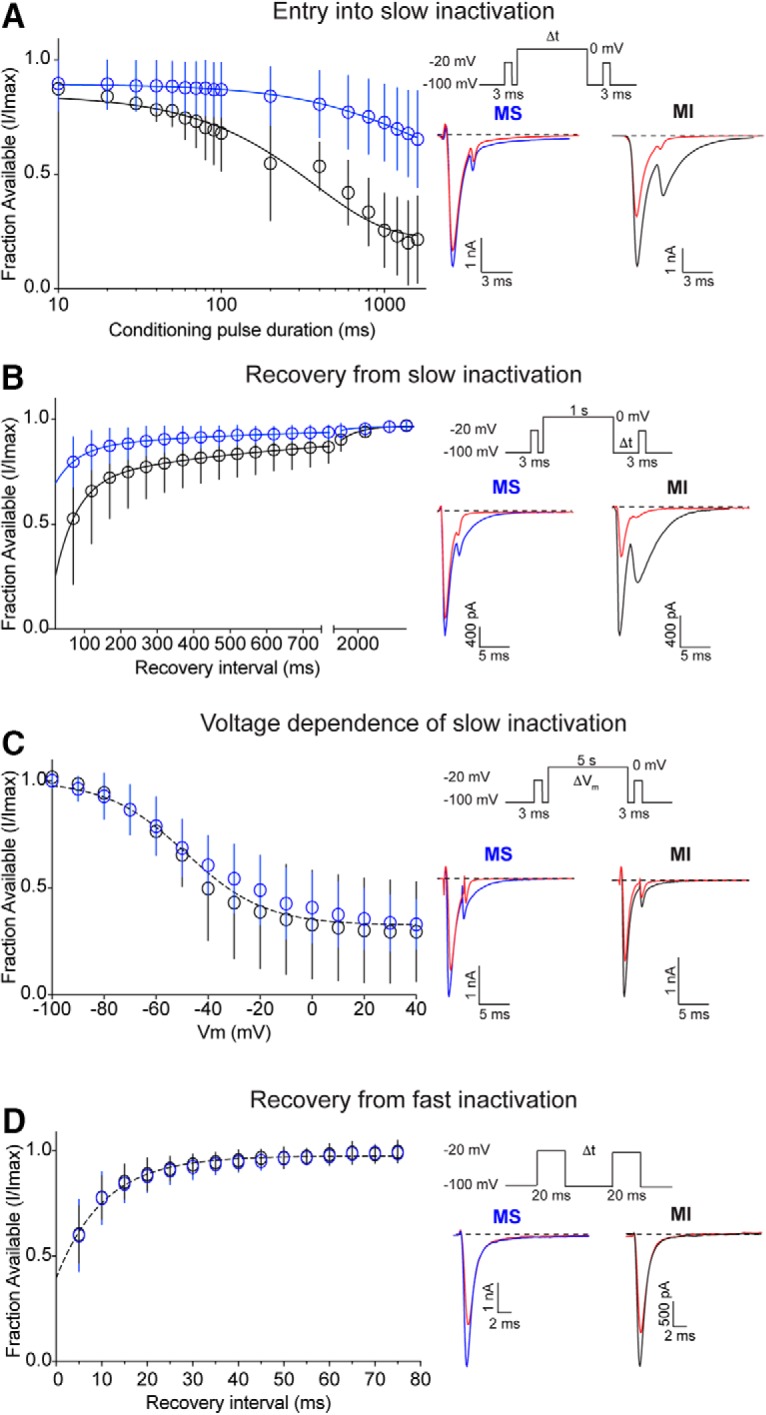
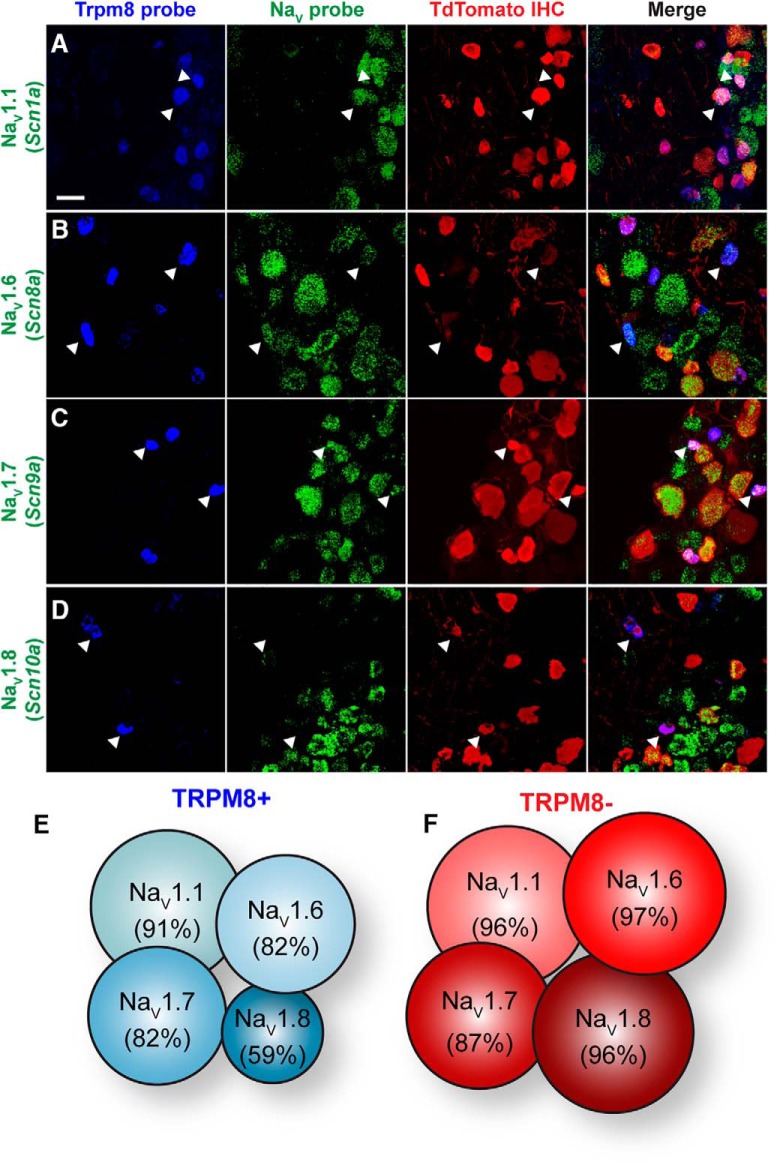
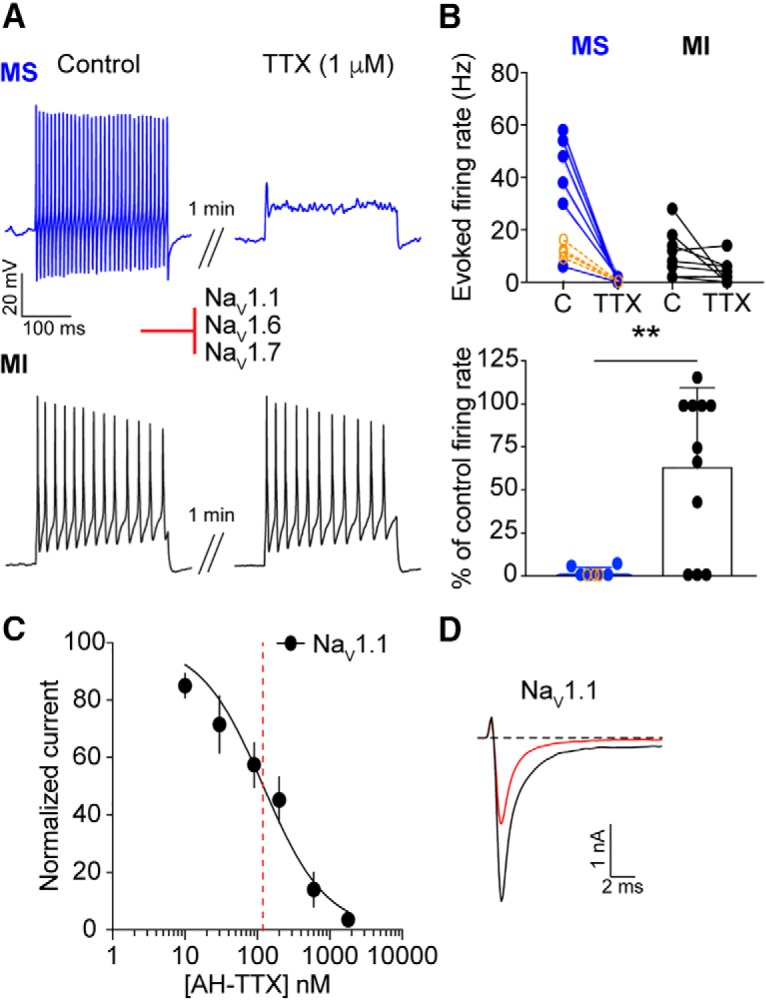
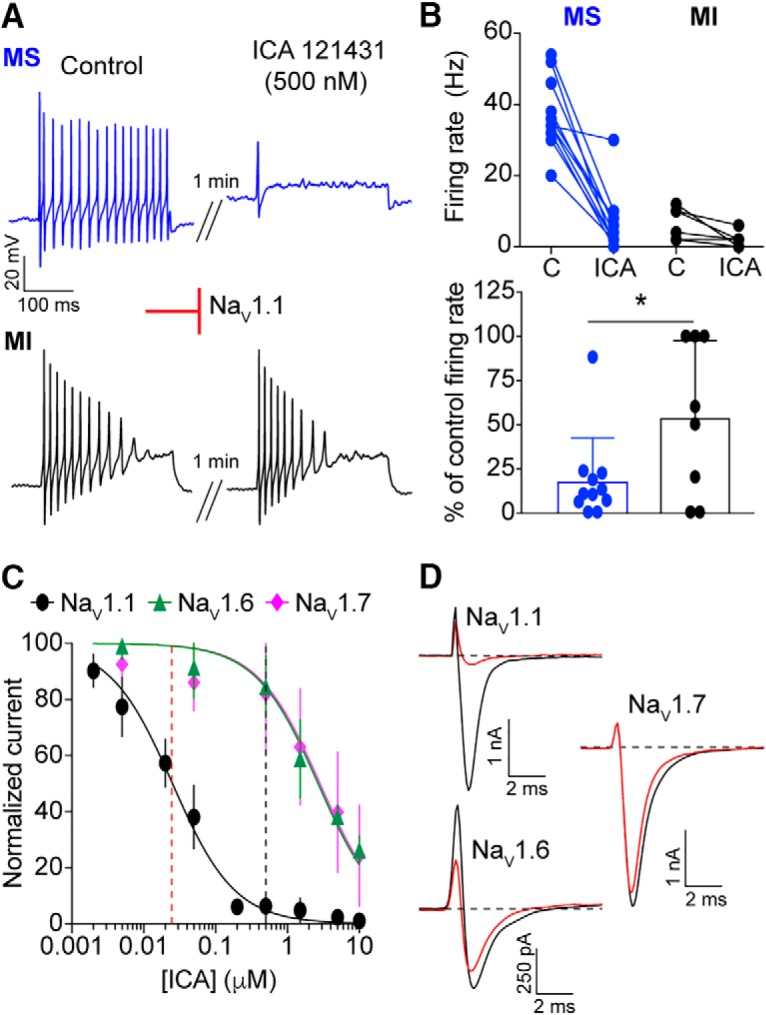
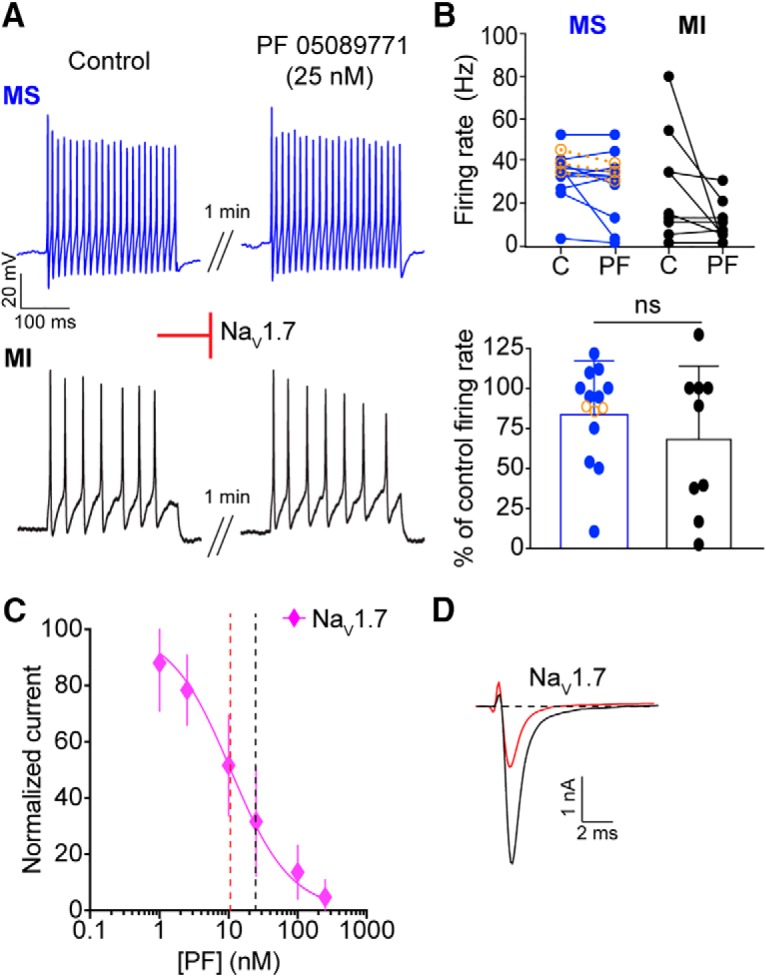
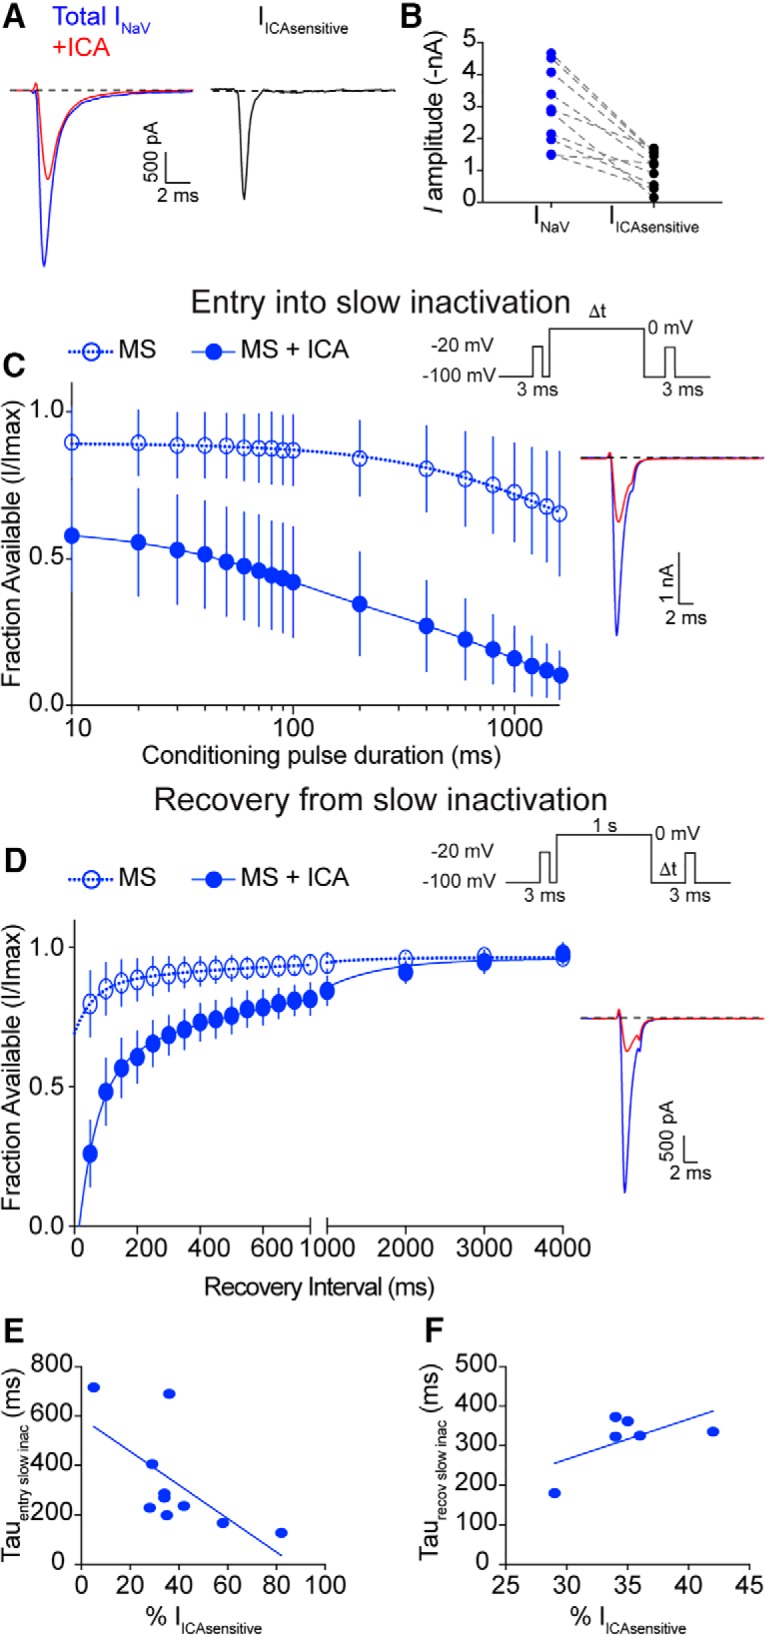
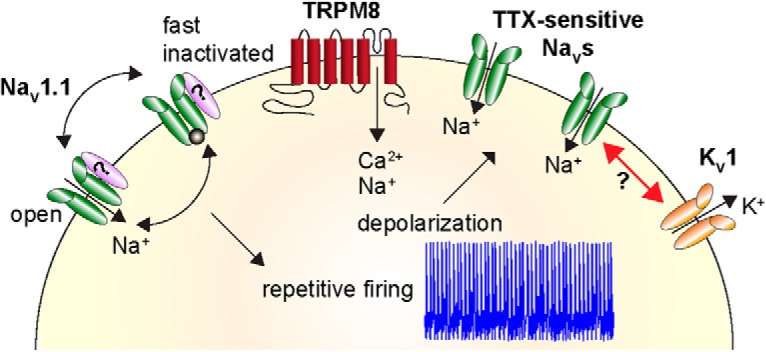
Small-diameter vesicular glutamate transporter 3-lineage (Vglut3lineage) dorsal root ganglion (DRG) neurons play an important role in mechanosensation and thermal hypersensitivity; however, little is known about their intrinsic electrical properties. We therefore set out to investigate mechanisms of excitability within this population. Calcium microfluorimetry analysis of male and female mouse DRG neurons demonstrated that the cooling compound menthol selectively activates a subset of Vglut3lineage neurons. Whole-cell recordings showed that small-diameter Vglut3lineage DRG neurons fire menthol-evoked action potentials and exhibited robust, transient receptor potential melastatin 8 (TRPM8)-dependent discharges at room temperature. This heightened excitability was confirmed by current-clamp and action potential phase-plot analyses, which showed menthol-sensitive Vglut3lineage neurons to have more depolarized membrane potentials, lower firing thresholds, and higher evoked firing frequencies compared with menthol-insensitive Vglut3lineage neurons. A biophysical analysis revealed voltage-gated sodium channel (NaV) currents in menthol-sensitive Vglut3lineage neurons were resistant to entry into slow inactivation compared with menthol-insensitive neurons. Multiplex in situ hybridization showed similar distributions of tetrodotoxin (TTX)-sensitive NaV transcripts between TRPM8-positive and -negative Vglut3lineage neurons; however, NaV1.8 transcripts, which encode TTX-resistant channels, were more prevalent in TRPM8-negative neurons. Conversely, pharmacological analyses identified distinct functional contributions of NaV subunits, with NaV1.1 driving firing in menthol-sensitive neurons, whereas other small-diameter Vglut3lineage neurons rely primarily on TTX-resistant NaV channels. Additionally, when NaV1.1 channels were blocked, the remaining NaV current readily entered into slow inactivation in menthol-sensitive Vglut3lineage neurons. Thus, these data demonstrate that TTX-sensitive NaVs drive action potential firing in menthol-sensitive sensory neurons and contribute to their heightened excitability.SIGNIFICANCE STATEMENT Somatosensory neurons encode various sensory modalities including thermoreception, mechanoreception, nociception, and itch. This report identifies a previously unknown requirement for tetrodotoxin-sensitive sodium channels in action potential firing in a discrete subpopulation of small-diameter sensory neurons that are activated by the cooling agent menthol. Together, our results provide a mechanistic understanding of factors that control intrinsic excitability in functionally distinct subsets of peripheral neurons. Furthermore, as menthol has been used for centuries as an analgesic and anti-pruritic, these findings support the viability of NaV1.1 as a therapeutic target for sensory disorders.

Keywords: action potential; dorsal root ganglion; excitability; sensory neuron; sodium channel.


Figures

Figure 1.
Figure 1.
Menthol-sensitivity is restricted to Vglut3lineage DRG neurons. A, Representative confocal images of DRG sections (25 μm) from adult Slc17a8iCre; Rosa26Ai14 mice immunostained with anti-DsRed (TdTomato; red), anti-neurofilament heavy (NFH; blue), and anti-β3-Tubulin (green). Images were acquired using a 20× 0.8 NA air objective. B, C, Baseline normalized, representative traces depicting Fura2-AM ratio (F340/F380) versus time traces of averaged responses from Vglut3lineage (B) and non-Vglut3lineage (C) DRG neurons to various chemosensory stimuli [menthol (M) 100 μm, blue trace; chloroquine (CQ) 1 mm; capsaicin (Cap) 1 μm, red trace; and high K+ Ringer's (K+) 140 mM, black trace]. Colored bar indicates time of agonist application. D, Images of calcium transients in live, dissociated Slc17a8iCre;Rosa26Ai14 DRG neurons quantified in B and C. Top, Fura2-AM calcium microfluorimetry following menthol application. Green circles indicate menthol-sensitive DRG neurons. Bottom, Fluorescent image showing TdTomato-expressing (Vglut3lineage) DRG neurons. E, Quantification of percentage of Vglut3lineage (n = 331) and non-Vglut3lineage (n = 453) neurons responding to individual agonists. F, Quantification of baseline calcium signals between Vglut3lineage menthol-sensitive neurons and menthol-insensitive neurons (both Vglut3lineage and non-Vglut3lineage). Significance was determined using an unpaired Student's t test. *p < 0.05. Data represented as mean ± SD. Scale bars, 100 μm.
Figure 2.
Figure 2.
Menthol-sensitive Vglut3lineage neurons fire action potential discharges at room temperature. A, Representative current-clamp recording from a menthol-sensitive Vglut3lineage DRG neuron. Gray bar indicates menthol application (100 μm, left; 1 mm, right). B, Quantification of firing rates in response to 100 μm and 1 mm menthol. Lines connecting symbols indicate paired observations. Significance was determined using a paired Student's t test (two-tailed). **p = 0.0036. C, Representative differential interference contrast image (20×, 0.75 NA air objective) of a menthol-sensitive (MS; left) and a menthol-insensitive (MI; right) DRG neuron in culture during electrophysiological recordings. TdTomato fluorescence indicates Vglut3cre expression at some point during development (Vglut3lineage). D, Histogram of membrane capacitance measurements from MS (blue) and MI (black) Vglut3lineage neurons. Lines indicate the mean(s) of the Gaussian core. E, Left, Representative current-clamp recording from a MS neuron exhibiting sustained firing at room temperature. Right, A different MS neuron firing with a phasic action potential discharge pattern. F, Quantification of average non-evoked firing frequency of MS Vglut3lineage neurons at room temperature. Each individual point represents the average firing frequency of a single neuron over a 5 s period. Firing frequencies for phasic-firing neurons were quantified during bursts of action potentials only. Significance was determined using an unpaired Student's t test (two-tailed). ***p = 0.0009. G, Left, Representative current-clamp trace of room temperature action potential firing in a MS neuron. Vehicle treatment did not impact firing rate. Gray bar indicates vehicle application. Right, Representative current-clamp trace of inhibition of action potential firing in a MS neuron following application of the TRPM8 blocker, PBMC (25 nm). Gray bar indicates PBMC application. H, Quantification of relative firing rate following 90 s of vehicle or PBMC treatment. Significance was determined using an unpaired Student's t test. **p < 0.01. Data represented as mean ± SD. Scale bars, 100 μm.
Figure 3.
Figure 3.
Intrinsic excitability of menthol-sensitive Vglut3lineage DRG neurons. A, Representative current-clamp traces from a menthol-sensitive (MS; left, blue) and -insensitive (MI; right, black) Vglut3lineage DRG neuron in response to −200 and 50 pA current injections. The single action potential for each represents the first action potential elicited by the 50 pA current injection. B, Phase-plots of single action potentials shown in A. Plots show the first derivative of the somatic membrane potential (dV/dT) versus the instantaneous somatic membrane potential. The blue curve represents the MS neuron and the black curve represents the MI neuron. Arrows indicating “threshold” are the points at which the membrane potential of the phase plot slope reached 10 mV ms−1. The arrow indicating shoulder represents the momentary slowing of membrane repolarization seen in a subpopulation of menthol-insensitive neurons. CH, Quantification of action potential threshold (C), number of action potentials generated in response to a 50 pA current injection (D), duration at base (E), membrane potential (F), membrane potential (G), and sag ratio (H) for MS (blue) and MI (black) Vglut3lineage DRG neurons. Significance was determined using unpaired Student's t tests for normally distributed populations (C, E, G, H) or Mann–Whitney tests for non-normal distributions (D, F). *p < 0.05, ****p < 0.0001. Bars denote mean ± SD and filled circles show data from each neuron.
Figure 4.
Figure 4.
NaV recovery from slow inactivation in small-diameter Vglut3lineage DRG neurons. A, Left, Quantification of entry into slow inactivation for menthol-sensitive (MS; blue) and -insensitive (MI; black) Vglut3lineage DRG neurons. The current elicited following a conditioning pulse to 0 mV is normalized to the current elicited during an initial test step and plotted against the duration of the conditioning pulse. Lines show exponential fits to the data. Top right, Voltage protocol used to measure NaV entry into slow inactivation. Channel slow inactivation was elicited by a conditioning pulse ranging from 10 to 1600 ms. A test step to −20 mV given 12 ms after the conditioning pulse was used to determine entry into slow inactivation. Bottom right, Representative whole-cell voltage-clamp traces of currents elicited from MS and MI neurons. Blue or black traces represent initial test steps; red traces represent test pulses given after a 200 ms conditioning step. B, Left, Quantification of recovery from slow inactivation kinetics for MS and MI neurons. Recovery during the second test step is normalized to the current during the initial test step and plotted against the recovery interval. Lines show double-exponential fits to the data. MS neurons: n = 9, τ1 = 571.1 ms, τ2 = 59.5 ms; MI neurons: n = 6, τ1 = 764.6 ms, τ2 = 58.2 ms; p < 0.0001, extra sum-of-squares F test. Top right, Voltage protocol used to measure NaV recovery from slow inactivation. Slow inactivation was induced by a 1 s conditioning pulse to 0 mV. Recovery was assayed by 3 ms steps to −20 mV with increasing recovery durations, beginning at 50 ms following the conditioning pulse. Bottom right, Representative whole-cell voltage-clamp traces of currents elicited from a MS (blue) and a MI (black) neuron. Blue or black traces represent initial test steps; red traces represent pulses given 50 ms after the conditioning step. C, Left, Quantification of steady-state voltage dependence of slow inactivation. Both groups were well fit by a single Boltzmann equation (V50 = −48.6 mV, slope factor = −15.6 mV, n = 7–8 neurons per group, p = 0.1031, extra sum-of-squares F test). Top right, Protocol for measuring voltage dependence of slow inactivation. A conditioning pulse of 5 s to membrane potentials between −100 and +40 mV were followed by a 20 ms step to −100 mV and then a test step to −20 mV. Bottom right, Representative traces of currents elicited from a MS (blue) and a MI (black) neuron. Red traces represent test pulses to −40 mV. D, Left, Quantification of recovery from fast inactivation kinetics. Lines show monoexponential fits to the data. Top right, Protocol to measure recovery from fast inactivation. A 20 ms step to −20 mV from −100 mV is followed by varying durations at the recovery potential (−100 mV) before a second test step to −20 mV. MS and MI datasets were well fit by a single monoexponential equation. τ = 10.5 ms, n = 10 for both groups. Bottom right, Representative traces of currents elicited from a MS (blue) and a MI (black) neuron. Red traces represent test pulses 5 ms following the initial test step. Error bars indicate SD; absent error bars are smaller than symbols.
Figure 5.
Figure 5.
NaV expression profile of small-diameter Vglut3lineage DRG neurons. AD, Representative confocal images of single molecule multiplex in situ hybridizations performed on cryosections of adult DRG (25 μm). Images were acquired with a 40×, 1.3 NA oil-immersion objective. Scale bar, 50 μm. Sections were hybridized with probes targeting TRPM8 (Trpm8; blue) and the following voltage-gated sodium channel subunits (green): (A) NaV1.1 (Scn1a), (B) NaV1.6 (Scn8a), (C) NaV1.7 (Scn9a), and (D) NaV1.8 (Scn10a). Sections were stained using immunohistochemistry with anti-dsRED (TdTomato; red) to label Vglut3lineage neurons. White arrowheads indicate representative TRPM8+/NaV+ neurons. E, F, Schematic representation of the percentage of TRPM8+ (E) or TRPM8− (F) small-diameter Vglut3lineage neurons that colabeled for each given NaV subunit.
Figure 6.
Figure 6.
TTX-sensitive NaVs mediate action potential firing in menthol-sensitive Vglut3lineage neurons. A, Representative current-clamp traces from menthol-sensitive (MS; top, blue) and -insensitive (MI; bottom, black) Vglut3lineage DRG neurons before (left) and after (right) a 1 min application of TTX (1 μm). B, Top, Quantification of firing rates before and after TTX application (n = 6 MS neurons, n = 11 MI neurons). Lines connecting symbols indicate paired observations. Bottom, Quantification of the percentage of control firing rate that remained following TTX application for MS and MI neurons. Blue symbols indicate MS neurons and black symbols indicate MI neurons. Orange symbols indicate firing rates of MS neurons before and after application of 300 nm TTX (n = 4). C, A dose–response curve obtained for inhibition of recombinant human NaV1.1 channels stably expressed in HEK293 cells by AH-TTX, a blocker of NaV1.6 channels. Red dashed line indicates apparent IC50. D, Representative whole-cell voltage-clamp traces of NaV1.1 currents elicited from HEK293 cells. Black trace indicates current elicited before application of AH-TTX. Red trace shows reduction in NaV1.1 current after application of 200 nm AH-TTX. Red inhibitory sign indicates the inhibition of denoted NaV subunits by the blocker. **p < 0.01.
Figure 7.
Figure 7.
A critical role for NaV1.1 channels in action potential firing by menthol-sensitive Vglut3lineage DRG neurons. A, Representative current-clamp traces from menthol-sensitive (MS; top, blue) and -insensitive (MI; bottom, black) Vglut3lineage DRG neurons before (left) and after (right) a 1 min application of ICA 121431 (500 nm). B, Top, Quantification of firing rates before and after ICA 121431 application (n = 11 MS neurons, n = 8 MI neurons). Lines connecting symbols indicate paired observations. Bottom, Quantification of the percentage of control firing rate that remained following ICA 121431 application. C, A dose–response curve quantifying inhibition of recombinant human NaV1.1 (black circles), NaV1.6 (green triangles), and NaV1.7 (magenta diamonds) by ICA 121431. The apparent IC50 for NaV1.1 is indicated by a red dashed line. The concentration of ICA 121431 used in this study is indicated by a black dashed line. D, Representative whole-cell voltage-clamp traces of NaV1.1, NaV1.6 and NaV1.7 currents elicited from HEK293 cells before (black trace) and after (red trace) application of 500 nm ICA 121431. Red inhibitory sign indicates the inhibition of denoted NaV subunits by the blocker. *p < 0.05.
Figure 8.
Figure 8.
NaV1.7 channels do not contribute to action potential firing in small-diameter Vglut3lineage DRG neurons. A, Representative current-clamp traces from menthol-sensitive (MS; top, blue) and -insensitive (MI; bottom, black) Vglut3lineage DRG neurons before (left) and after (right) a 1 min application of PF 05089771 (25 nm). B, Top, Quantification of firing rates before and after PF 05089771 application (n = 11 MS neurons, n = 9 MI neurons) or Pn3a (300 nm, orange symbols in F; n = 3 MS neurons). Lines connecting symbols indicate paired observations. Bottom, Quantification of the percentage of control firing rate that remained following PF 05089771 application. C, A dose–response curve measuring inhibition of recombinant human NaV1.7 channels by PF 05089771. The apparent IC50 is indicated by a red dashed line. The concentration of PF 05089771 used in this study is indicated by a black dashed line. D, Representative whole-cell voltage-clamp traces of NaV1.7 currents elicited from HEK293 cells before (black trace) and after (red trace) application of 25 nm PF 05089771. Red inhibitory sign indicates the inhibition of denoted NaV subunits by the blocker. Significance was determined by unpaired Student's t tests. ns = not significant.
Figure 9.
Figure 9.
NaV1.1 channels determine entry into slow inactivation rates in menthol-sensitive Vglut3lineage neurons. A, Representative whole-cell voltage-clamp traces of currents elicited from a MS neuron in the before (blue trace) and after application of 500 nm ICA 121431 (red trace). The subtracted NaV1.1-mediated current is shown in black. B, Quantification of peak NaV current amplitude before (blue circles) and after ICA 121431 application (black circles). Gray dashed lines indicated paired observations. C, Quantification of entry into slow inactivation for MS Vglut3lineage DRG neurons during blockade of NaV1.1 channels by ICA 121431 (filled circles, blue lines). Data for MS neurons from Figure 4A is shown for comparison (clear circles, dashed lines). The current elicited following a conditioning pulse to 0 mV is normalized to the current elicited during an initial test step and plotted against the duration of the conditioning pulse. Lines show exponential fits to the data. Top right, Voltage protocol used to measure NaV entry into slow inactivation. Bottom right, Representative whole-cell voltage-clamp traces. Blue trace represents initial test step; red trace represents test pulses given after a 200 ms conditioning step. D, Left, Same as C except Quantification represents recovery from slow inactivation kinetics. Data for MS neurons from Figure 4B is shown for comparison (clear circles, dashed lines). Recovery during the second test step is normalized to the current during the initial test step and plotted against the recovery interval. Lines show double-exponential fits to the data. MS neurons + ICA: τ1 = 725.1 ms, τ2 = 59.8 ms, n = 6. Top right, Voltage protocol used to measure NaV recovery from slow inactivation. Bottom right, Representative whole-cell voltage-clamp trace of current elicited from a MS neuron in the presence of ICA 121431. Blue trace represents initial test step; red trace represents pulse given 50 ms after the conditioning step. E, Individual entry into slow inactivation rates for MS neurons plotted against the percentage of the total NaV current that was sensitive to ICA 121431; r2 = 0.43, p = 0.04. F, Same as E but individual recovery from slow inactivation rates are plotted; r2 = 0.37, p = 0.20.
Figure 10.
Figure 10.
Proposed model demonstrating heightened excitability of menthol-sensitive Vglut3lineage DRG neurons. Activation of TRPM8 ion channels (red) causes an influx of cations that depolarizes the neuron. This leads to activation of TTX-sensitive NaVs, including NaV1.1 channels (green), and subsequent action potential firing. Repetitive firing is achieved by NaV1.1 channels cycling through open and fast-inactivated states, without being sequestered into long-lived slow inactivated states. This may be facilitated by association with auxiliary proteins (purple). NaV complexes in menthol-sensitive Vglut3lineage DRG neurons could function to oppose a strong hyperpolarizing conductance mediated by KV1 potassium channels (orange).

Similar articles

Cited by

References

    1. Alexandrou AJ, Brown AR, Chapman ML, Estacion M, Turner J, Mis MA, Wilbrey A, Payne EC, Gutteridge A, Cox PJ, Doyle R, Printzenhoff D, Lin Z, Marron BE, West C, Swain NA, Storer RI, Stupple PA, Castle NA, Hounshell JA, et al. (2016) Subtype-selective small molecule inhibitors reveal a fundamental role for Nav1.7 in nociceptor electrogenesis, axonal conduction and presynaptic release. PLoS One 11:e0152405. 10.1371/journal.pone.0152405 - DOI - PMC - PubMed
    1. Aman TK, Raman IM (2007) Subunit dependence of na channel slow inactivation and open channel block in cerebellar neurons. Biophys J 92:1938–1951. 10.1529/biophysj.106.093500 - DOI - PMC - PubMed
    1. Aman TK, Grieco-Calub TM, Chen C, Rusconi R, Slat EA, Isom LL, Raman IM (2009) Regulation of persistent Na current by interactions between β subunits of voltage-gated Na channels. J Neurosci 29:2027–2042. 10.1523/JNEUROSCI.4531-08.2009 - DOI - PMC - PubMed
    1. Andersson DA, Chase HW, Bevan S (2004) TRPM8 activation by menthol, icilin, and cold is differentially modulated by intracellular pH. J Neurosci 24:5364–5369. 10.1523/JNEUROSCI.0890-04.2004 - DOI - PMC - PubMed
    1. Barker BS, Nigam A, Ottolini M, Gaykema RP, Hargus NJ, Patel MK (2017) Pro-excitatory alterations in sodium channel activity facilitate subiculum neuron hyperexcitability in temporal lobe epilepsy. Neurobiol Dis 108:183–194. 10.1016/j.nbd.2017.08.018 - DOI - PMC - PubMed

Publication types