. 2019 Jul 12;10(1):3075.
doi: 10.1038/s41467-019-10770-4.

Silencing cortical activity during sound-localization training impairs auditory perceptual learning

Affiliations

Silencing cortical activity during sound-localization training impairs auditory perceptual learning

Victoria M Bajo et al. Nat Commun. .

Abstract

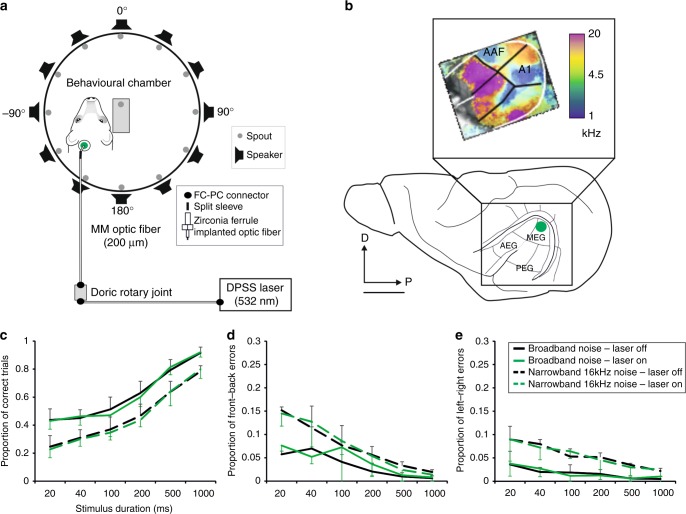
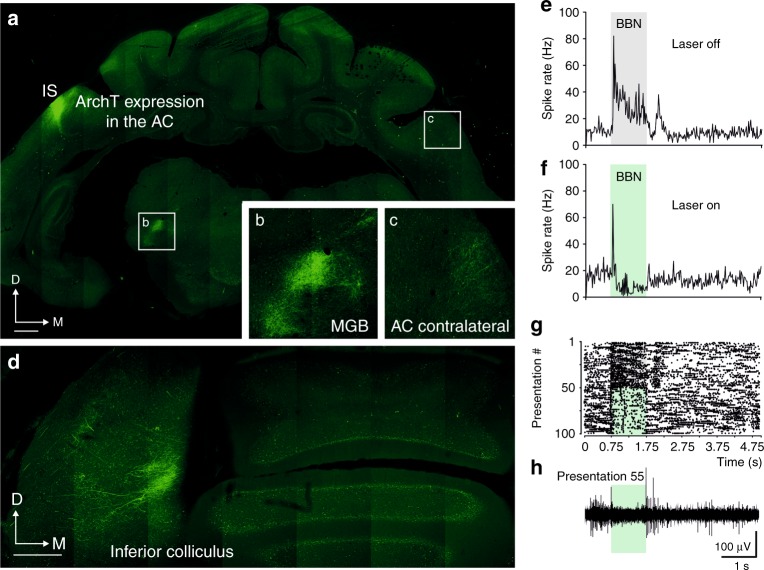
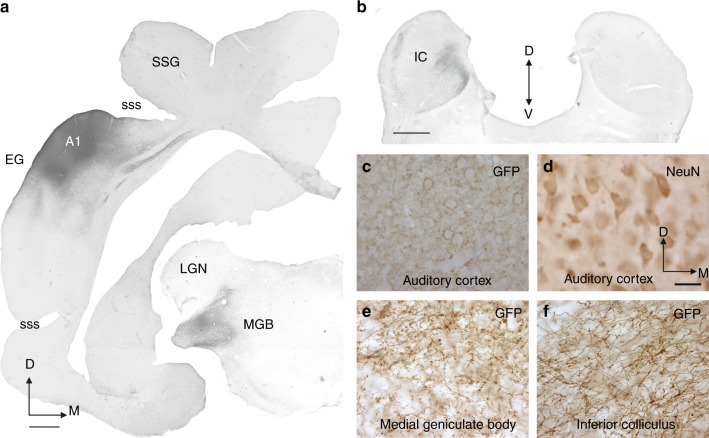
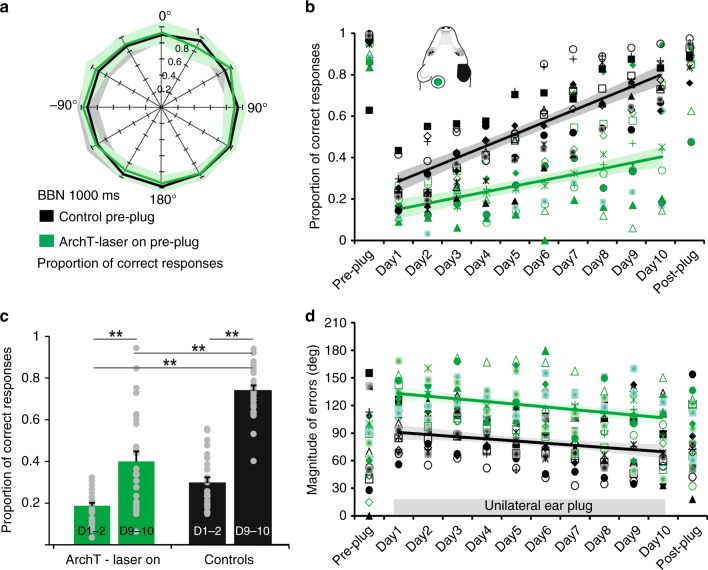
The brain has a remarkable capacity to adapt to changes in sensory inputs and to learn from experience. However, the neural circuits responsible for this flexible processing remain poorly understood. Using optogenetic silencing of ArchT-expressing neurons in adult ferrets, we show that within-trial activity in primary auditory cortex (A1) is required for training-dependent recovery in sound-localization accuracy following monaural deprivation. Because localization accuracy under normal-hearing conditions was unaffected, this highlights a specific role for cortical activity in learning. A1-dependent plasticity appears to leave a memory trace that can be retrieved, facilitating adaptation during a second period of monaural deprivation. However, in ferrets in which learning was initially disrupted by perturbing A1 activity, subsequent optogenetic suppression during training no longer affected localization accuracy when one ear was occluded. After the initial learning phase, the reweighting of spatial cues that primarily underpins this plasticity may therefore occur in A1 target neurons.


Conflict of interest statement

The authors declare no competing interests.

Figures

Fig. 1
Fig. 1
Effects of unilateral optogenetic suppression on sound localization accuracy. a Floor plan of the circular chamber used for behavioral testing, with 12 loudspeakers arranged at equal intervals around the periphery. The laser was located in a locked cupboard outside the chamber from where light was transmitted by a 2.0 m long fiber-optic cable (multi-mode fiber, core diameter 200 μm, 0.22 NA) connected via an FC connector to a second, 1.5 m long fiber-optic cable at a Doric rotary joint, which was attached to the ceiling of the chamber. During each testing session, the zirconia ferrule at the end of this second cable was connected by a split sleeve to an identical ferrule in the fiber-optic cannula implanted in the brain (Supplementary Fig. 1). The green dot indicates the location of the optical fiber implant in the high-frequency region of A1. b The ferret auditory cortex is located in the ectosylvian gyrus and comprises three areas: the anterior, middle, and posterior ectosylvian gyrus (AEG, MEG, and PEG, respectively). The primary auditory cortex (A1) and the anterior auditory field (AAF) are located in the MEG and are tonotopically organized, with neurons tuned to high frequencies (warm colors, inset) found in the dorsal corner of each field and neurons tuned to lower frequencies located more ventrally (cool colors). The inset shows the frequency map of one animal obtained using intrinsic optical imaging. D, dorsal, P, posterior. Scale bar, 5 mm. ce Sound localization accuracy was not affected by unilateral optogenetic suppression of A1 activity (n = 13). Two different sound stimuli, broadband noise and one octave narrowband noise centered at 16 kHz, were presented at six different durations (20–1000 ms) to examine the effects of suppression of activity in the high-frequency region of A1 in 50% of trials (randomly interleaved). c Proportion (mean ± s.d) of correct responses, d front–back errors, and e left–right errors. Source data are provided as a Source Data file
Fig. 2
Fig. 2
Optogenetic suppression of ferret A1. a ArchT-GFP expression in a coronal view of the auditory cortex and thalamus of a ferret brain (F1431) transfected with the AAV8-CaMKII-ArchT-GFP construct. IS injection site. b, c Higher magnification views of the corresponding boxed regions in (a). d GFP-labeled axons and terminals in the inferior colliculus originating from transfected neurons at the injection site shown in (a). eh Neural activity recorded in a different animal (F1804) from a representative A1 unit expressing ArchT under the CaMKII promoter in response to 1000 ms bursts of broadband noise (BBN, gray bar) presented either alone (e) or paired with a 1000-ms light pulse (f) (green bar). (e) and (f) show 20 ms binned peristimulus time histograms. g The corresponding dot rasters for this unit grouped into laser-off (top half) and laser-on presentations (bottom half). h Activity recorded during a single presentation (#55 of the raster plot) with BBN paired with laser illumination (green) is shown in the bottom panel. Activation of ArchT by laser illumination resulted in suppression of the unit’s sound-evoked response (t test, t4 = 6.584, P= 0.001), including a loss of its offset response. Comparable spike rate to that found before BBN/laser illumination was observable as early as 0.5 s after laser offset (t test, t4 = 2.271, P= 0.086). Auditory cortical cells continued expressing ArchT 30 months after the viral construct injections. Behavioral testing took place over a 30-month period and was stable throughout, with no impact of when the animals were tested on whether they adapted or not to monaural occlusion. Furthermore, once the brains had been processed histologically, subsequent neuronal quantification showed no differences in the overall number or density of transfected cells with survival time following viral vector injections. Scale bars in (a) and (d), 1 mm. AC auditory cortex, D dorsal, M medial, MGB medial geniculate body
Fig. 3
Fig. 3
GFP Immunolabeling following transfection with the AAV8/CAG-ArchT-GFP construct. GFP staining (dark black/brown, shown for case F1115) was used as a reporter of ArchT expression. a GFP immunoreactivity following AAV8/CAG-ArchT-GFP injections in A1 and GFP-labeled axons and terminals in the medial geniculate body (MGB). b GFP-labeled axons and terminals in the inferior colliculus (IC). cf High-power views. GFP-immunopositive (c) and NeuN-immunopositive (d) neurons at the location of the injection site in the cortex and, in the same animal, GFP labeling in fibers and terminals in the MGB (e) and IC (f). ArchT expression was identified on the basis of GFP immunoreactivity in the auditory cortex and compared with the distribution of NeuN-immunopositive neurons in order to estimate transfection rates for the two different constructs in ferrets used for behavioral testing (30 months after injections) and those used only for anatomy or recordings (4 weeks after injections). Stereological estimations made using the optical fractionator probe (n = 5 cases, 3 using CAG and 2 using CaMKII promoters) revealed that when AAV8/CAG-ArchT-GFP was used, 84.4 ± 14.8% (mean ± SD) of the neurons in the injection site were transfected, whereas, with AAV8/CaMKII-ArchT-GFP, the transfection rate was 60.03 ± 14.8% (mean ± SD). Other abbreviations: A1 primary auditory cortex, D dorsal, EG ectosylvian gyrus, LGN lateral geniculate nucleus, M medial, SSG suprasylvian gyrus, sss suprasylvian sulcus, V ventral. Calibration bars, 1 mm in (a) and (b), 50 µm in (d). Orientation and calibration bars in (d) apply to (c, e, f)
Fig. 4
Fig. 4
Optogenetic suppression of A1 impairs auditory spatial learning. a Sound localization in the session before the right ear was plugged shown by plotting the mean proportion of correct scores (and 95% confidence intervals) for 1000 ms bursts of broadband noise at each of 12 loudspeakers positioned at equal intervals in the horizontal plane (0° is directly in front). Data are from ferrets in which left A1 activity was suppressed by illumination of ArchT during each stimulus presentation (green, n = 13) and from a control group (black, n = 13). b Proportion of correct responses (averaged across all speaker locations) achieved by each animal in both groups in the Pre-plug session, on each of the 10 days over which the plug was worn (days 1–10), and in the session following its removal (Post-plug). c The difference in adaptation rate between these groups is shown by plotting the proportion of correct responses for the first 2 days and the last 2 days of monaural occlusion (ANOVA, F3,100 = 62.531, P< 0.0001, post hoc Scheffé test, ** indicates P ≤ 0.01). d Magnitude of the localization errors on incorrect trials before, during and after this period of monaural occlusion. Symbols in (b) and (d) represent data from individual animals, and the lines and shaded areas are the best linear fits and 95% confidence intervals of these fits, respectively, over the 10 days of monaural occlusion. Source data are provided as a Source Data file
Fig. 5
Fig. 5
Difference between localization accuracy before and after monaural occlusion. The difference between the proportion of correct responses is shown for individual animals prior to plugging one ear and following removal of the earplug. The control group of ferrets underwent two periods of training (Control 1, n = 13, and Control 2, n = 9), whereas the animals in which ArchT was expressed in high-frequency A1 received three blocks of training whilst wearing an earplug, with laser light delivered to the implanted optical fiber on each trial during the first (ArchT laser on 1, n = 13) and third block (ArchT laser on 2, n = 12), but not during the second block (ArchT laser off, n = 13). The gray symbols represent data from individual animals, and the tick marks and error bars indicate the mean ± SD. Source data are provided as a Source Data file
Fig. 6
Fig. 6
Learning retrieval during successive periods of monaural occlusion. Proportion of correct responses (averaged across all speaker locations) is shown in the session before the right ear was plugged (Pre-plug), on each of the 10 days over which the plug was worn (days 1–10), and in the session following its removal (Post-plug). a Data from the control group (n = 13) are shown for two 10-day periods of monaural occlusion: lines and shaded areas correspond to the best linear fits and 95% confidence intervals, respectively, while the symbols represent individual performance during the second period of monaural deprivation (individual animal data for the first period are shown in Fig. 4b). b Data from the ferrets in which ArchT was expressed in high-frequency A1 (n = 13) are shown for the first two 10-day periods of monaural occlusion, with light delivered to the implanted optical fiber to suppress cortical activity on every trial during the first block (laser on 1, green), but not during the second block (laser off, gray). Colored symbols represent individual performance under each condition. c Data from the ferrets in which ArchT was expressed in high-frequency A1 for the second and third 10-day periods of monaural occlusion; the laser was off during the second block (gray, as in b, n = 13), but on during each stimulus presentation in the third block (laser on 2, green, n = 12). Note that perturbing cortical activity no longer has any effect on the localization accuracy of the animals. Source data are provided as a Source Data file

References

    1. Watanabe T, Sasaki Y. Perceptual learning: toward a comprehensive theory. Annu. Rev. Psychol. 2015;66:197–221. doi: 10.1146/annurev-psych-010814-015214. - DOI - PMC - PubMed
    1. Levi DM, Li RW. Improving the performance of the amblyopic visual system. Philos. Trans. R. Soc. Lond. B Biol. Sci. 2009;364:399–407. doi: 10.1098/rstb.2008.0203. - DOI - PMC - PubMed
    1. Firszt JB, Reeder RM, Dwyer NY, Burton H, Holden LK. Localization training results in individuals with unilateral severe to profound hearing loss. Hear. Res. 2015;319:48–55. doi: 10.1016/j.heares.2014.11.005. - DOI - PMC - PubMed
    1. Anderson S, White-Schwoch T, Parbery-Clark A, Kraus N. Reversal of age-related neural timing delays with training. Proc. Natl Acad. Sci. USA. 2013;110:4357–4362. doi: 10.1073/pnas.1213555110. - DOI - PMC - PubMed
    1. Schreiner CE, Polley DB. Auditory map plasticity: diversity in causes and consequences. Curr. Opin. Neurobiol. 2014;24:143–156. doi: 10.1016/j.conb.2013.11.009. - DOI - PMC - PubMed

Publication types