. 2019 Jul 12;10(1):3081.
doi: 10.1038/s41467-019-11139-3.

Therapeutic efficacy of dimethyl fumarate in relapsing-remitting multiple sclerosis associates with ROS pathway in monocytes

Affiliations

Therapeutic efficacy of dimethyl fumarate in relapsing-remitting multiple sclerosis associates with ROS pathway in monocytes

Karl E Carlström et al. Nat Commun. .

Abstract

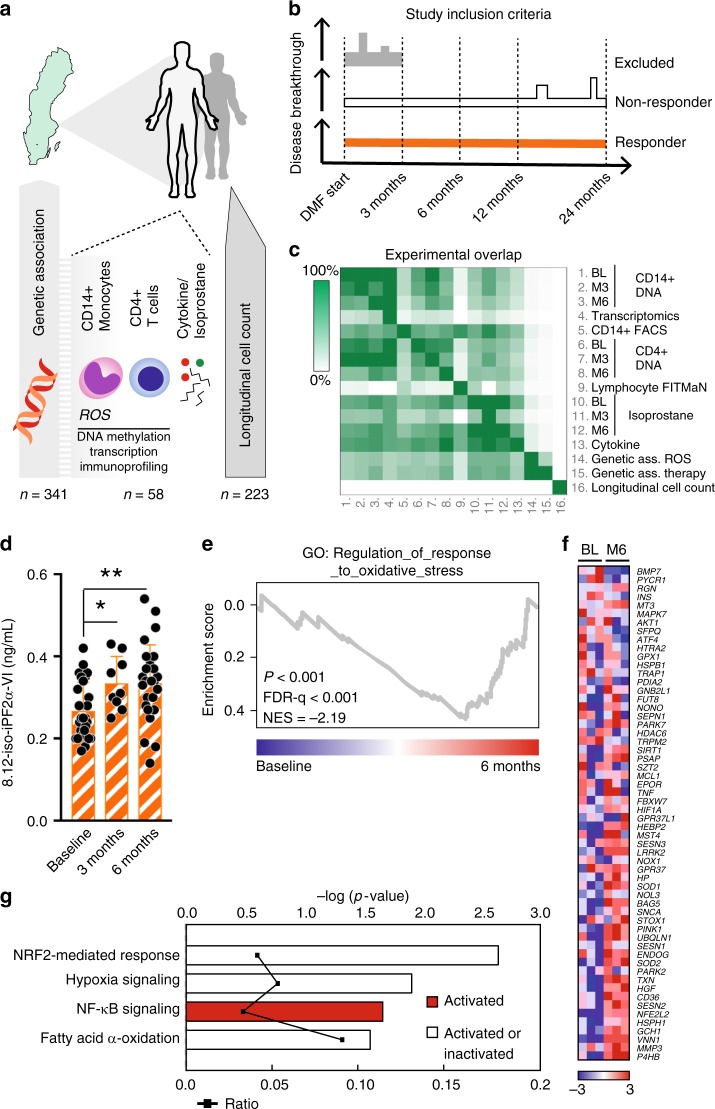
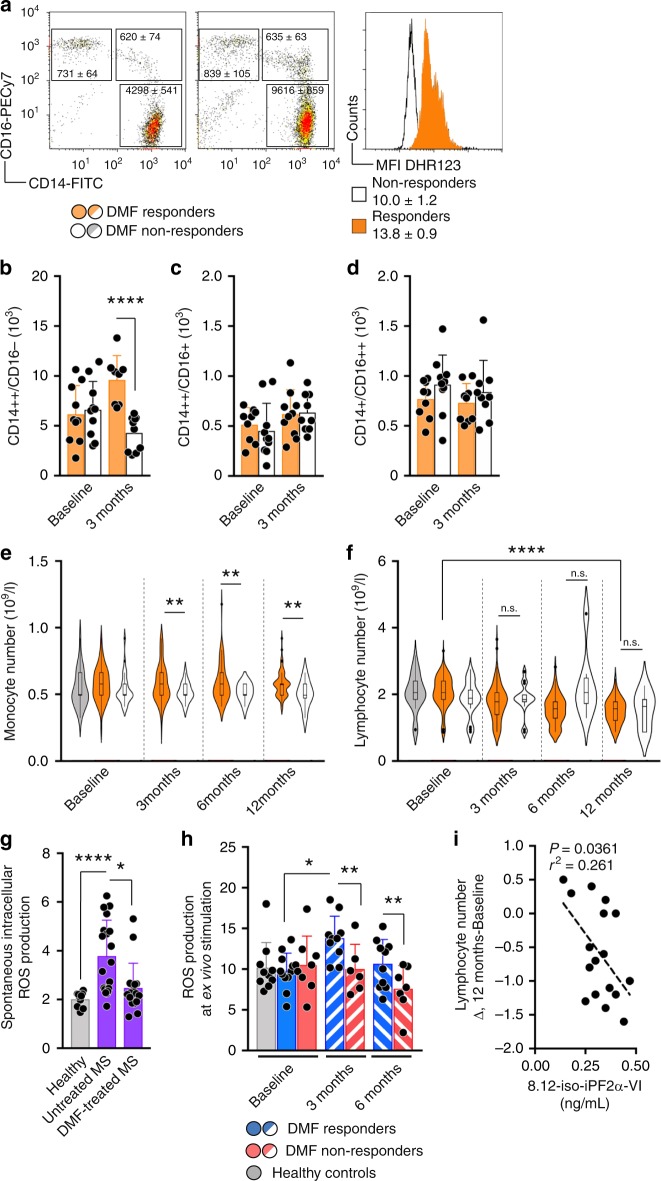
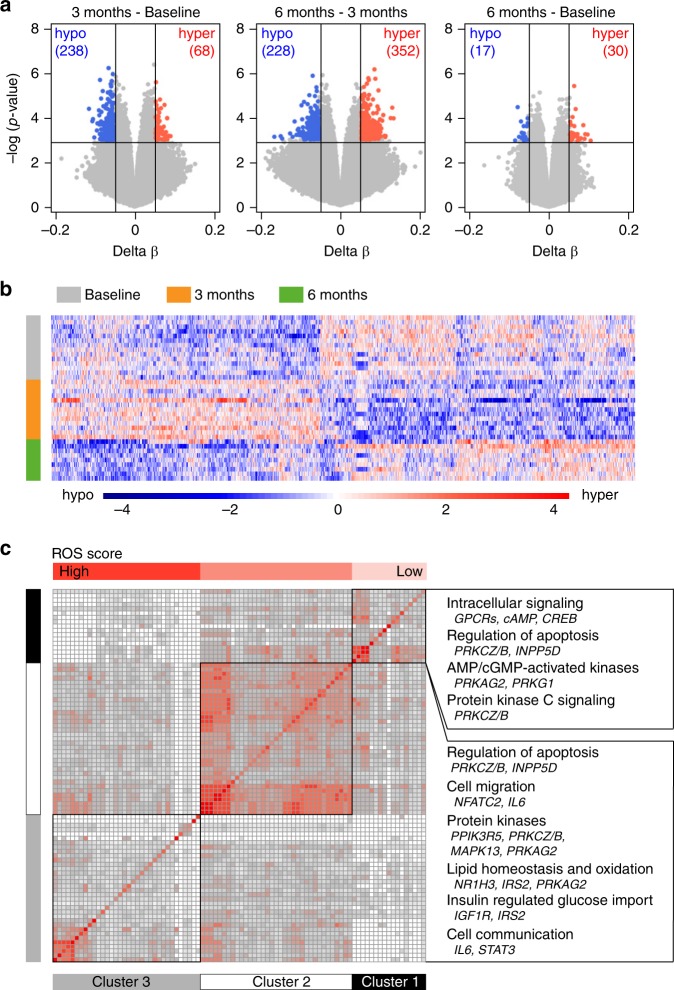
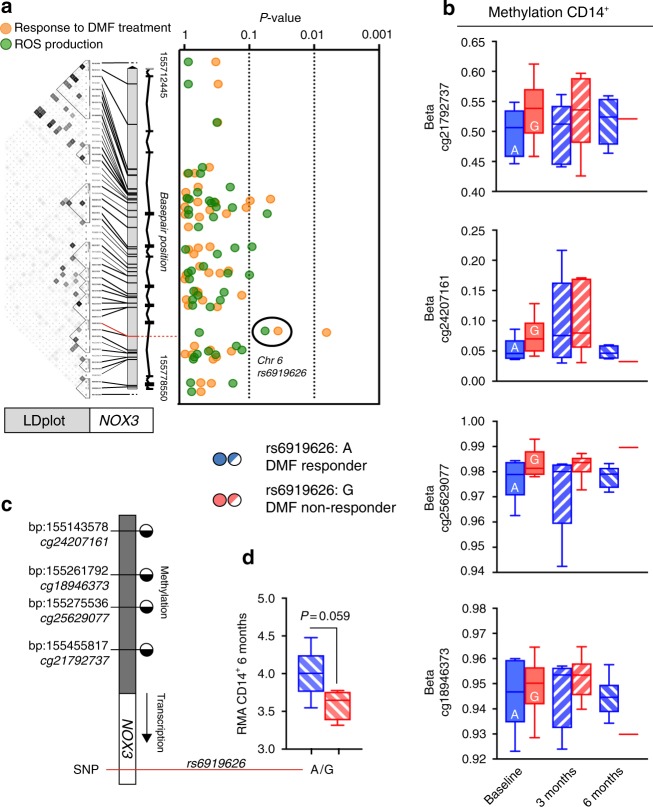
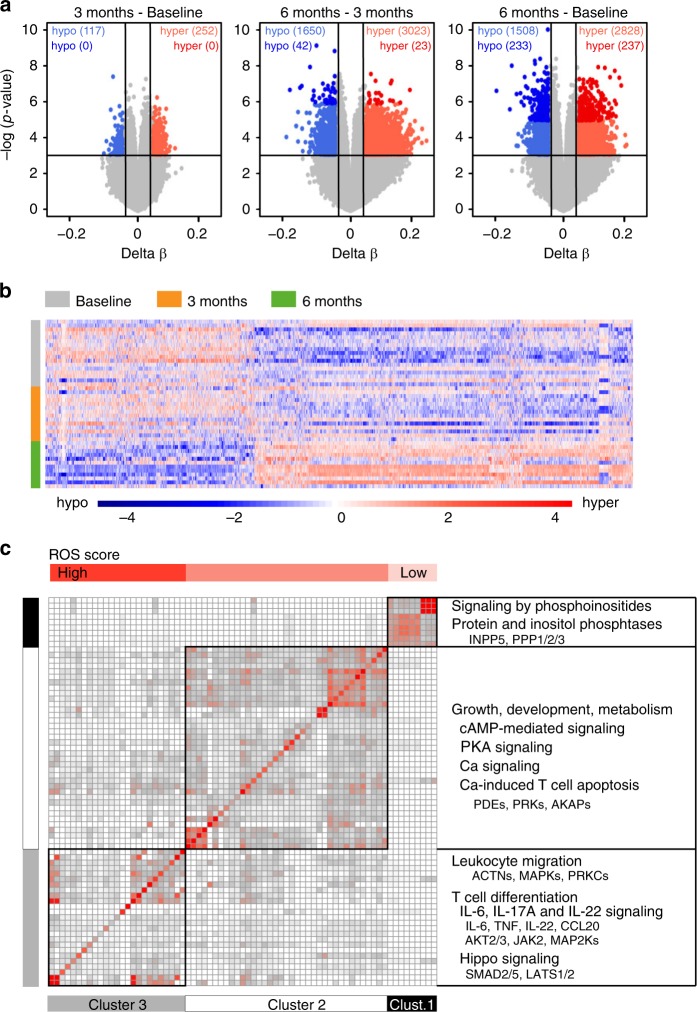
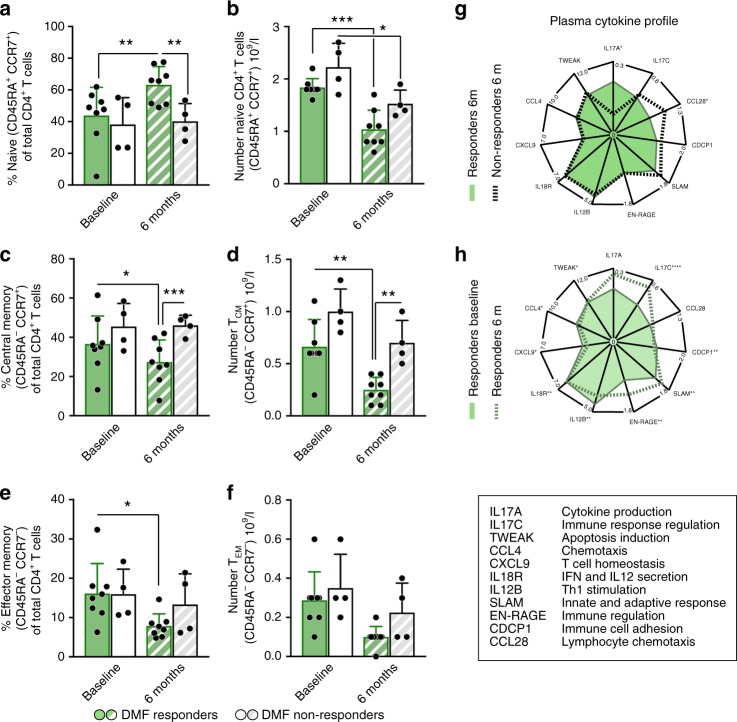
Dimethyl fumarate (DMF) is a first-line-treatment for relapsing-remitting multiple sclerosis (RRMS). The redox master regulator Nrf2, essential for redox balance, is a target of DMF, but its precise therapeutic mechanisms of action remain elusive. Here we show impact of DMF on circulating monocytes and T cells in a prospective longitudinal RRMS patient cohort. DMF increases the level of oxidized isoprostanes in peripheral blood. Other observed changes, including methylome and transcriptome profiles, occur in monocytes prior to T cells. Importantly, monocyte counts and monocytic ROS increase following DMF and distinguish patients with beneficial treatment-response from non-responders. A single nucleotide polymorphism in the ROS-generating NOX3 gene is associated with beneficial DMF treatment-response. Our data implicate monocyte-derived oxidative processes in autoimmune diseases and their treatment, and identify NOX3 genetic variant, monocyte counts and redox state as parameters potentially useful to inform clinical decisions on DMF therapy of RRMS.


Conflict of interest statement

F.P. has received research grants from Biogen, Novartis, and Genzyme, and fees for serving as Chair of DMC in clinical trials with Parexel. T.O. has received unrestricted MS research grants, and/or lecture advisory board honoraria from Biogen, Novartis, Sanofi and Roche. The remaining authors declare no competing interests.

Figures

Fig. 1
Fig. 1
DMF induce increased isoprostane oxidation and transcription in response to oxidative stress. a Scheme of the study design. Peripheral blood was sampled at the clinic of patients fulfilling the criteria for RRMS and prescription of DMF. b Definition of RRMS patients as responders or non-responders to DMF therapy. c Experimental overlap between different assessments in the study d 8.12-iso-iPF2α-VI-isoprostane in plasma from paired patients sampled at three months (n = 9) and six months (n = 26) after DMF start compared to baseline (n = 26). e, f GSEA on mRNA from CD14+ sorted monocytes at baseline (n = 3) and six months (n = 3) shows an enrichment of upregulated genes involved in GO_REGULATION_OF_RESPONSE_TO_OXIDATIVE_STRESS at six months. ES, P-value and FDR were calculated by GSEA with weighted enrichment statistics and ratio of classes for the metric as input parameters. g Pathway analysis demonstrates oxidative stress-related canonical pathways in response to DMF (n = 3). Differentially expressed genes (P < 0.01 with average RMA > 4, one-way ANOVA) were used in IPA and significant pathways were determined with the right-tailed Fisher’s exact test (P < 0.05). The ratio indicates pathway’s activation status upon DMF treatment (g). Analysis in (d) was done by one-way ANOVA comparing both time points to baseline and graph shows mean and S.D. *P < 0.05, **P < 0.01
Fig. 2
Fig. 2
Monocyte numbers and ROS generation separate DMF responders from non-responders. a Representative plots for gating strategy of monocyte subsets stating mean ± S.E.M. at three months. Histogram shows representative DHR-123 MFI ± S.E.M. at 3 months. bd Number of monocyte subsets in DMF responders (n = 10) and non-responders (n = 10) at baseline and at three months. e Violin with box-and-whisker plots indicating values outside the 5–95 percentile are indicated as dots of monocytes and (f) lymphocytes from healthy controls (n = 28), DMF responders (n = 171) and DMF non-responders (n = 26) over time. g Spontaneous generation of ROS in healthy controls (n = 10) and DMF untreated (n = 18) and treated (n = 18) patients. h ROS generation in ex vivo-stimulated monocytes from DMF responders (n = 10) and non-responders (n = 7) measured with DHR-123. i Correlation between Δlymphocyte number and 8.12-iso-iPF2α-VI-isoprostanes at 6 months determined with Spearman’s correlation (n = 17). Graph (bd, g, h) shows mean and S.D. Analysis in (f) was performed with ANOVA for linear trend over time and (e) to test mean comparison between responders and non-responders at every timepoint. Remaining analysis between paired patients were performed with paired t test whereas analysis between healthy controls and patients or between patient groups were performed with Student’s two-tailed t test. *P < 0.05, **P < 0.01, ***P < 0.001, ****P < 0.0001
Fig. 3
Fig. 3
Monocytes undergo DNA methylation changes at three months. a DNA methylation was measured using Illumina EPIC arrays in CD14+ monocytes sorted from peripheral blood of RRMS patients before (baseline; BL, n = 14) treatment with DMF as well as three and six months following the treatment (M3 n = 12 and M6 n = 9). Volcano plots illustrating differences in DNA methylation between different time points following DMF treatment. Hyper- and hypo-methylated CpGs with min 5% methylation change and P < 0.001 (Linear model testing) are indicated in red and blue, respectively. b Heat map of 1614 most significant differentially methylated CpG sites between the time points (the scale represents z-score). c Clusters of canonical pathways, derived using Ingenuity Pathway Analysis, suggest functions that are affected in monocytes following DMF treatment. The significance of pathways was determined with the right-tailed Fisher’s exact test (P < 0.05) and the clustering was performed on the relative risk for the overlap of molecules between the pathways using k-means. The horizontal top bar indicates the degree of overlap with selected ROS genes. Summary of the key functions and their constituent genes that displayed changes in DNA methylation upon DMF treatment are given to the right
Fig. 4
Fig. 4
Genetic association with SNPs in NOX3 to ROS generation and response to DMF treatment. a The G allele of rs6919626 (red line) was suggestively associated with reduced ROS generation in monocytes after ex vivo stimulation with E. coli (P = 0.057, β = −0.28) and significantly associated with lack of response to DMF treatment (P = 0.036, OR = 1.57). The Linkage Disequilibrium (LDplot) of the markers in NOX3 was generated with HaploView4.2 in the Swedish population. Darker gray indicates higher r2 between markers. b Methylation in four CpGs in the NOX3 promotor region over time and between responders (A allele) and non-responders (G allele) (Baseline: n = 6 + 6, three months: n = 5 + 6, six months: n = 6 + 1). c Schematic illustration indicating methylated or unmethylated CpGs in the NOX3 promotor region. d NOX3 transcription in responders and non-responders at six months following DMF (n = 5 + 4). Analysis performed using Welch’s two-tailed t test. Graph (b, d) shows box-and-whisker plots indicating values outside the 5–95 percentile are indicated as dots
Fig. 5
Fig. 5
DNA methylation changes are delayed in T cells and occur after six months. a DNA methylation was measured using Illumina EPIC arrays in CD4+ T cells sorted from peripheral blood of RRMS patients before (baseline; BL, n = 17) treatment with DMF as well as three and six months following the treatment M3 and M6 n = 12). Volcano plots illustrating differences in DNA methylation between different time points following DMF treatment. Hyper- and hypo-methylated CpGs with min 5% methylation change and P < 0.001 (Linear model testing) are indicated in red and blue, respectively. b Heat map of 1614 most significant differentially methylated CpG sites between the time points (the scale represents z-score). c Clusters of canonical pathways, derived using Ingenuity Pathway Analysis suggest functions that are affected in monocytes following six months of DMF treatment. The heat-map depicts cluster 1–3. The significance of pathways was determined with the right-tailed Fisher’s exact test (P < 0.05) and the clustering was performed on the relative risk for the overlap of molecules between the pathways using Mclust. The horizontal top bar indicates the degree of overlap with selected ROS genes. Summary of the key functions and their constituent genes that displayed changes in DNA methylation upon DMF treatment are given to the right
Fig. 6
Fig. 6
DMF responders show altered levels of CD4+ T cells subsets compared to non-responders. a, b Percentage and absolute number of naïve cells of CD4+ T cells was analyzed in DMF responders (n = 8) and non-responders (n = 4) at baseline and after six months. cf Central memory T cells (TCM) was defined as CD45RACCR7+ and effector memory T cells (TEM) as CD45RACCR7+. Graphs show means and S.D. and all analysis between paired patients are performed with paired t test. g, h Normalized protein expression (NPX) in plasma of IL17A, IL17C, CCL28, CDCP1, SLAM, EN-RAGE, IL12B, IL18R CXCL9 CCL4 and TWEAK were analyzed in responders (n = 29) and non-responders (n = 9) at baseline and 6 months after DMF intervention. *P < 0.05, **P < 0.01, ***P < 0.001. Asterisk in (d) indicate P value adjusted for multiple testing. **adjP < 0.01, ***adjP < 0.0001

References

    1. Suzuki T, Motohashi H, Yamamoto M. Toward clinical application of the Keap1-Nrf2 pathway. Trends Pharmacol. Sci. 2013;34:340–346. doi: 10.1016/j.tips.2013.04.005. - DOI - PubMed
    1. Mossberg N, et al. Oxygen radical production in leukocytes and disease severity in multiple sclerosis. J. Neuroimmunol. 2009;213:131–134. doi: 10.1016/j.jneuroim.2009.05.013. - DOI - PubMed
    1. Mix E, et al. Lymphocyte subpopulations, oxidative burst and apoptosis in peripheral blood cells of patients with multiple sclerosis-effect of interferon-beta. Autoimmunity. 2003;36:291–305. doi: 10.1080/0891693031000152697. - DOI - PubMed
    1. Linker RA, et al. Fumaric acid esters exert neuroprotective effects in neuroinflammation via activation of the Nrf2 antioxidant pathway. Brain. 2011;134:678–692. doi: 10.1093/brain/awq386. - DOI - PubMed
    1. Gopal S, et al. Evidence of activation of the Nrf2 pathway in multiple sclerosis patients treated with delayed-release dimethyl fumarate in the Phase 3 DEFINE and CONFIRM studies. Mult. Scler. 2017;23:1875–1883. doi: 10.1177/1352458517690617. - DOI - PubMed

Publication types

MeSH terms